As a patient, navigating healthcare often feels like decoding a complex rulebook. There are rules for everything: medication dosages, timing protocols, follow-up intervals. Some of these rules matter a lot, for either short term or longer term safety or health outcomes. But at other times… the rules seem senseless and are applied differently based on different healthcare providers within the same specialty, let alone across different specialities. As a patient, it’s easy to initially want to try to follow all rules perfectly, but feel unable to because the rules don’t make sense in a personal context. Over time, it can be hard to resist the conclusion that the rules don’t matter or don’t apply to you. The reality is somewhere in between. And it’s the in-between part that can be a challenging balance to figure out. Learning to navigate this balance requires understanding which rules are flexible and which aren’t.
I’ve learned there’s enormous value in digging into the “why” behind medical recommendations, when I can. Take acetaminophen (Tylenol), for example. There’s a clear, non-negotiable daily limit on the bottle because exceeding it is dangerous. The over-the-counter recommendation for Extra Strength acetaminophen (500 mg tablets) is no more than two tablets every six hours, not exceeding six tablets in 24 hours. Which actually means 3 doses per day, despite the 6 hour recommendation. This maximum daily limit (no more than six tablets) is set close to the safety threshold; exceeding that limit (eight tablets in 24 hours) increases the risk of severe liver damage.
Understanding this daily limit provides flexibility within safe boundaries (with the obvious caveat that I’m not a doctor and you should always talk to your own doctor). The “every 6 hours” recommendation ensures stable bioavailability of acetaminophen throughout the day, and making sure over the course of 24 hours that you are safely and completely below the max dosage line. Slight deviations to timing, such as taking a dose at 5 hours and 30 minutes instead of precisely 6 hours because you’re about to go to sleep, do not inherently cause harm, as long as the total intake remains within the safe daily limit. This is an example where a compliance-oriented guideline is designed primarily for optimal adherence at the population based level, rather than marking an absolute safety threshold at each individual dose.
There are a lot of things like this in healthcare, but it’s not always explained to patients and patients may not always think to stop and question the why – or have the time and resources to do so – and figure it out from first principles to decide whether a deviation on the timing or amount is risky, or not.
But many healthcare rules aren’t as clearly defined by safety, as is the case of the acetaminophen example. Other rules are shaped by convenience, compliance, and practical constraints of research protocols.
Timelines like “two weeks,” “one month,” or “six months” for follow-up visits or medication titration points often reflect research convenience more than physiological necessity or even the ideal best practice. These intervals might mark study endpoints, or convenience to the healthcare system, but they don’t necessarily pinpoint the best timeline overall or the right timeline for an individual patient. It can be hard as a patient to decide if your experience is deviating from the typical timeline in a beneficial or non-optimal way, and if and when to speak up and try to better adjust to the system or adjust the system to meet your needs (such as scheduling an earlier appointment rather than waiting for a mythical 4 month follow up when it’s clear by months 2-3 that there is no benefit to a treatment because any impact should have been observed by then, even if it wasn’t significant).
As a patient, understanding when rules reflect safety versus when they’re crafted primarily for convenience is crucial, but hard. Compliance-driven rules can sometimes be thoughtfully bent. They might be able to be adjusted to better fit individual circumstances without compromising safety. For instance, a medication schedule set strictly every eight hours might be modified slightly based on daily activities or sleep patterns, provided the change remains within safe therapeutic boundaries over the course of 24 hours. (And patients should be able to discuss this with their doctors! But time availability or access may influence the ability to have these conversations up front or over time as conflicts or issues arise.)
Yet, bending rules requires confidence, critical thinking, and often significant resources, whether those are educational, emotional, health itself, or financial. It means feeling secure enough to question a provider’s advice or advocate for adjustments tailored to individual needs. It’s not always even questioning the advice itself, but checking the understanding and interpretation of how you apply it to your own life. Most providers understand that, and have no problem confirming your understanding. Other times, though, it can accidentally or unintentionally cause conflict, if providers sometimes perceive questioning of their judgement.
I’ve tripped into that situation at least once accidentally before, when I had a follow up appointment with a non-MD clinical provider who wasn’t my main doctor at the practice, who I was seeing for an acute short-term issue. She was describing a recommendation for an rx, specifically because I have diabetes. In the past, I have received over-treatment from most providers because of having type 1 diabetes, because many recommendations for non-diabetes management that have guidance for people with diabetes are based on an assumption of non-optimal healing and non-optimal glucose management. Given that at the time I was already using OpenAPS, with ideal glucose outcomes for years, and no issues ever with reduced healing, I asked if the prescription recommendation would be given to the same type of patient without diabetes. I was trying to help myself make an informed decision about whether to accept the recommendation for the rx to determine if it was appropriate. If it was just because I had diabetes, it warranted additional discussion. It wasn’t about her clinical judgement per se, but about a shared decision making process to right-size the next steps to my individual situation, rather than assume that population-based outcomes for people with diabetes were automatically appropriate. Because of my experience, I know that sometimes they are and sometimes they are not, so I’ve learned to ask these questions. However, some combination of the lack of existing relationship with this provider; perhaps a poorly worded question; and other factors made the provider act defensive. I got the information I needed, decided the rx was appropriate for me and I would use it, and went about my business. But I got a follow up call later from another MD (again, not my MD) who was defensive and calling to check why I was questioning this non-MD provider and it came across as if I was questioning her because the provider was a non-MD…which was not the issue at all! It was about me and my care and making sure I understood the root of the recommendation: whether it was because of the health situation or because I had diabetes. (It was the former, about the health situation, although initially articulated as being simply because of the latter fact of simply having diabetes.)
This situation has colored all future encounters with healthcare providers for me. Seeing new providers who I don’t have a longstanding relationship with makes me nervous, from learned, lived experience about how some of these one-off encounters have gone in the past, like the ones above.
Unfortunately, patients who push back against compliance-driven rules or simply ask questions to facilitate their understanding risk being labeled “non-compliant” or “non-adherent”, and sometimes we get labels on our chart for asking questions and being misunderstood, despite our good intentions. Such labels can have lasting impacts, influencing how future providers perceive our reliability and credibility and can cause subsequent issues for receiving or even being granted access to healthcare.
This creates a profound dilemma for patients: follow all rules precisely, without question, but potentially sacrificing optimal care, or thoughtfully question to bend them and risk being misunderstood or penalized for trying to optimize your individual outcomes when the one-size-fits-all approach doesn’t actually fit.
Breaking compliance-oriented rules isn’t about defiance. At least, it’s never been that way for me. It’s about personalization and achieving the best possible outcomes. But not every patient has the luxury of confidently navigating these nuances, and even when they do, as described above, it can still sometimes turn out not so well. Many patients don’t have the time, energy, resources, or privilege required to safely challenge or reinterpret guidelines. Or they’ve been penalized for doing so. Consequently, they may remain strictly compliant, potentially missing opportunities for better individual outcomes and higher quality of life.
Healthcare needs to provide clarity around which rules are absolute safety boundaries and which are recommendations optimized primarily for convenience or broad adherence for the safe general public use. Patients deserve transparency and support in discerning between what’s bendable for individual benefit and what’s non-negotiable for safety.
 And: patients should not be punished for asking questions in order to better understand or check their understanding.
Knowing the difference on what bends and what breaks matters. But many patients remain caught in the delicate balance between bending and breaking, carefully evaluating risks and rewards, often alone.
 I’ve learned from experience that waiting rarely creates better outcomes. It only delays impact.
 (Thank you).
 I encourage you to think about scaling yourself and identifying a task or series of tasks where you can get in the habit of leveraging these tools to do so. Like most things, the first time or two might take a little more time. But once you figure out what tasks or projects are suited for this, the time savings escalate. Just like learning how to use any new software, tool, or approach. A little bit of invested time up front will likely save you a lot of time in the future.
 If you have been prescribed pancreatic enzyme replacement therapy (PERT), aka enzymes for exocrine pancreatic insufficiency (EPI or PEI), you may be wondering how long it will take before you start to feel better or it starts to work. This is a common question, and the answer depends on several factors, including the dosage, meal composition, and how well your body uses the enzymes. Some improvements can be seen within a single meal, while other benefits take longer to manifest. It also depends on whether you have EPI, or if you have EPI in concert with other types of gastrointestinal conditions, because some of your symptoms may be coming from other conditions.
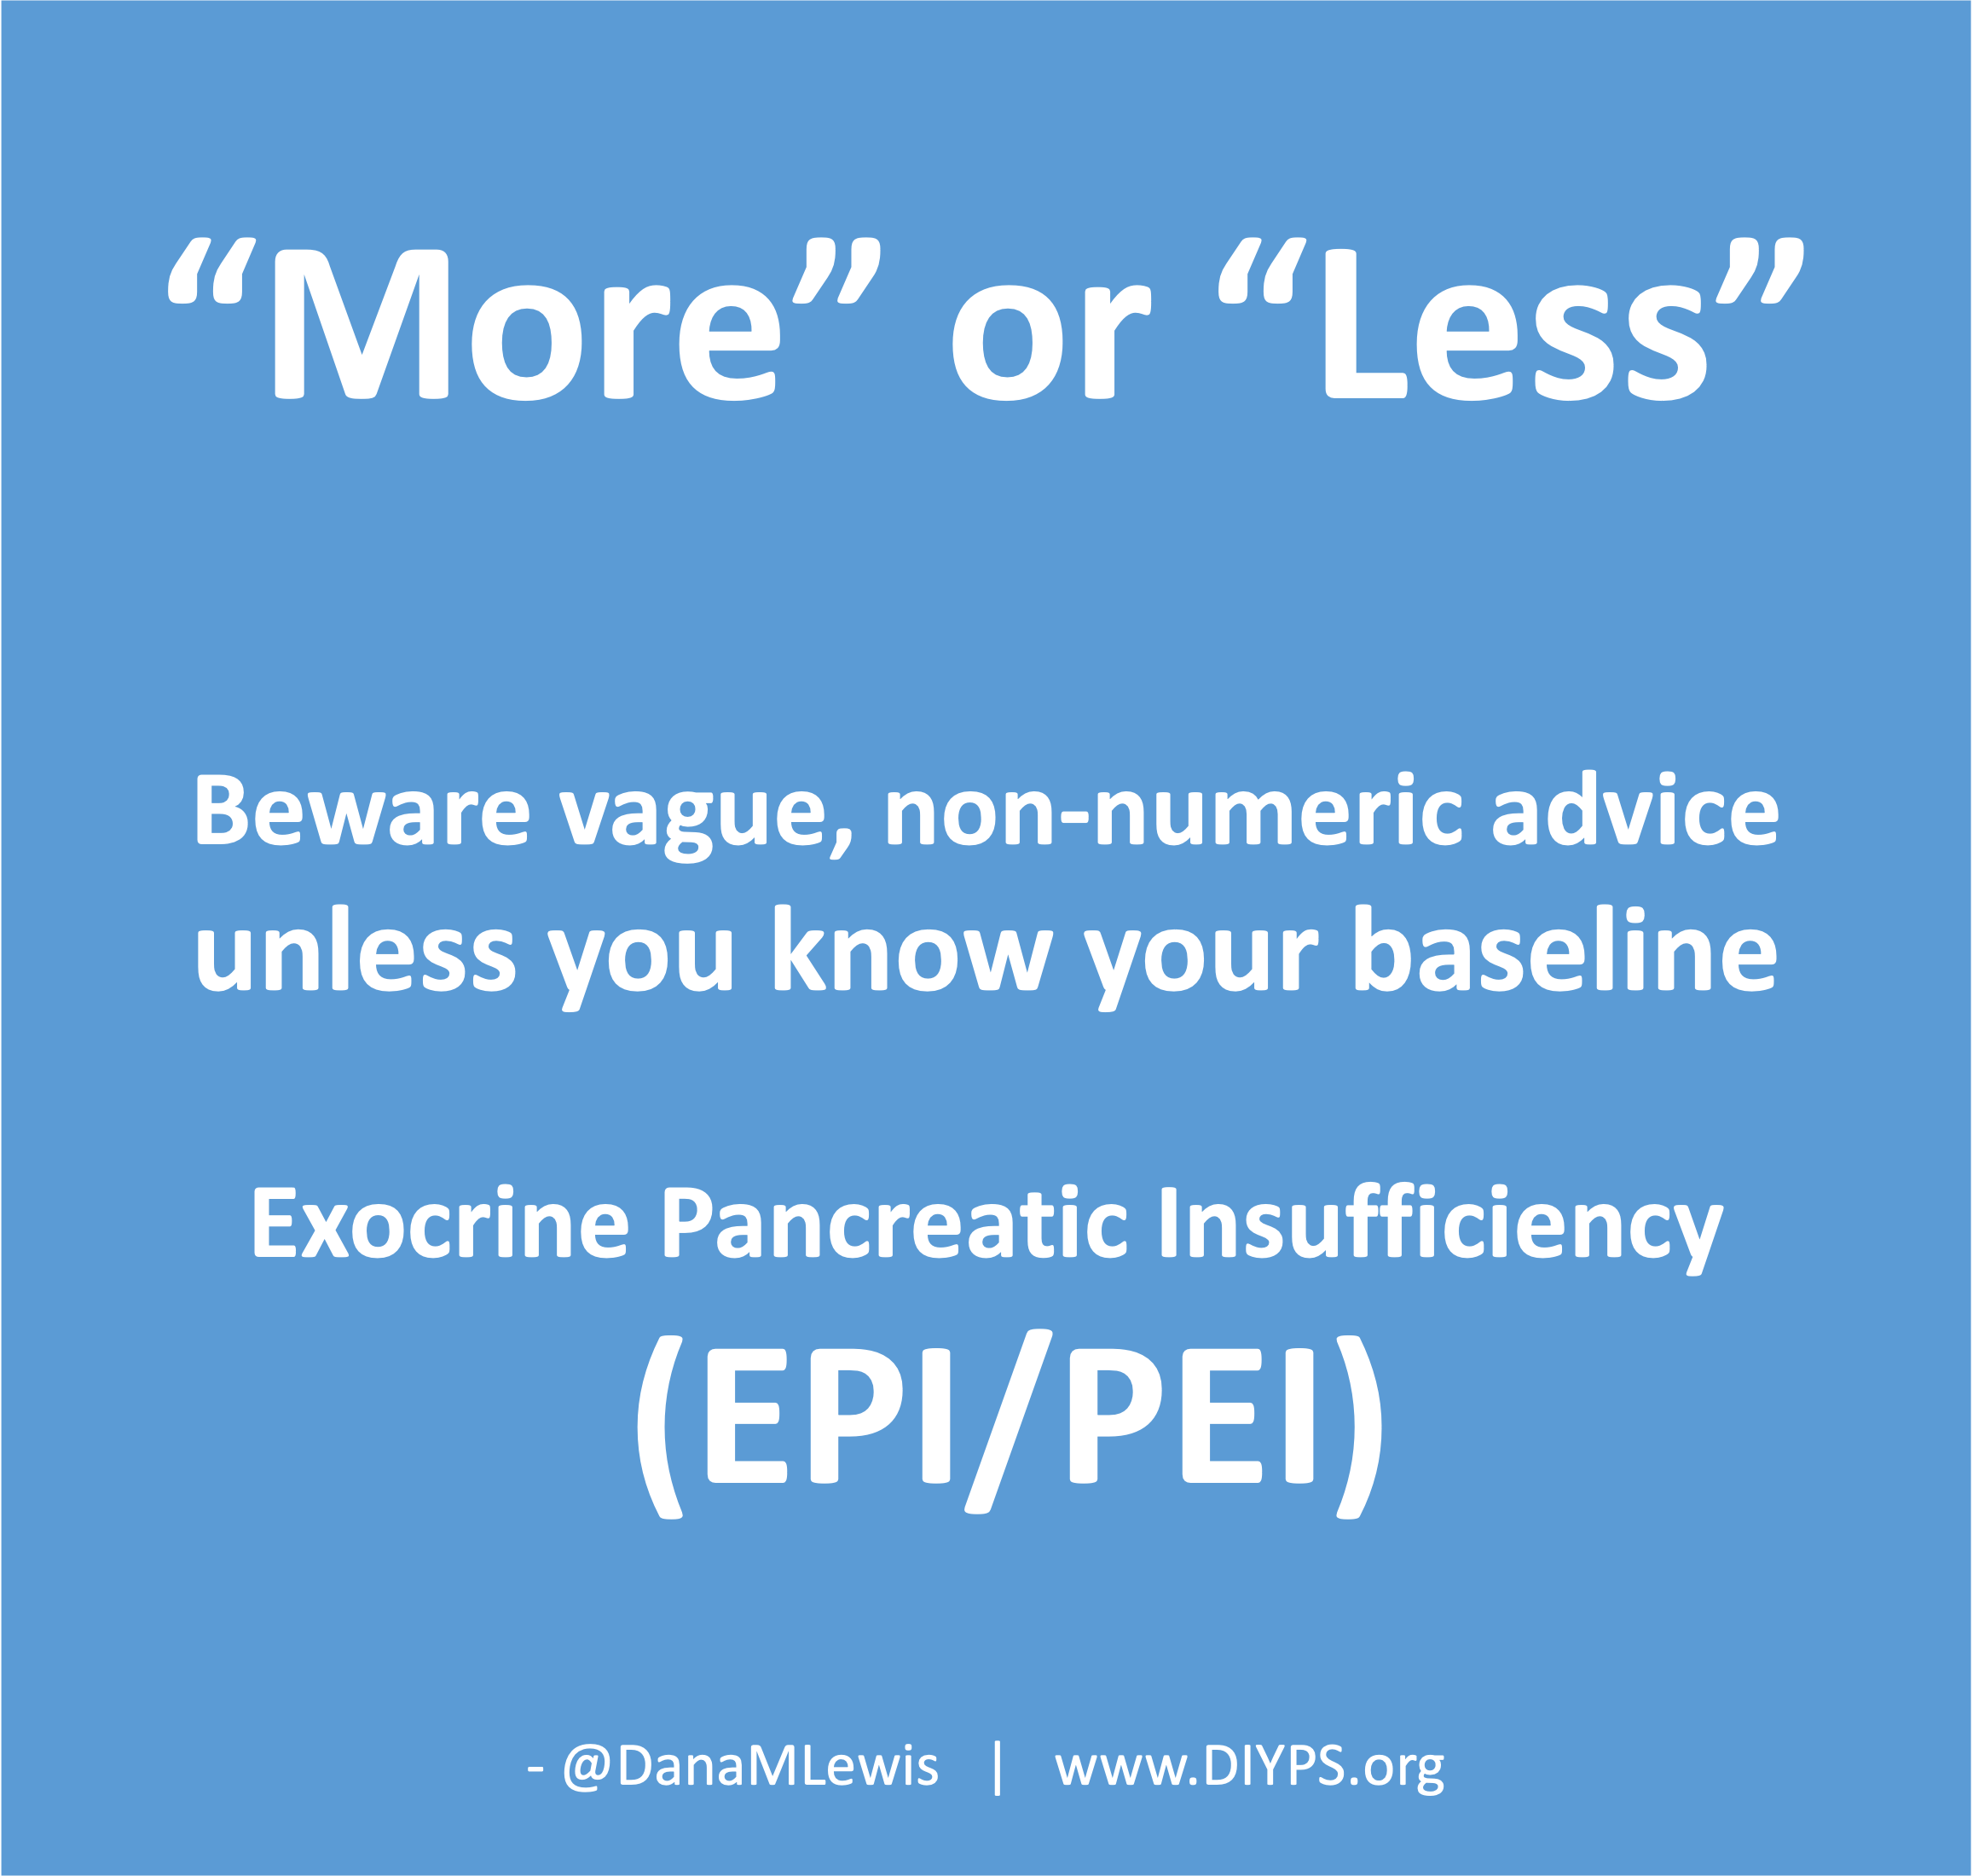 TL;DR: Instead of arbitrarily lowering or increasing fat or fiber in the diet, measure and estimate what you are consuming first. If you have EPI,
  It occurred to me that maybe I could tweak it somehow and make the bullets of the list represent food items. I wasn’t sure how, so I asked the LLM if it was possible. Because I’ve done my other ‘design’ work in PowerPoint, I went there and quickly dropped some shapes and lines to simulate the icon, then tested exporting – yes, you can export as SVG! I spent a few more minutes tweaking versions of it and exporting it. It turns out, yes, you can export as SVG, but then the way I designed it wasn’t really suited for SVG use. When I had dropped the SVG into XCode, it didn’t show up. I asked the LLM again and it suggested trying PNG format. I exported the icon from powerpoint as PNG, dropped it into XCode, and it worked!
 If you can shift your mindset from fear and avoidance to curiosity and experimentation, you might discover new skills, solve problems you once thought were impossible, and open up entirely new opportunities.
 TLDR: Instead of asking “Which model is best?”, a better question might be:
Recent Comments