Functional Self-Tracking is The Only Self-Tracking I Do

“I could never do that,” you say.

And I’ve heard it before.

Eating gluten free for the rest of your life, because you were diagnosed with celiac disease? Heard that response (I could never do that) for going on 14 years.

Inject yourself with insulin or fingerstick test your blood glucose 14 times a day? Wear an insulin pump on your body 24/7/365? Wear a CGM on your body 24/7/365?

Yeah, I’ve heard you can’t do that, either. (For 20 years and counting.) Which means I and the other people living with the situations that necessitate these behaviors are…doing this for fun?

We’re not.

More recently, I’ve heard this type of comment come up about tracking what I’m eating, and in particular, tracking what I’m eating when I’m running. I definitely don’t do that for fun.

I have a 20+ year strong history of hating tracking things, actually. When I was diagnosed with type 1 diabetes, I was given a physical log book and asked to write down my blood glucose numbers.

“Why?” I asked. They’re stored in the meter.

The answer was because supposedly the medical team was going to review them.

And they did.

And it was useless.

“Why were you high on February 22, 2003?”

Whether we were asking this question in March of 2003 or January of 2023 (almost 20 years later), the answer would be the same: I have no idea.

BG data, by itself, is like a single data point for a pilot. It’s useless without the contextual stream of data as well as other metrics (in the diabetes case, things like what was eaten, what activity happened, what my schedule was before this point, and all insulin dosed potentially in the last 12-24h).

So you wouldn’t be surprised to find out that I stopped tracking. I didn’t stop testing my blood glucose levels – in fact, I tested upwards of 14 times a day when I was in high school, because the real-time information was helpful. Retrospectively? Nope.

I didn’t start “tracking” things again (for diabetes) until late 2013, when we realized that I could get my CGM data off the device and into the laptop beside my bed, dragging the CGM data into a CSV file in Dropbox and sending it to the cloud so an app called “Pushover” would make a louder and different alarm on my phone to wake me up to overnight hypoglycemia. The only reason I added any manual “tracking” to this system was because we realized we could create an algorithm to USE the information I gave it (about what I was eating and the insulin I was taking) combined with the real-time CGM data to usefully predict glucose levels in the future. Predictions meant we could make *predictive* alarms, instead of solely having *reactive* alarms, which is what the status quo in diabetes has been for decades.

So sure, I started tracking what I was eating and dosing, but not really. I was hitting buttons to enter this information into the system because it was useful, again, in real time. I didn’t bother doing much with the data retrospectively. I did occasional do things like reflect on my changes in sensitivity after I got the norovirus, for example, but again this was mostly looking in awe at how the real-time functionality of autosensitivity, an algorithm feature we designed to adjust to real-time changes in sensitivity to insulin, dealt throughout the course of being sick.

At the beginning of 2020, my life changed. Not because of the pandemic (although also because of that), but because I began to have serious, very bothersome GI symptoms that dragged on throughout 2020 and 2021. I’ve written here about my experiences in eventually self-diagnosing (and confirming) that I have exocrine pancreatic insufficiency, and began taking pancreatic enzyme replacement therapy in January 2022.

What I haven’t yet done, though, is explain all my failed attempts at tracking things in 2020 and 2021. Or, not failed attempts, but where I started and stopped and why those tracking attempts weren’t useful.

Once I realized I had GI symptoms that weren’t going away, I tried writing down everything I ate. I tried writing in a list on my phone in spring of 2020. I couldn’t see any patterns. So I stopped.

A few months later, in summer of 2020, I tried again, this time using a digital spreadsheet so I could enter data from my phone or my computer. Again, after a few days, I still couldn’t see any patterns. So I stopped.

I made a third attempt to try to look at ingredients, rather than categories of food or individual food items. I came up with a short list of potential contenders, but repeated testing of consuming those ingredients didn’t do me any good. I stopped, again.

When I first went to the GI doctor in fall of 2020, one of the questions he asked was whether there was any pattern between my symptoms and what I was eating. “No,” I breathed out in a frustrated sigh. “I can’t find any patterns in what I’m eating and the symptoms.”

So we didn’t go down that rabbit hole.

At the start of 2021, though, I was sick and tired (of being sick and tired with GI symptoms for going on a year) and tried again. I decided that some of my “worst” symptoms happened after I consumed onions, so I tried removing obvious sources of onion from my diet. That evolved to onion and garlic, but I realized almost everything I ate also had onion powder or garlic powder, so I tried avoiding those. It helped, some. That then led me to research more, learn about the categorization of FODMAPs, and try a low-FODMAP diet in mid/fall 2021. That helped some.

Then I found out I actually had exocrine pancreatic insufficiency and it all made sense: what my symptoms were, why they were happening, and why the numerous previous tracking attempts were not successful.

You wouldn’t think I’d start tracking again, but I did. Although this time, finally, was different.

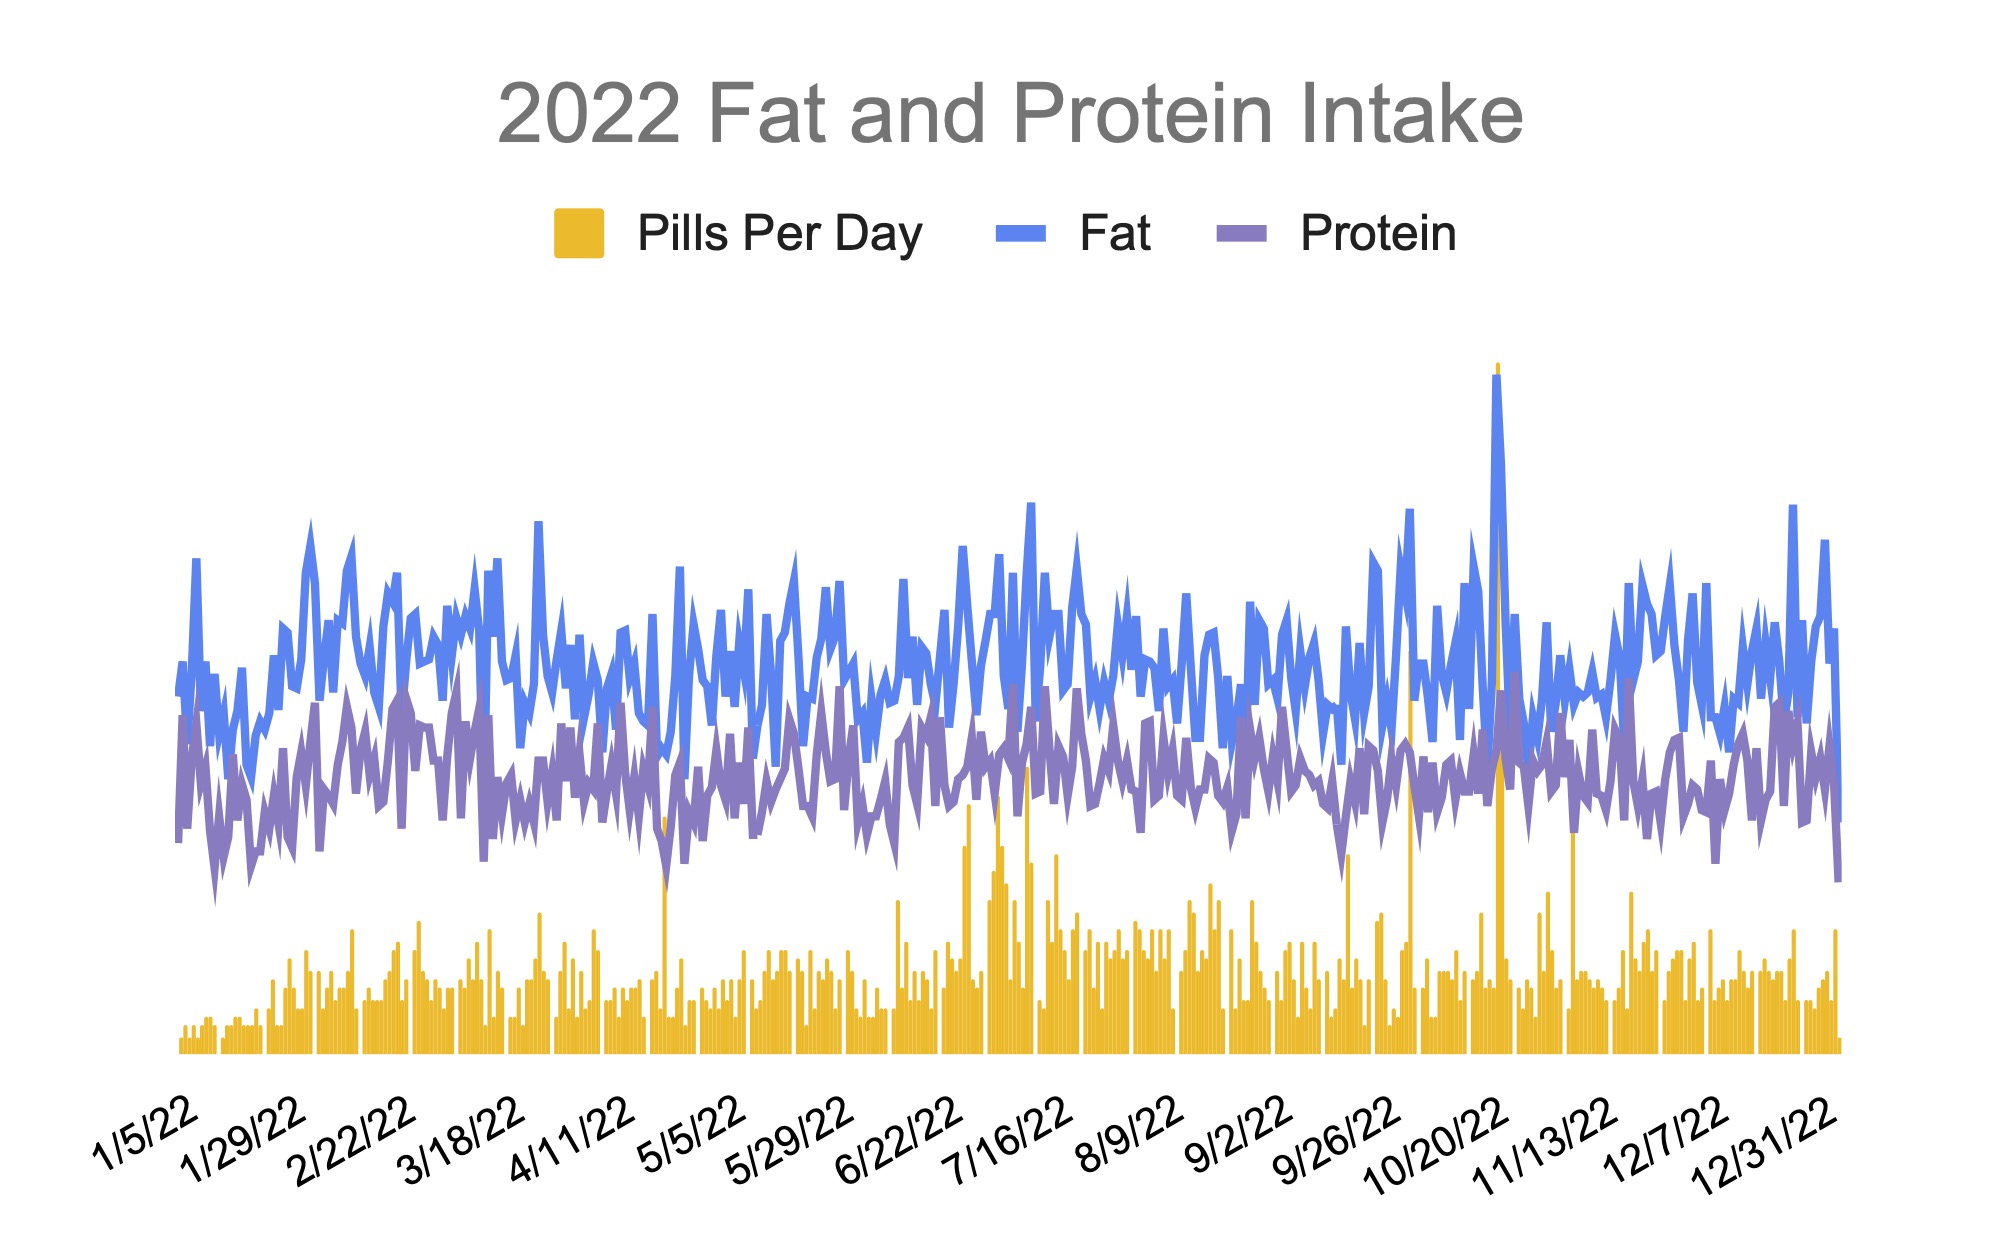
When I realized I had EPI, I learned that my body was no longer producing enough digestive enzymes to help my body digest fat, protein, and carbs. Because I’m a person with type 1 diabetes and have been correlating my insulin doses to my carbohydrate consumption for 20+ years, it seemed logical to me to track the amount of fat and protein in what I was eating, track my enzyme (PERT) dosing, and see if there were any correlations that indicated my doses needed to be more or less.

My spreadsheet involved recording the outcome of the previous day’s symptoms, and I had a section for entering multiple things that I ate throughout the day and the number of enzymes. I wrote a short description of my meal (“butter chicken” or “frozen pizza” or “chicken nuggets and veggies”), the estimate of fat and protein counts for the meal, and the number of enzymes I took for that meal. I had columns on the left that added up the total amount of fat and protein for the day, and the total number of enzymes.

It became very apparent to me – within two days – that the dose of the enzymes relative to the quantity of fat and protein I was eating mattered. I used this information to titrate (adjust) my enzyme dose and better match the enzymes to the amount of fat or protein I was eating. It was successful.

I kept writing down what I was eating, though.

In part, because it became a quick reference library to find the “counts” of a previous meal that I was duplicating, without having to re-do the burdensome math of adding up all the ingredients and counting them out for a typical portion size.

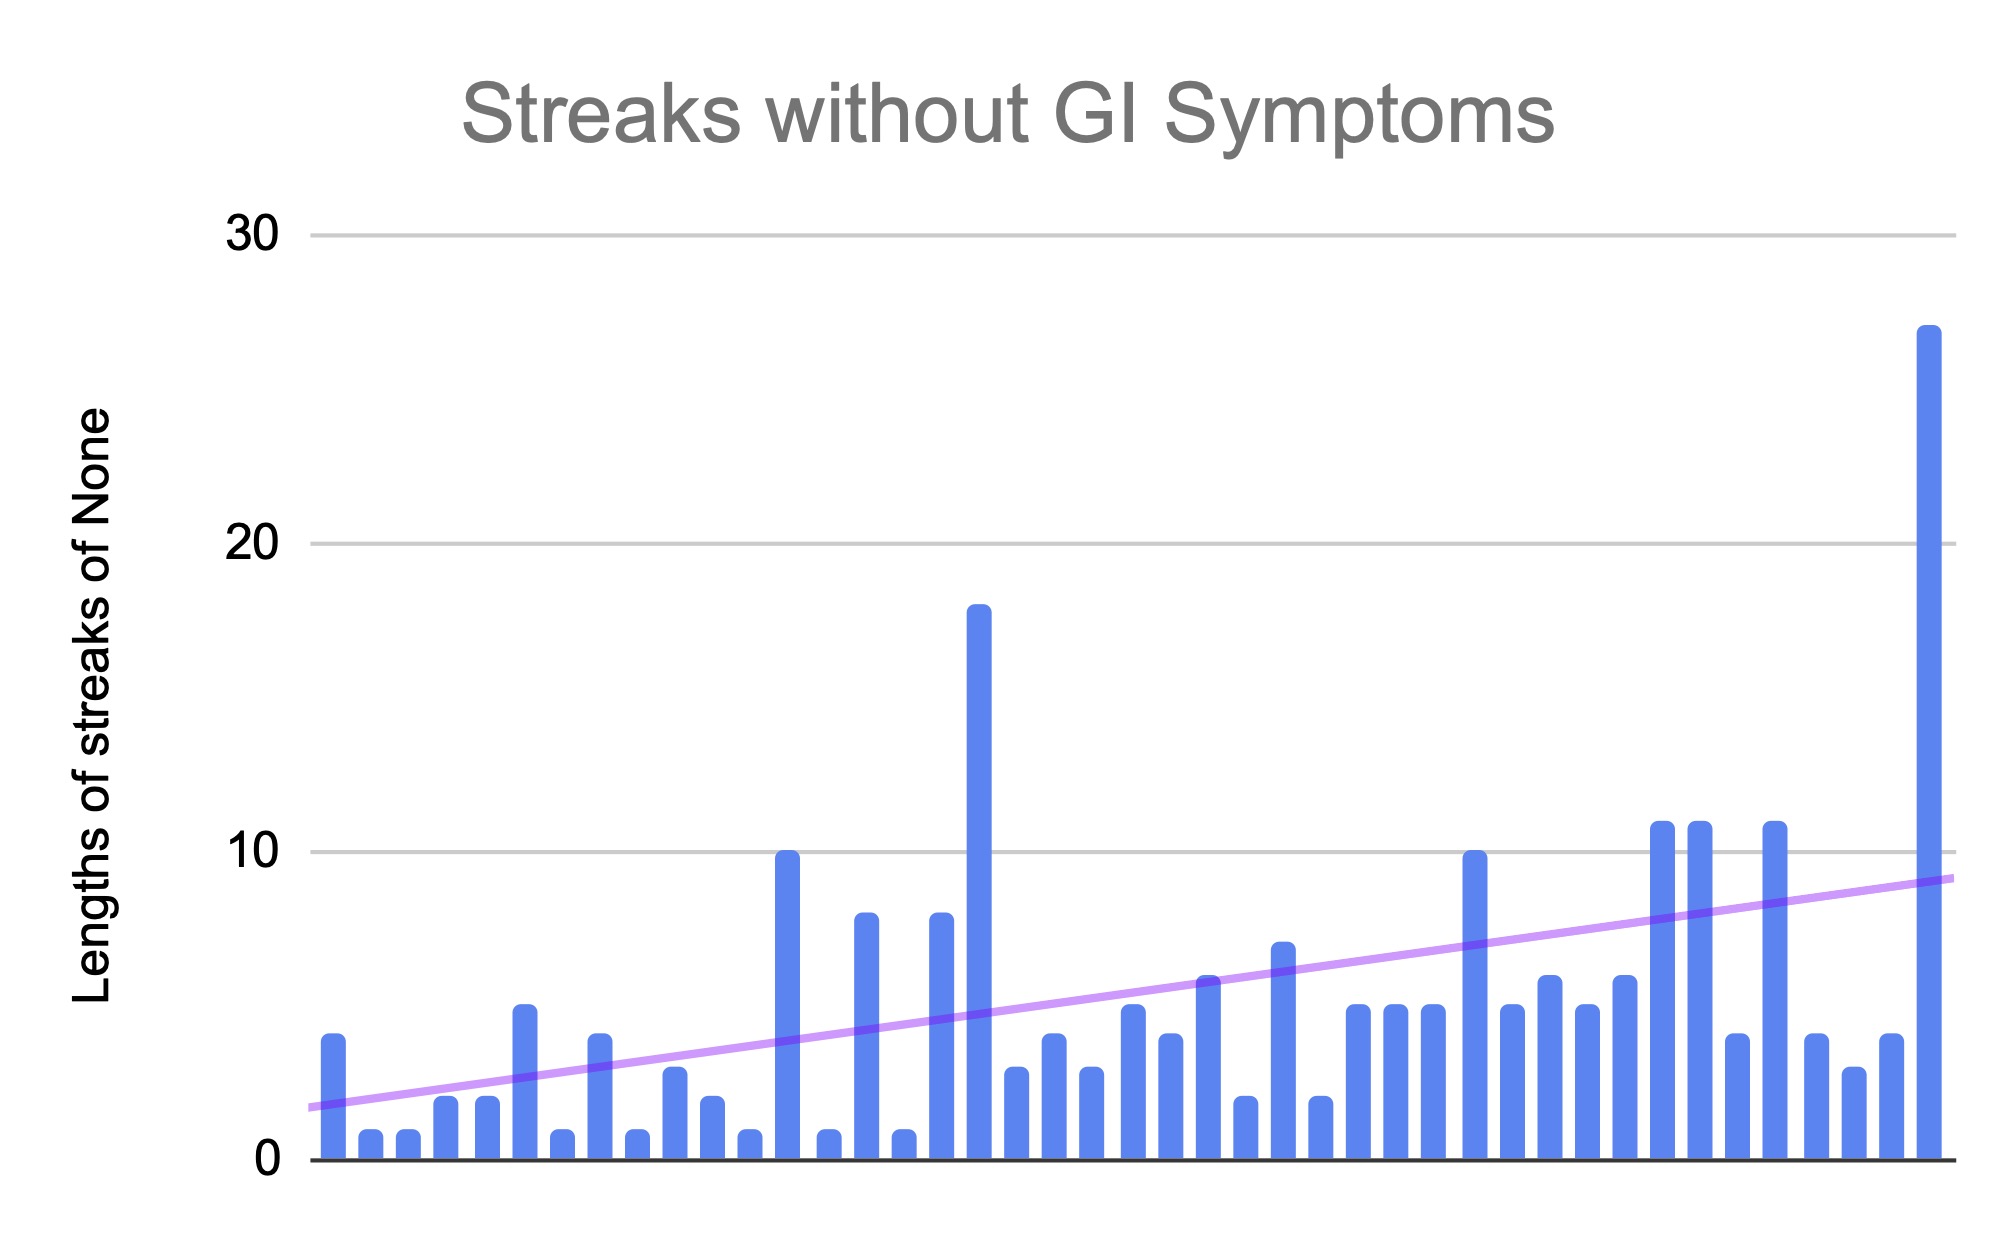
It also helped me see that within the first month, I was definitely improving, but not all the way – in terms of fully reducing and eliminating all of my symptoms. So I continued to use it to titrate my enzyme doses.

Then it helped me carefully work my way through re-adding food items and ingredients that I had been avoiding (like onions, apples, and pears) and proving to my brain that those were the result of enzyme insufficiency, not food intolerances. Once I had a working system for determining how to dose enzymes, it became a lot easier to see when I had slight symptoms from slightly getting my dosing wrong or majorly mis-estimating the fat and protein in what I was eating.

It provided me with a feedback loop that doesn’t really exist in EPI and GI conditions, and it was a daily, informative, real-time feedback loop.

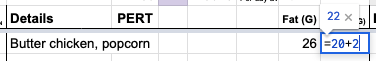
As I reached the end of my first year of dosing with PERT, though, I was still using my spreadsheet. It surprised me, actually. Did I need to be using it? Not all the time. But the biggest reason I kept using it relates to how I often eat. I often look at an ‘entree’ for protein and then ‘build’ the rest of my meal around that, to help make sure I’m getting enough protein to fuel my ultrarunning endeavors. So I pick my entree/main thing I’m eating and put it in my spreadsheet under the fat and protein columns (=17 g of fat, =20 g of protein), for example, then decide what I’m going to eat to go with it. Say I add a bag of cheddar popcorn, so that becomes (=17+9 g of fat) and (=20+2 g of protein), and when I hit enter, those cells now tell me it’s 26 g of fat and 22 g of protein for the meal, which tells my brain (and I also tell the spreadsheet) that I’ll take 1 PERT pill for that. So I use the spreadsheet functionally to “build” what I’m eating and calculate the total grams of protein and fat; which helps me ‘calculate’ how much PERT to take (based on my previous titration efforts I know I can do up to 30g of fat and protein each in one PERT pill of the size of my prescription)

Example in my spreadsheet showing a meal and the in-progress data entry of entering the formula to add up two meal items' worth of fat and protein

Essentially, this has become a real-time calculator to add up the numbers every time I eat. Sure, I could do this in my head, but I’m usually multitasking and deciding what I want to eat and writing it down, doing something else, doing yet something else, then going to make my food and eat it. This helps me remember, between the time I decided – sometimes minutes, sometimes hours in advance of when I start eating and need to actually take the enzymes – what the counts are and what the PERT dosing needs to be.

I have done some neat retrospective analysis, of course – last year I had estimated that I took thousands of PERT pills (more on that here). I was able to do that not because it’s “fun” to track every pill that I swallow, but because I had, as a result of functional self-tracking of what I was eating to determine my PERT dosing for everything I ate, had a record of 99% of the enzyme pills that I took last year.

I do have some things that I’m no longer entering in my spreadsheet, which is why it’s only 99% of what I eat. There are some things like a quick snack where I grab it and the OTC enzymes to match without thought, and swallow the pills and eat the snack and don’t write it down. That maybe happens once a week. Generally, though, if I’m eating multiple things (like for a meal), then it’s incredibly useful in that moment to use my spreadsheet to add up all the counts to get my dosing right. If I don’t do that, my dosing is often off, and even a little bit “off” can cause uncomfortable and annoying symptoms the rest of the day, overnight, and into the next morning.

So, I have quite the incentive to use this spreadsheet to make sure that I get my dosing right. It’s functional: not for the perceived “fun” of writing things down.

It’s the same thing that happens when I run long runs. I need to fuel my runs, and fuel (food) means enzymes. Figuring out how many enzymes to dose as I’m running 6, 9, or 25 hours into a run gets increasingly harder. I found that what works for me is having a pre-built list of the fuel options; and a spreadsheet where I quickly on my phone open it and tap a drop down list to mark what I’m eating, and it pulls in the counts from the library and tells me how many enzymes to take for that fuel (which I’ve already pre-calculated).

It’s useful in real-time for helping me dose the right amount of enzymes for the fuel that I need and am taking every 30 minutes throughout my run. It’s also useful for helping me stay on top of my goal amounts of calories and sodium to make sure I’m fueling enough of the right things (for running in general), which is something that can be hard to do the longer I run. (More about this method and a template for anyone who wants to track similarly here.)

The TL;DR point of this is: I don’t track things for fun. I track things if and when they’re functionally useful, and primarily that is in real-time medical decision making.

These methods may not make sense to you, and don’t have to.

It may not be a method that works for you, or you may not have the situation that I’m in (T1D, Graves, celiac, and EPI – fun!) that necessitates these, or you may not have the goals that I have (ultrarunning). That’s ok!

But don’t say that you “couldn’t” do something. You ‘couldn’t’ track what you consumed when you ran or you ‘couldn’t’ write down what you were eating or you ‘couldn’t’ take that many pills or you ‘couldn’t’ inject insulin or…

You could, if you needed to, and if you decided it was the way that you could and would be able to achieve your goals.

How to Find the Slope of the Trend Line in A Graph With Google Sheets

I’ve been using Google Sheets for tracking and illustrating data for a number of reasons, such as tracking macronutrient and enzyme consumption patterns to help me understand my experiences with exocrine pancreatic insufficiency (EPI). It took me a while to figure out there was an easy way to display slope, though, to quantify what the trendline was.

Once you have a chart with your data, you can go into the “Customize” tab on the right and scroll down. Under “Series”, you can select which series you want, then scroll down and click “Trendline” to make the trendline appear. The customize menu then expands with trendline options.

Example of the default options for displaying a trendline

I had never noticed this before, but “Label” is set to default to “Custom”. This creates a label that defaults to “Trendline __YourSeriesName___”. In the example I’m showing here, I have series A labeled as “Var A”, so if I turn the Trendline on, it defaults to adding the “Custom” label of Trendline Var A.

But you can change this!

Click the dropdown where it says “Custom” and select “Use Equation”.

Example for trendline showing the label to 'use equation' option

Now it will show the label as the y=mx+b equation, so you can find out the slope (m) of your trendline.

In my example this means the slope of the Var A green line is 0.267.

You can modify this name, though, and get the best of both worlds. Click on the equation in the legend, and you will get an editable text box. I like to put the series name (e.g., Var A) in front of the equation so I can more easily see at a glance which series trend line it is explaining:

Example showing the custom text label after 'use equation' is selected to then edit and add back the series name along with the numeric formula

In my particular case, I want a quick glance of the slope, so I modify mine to read (Var A) 0.267 and (Var B) 0.061.

Example of trendline now showing the numeric equation and the series name for easier understanding of the graph

The only downside to this is the custom names will not automatically update. So if your brain can handle seeing the full mx+B equation, it might be better to leave it with the default equation as the trendline label name without modifying it at all, so it hopefully updates if you update the data on your graph. Otherwise, you’ll want to make a mental note to come back and update this manually by re-toggling the variable to equation and then editing it again to show the updated slope.

Two New Children’s Books – And How I Illustrated Them Without Being An Illustrator

I wrote two new books! You can find “Cooper’s Crutches” and “Chloe’s Cookies” on Amazon in paperback and Kindle formats.

Two children's books lay on the carpet: Cooper's Crutches and Chloe's Cookies, both written by Dana M. Lewis

One of these books I wrote years ago, about a month or so after I broke my ankle, inspired by the initial reactions from one of my nephews about me being on crutches. This new book is called Cooper’s Crutches.

I let it sit for several years, though, because I didn’t have illustrations for it. I’ve used a different illustrator or artist for each of my books so far.

A few weeks ago, though, I started thinking about experimenting with AI-driven illustrations for various projects, including wondering whether I could illustrate a children’s book or other projects with it.

The answer is: not yet. It’s hard to create a character who persists throughout image generation for enough scenes that can fit a two-dozen page storyline, although it would probably work for one or two images! (Especially if you managed to AI-illustrate a character that you could then place in various AI-illustrated scenes. The challenge is also having different poses for the same character, to illustrate a story.)

It then occurred to me to search around and I stumbled across a library of free, open source illustrations. Woohoo! Maybe those would work. Actually, I couldn’t even download that one due to a bug in their site, so I started searching (now that I knew to look for it) and found several other sets of illustrations. I even found a site called Blush that had a series of illustrations by various artists, and a web interface (GUI) that allowed you to modify images slightly then download them.

It’s like paper dolls, but digital – you can adjust the coloring of the hair, hair style, accessories, etc to modify the illustrated character.

I gave it a try, building some illustrations and downloading them. I then did some DIY-ing again in PowerPoint to modify them to help illustrate the full story in my children’s book. I printed a proof copy, but the versions I had downloaded for free were too low resolution and were fuzzy. However, the idea as a whole had worked great! I signed up for a free trial of the “Pro” version of Blush which enabled me to download both high-resolution PNG (image) files as well as SVG files.

Having SVG files theoretically would enable me to further modify and customize these, but as a non-illustrator even though I could load them in Figma and modify them, I still struggled to export them as high-enough resolution to work for printing in a book. I gave up and went back to DIY-ing the modifications in PowerPoint. They’re not perfect, but for the use case of my books (for a very small, niche audience), I doubt they care that they’re not perfect.

Here’s a selection of a few of the pages (not in order) in Cooper’s Crutches:

Excerpt images from Cooper's Crutches by Dana M. Lewis

At the same time that I started playing with these illustrations, I wondered whether I had any more ideas for books that I could illustrate at the same time with the same methods. I had had Cooper’s book written and waiting to illustrate; I now had a method to illustrate, but I wasn’t sure what story to illustrate.

But like all of my children’s books, inspiration again struck based on a situation and conversation I had with one of my nieces. She’s newly lactose intolerant and is taking lactase any time she has milk, like with milk and cookies for a bedtime snack. Lactase is an enzyme…and I’ve been taking enzymes of another sort this year, for exocrine pancreatic insufficiency.

Thus the next book, Chloe’s Cookies, was created!

Here’s a selection of a few of the pages (not in order) in the book:

Excerpt images from Chloe's Cookies, by Dana M. Lewis

Both Cooper’s Crutches and Chloe’s Cookies are illustrated with illustrations from a variety of artists who make their work available on Blush, including: Veronica Iezzi; Susana Salas; Pau Barbaro; Ivan Mesaroš; Mariana Gonzalez Vega; Deivid Saenz; and Cezar Berje.

The neat thing about Blush is their license: you can use the illustrations in any way, including commercial products, and you can modify or combine it with other works (like I did, modifying the images and combining illustrations from various artists) however you like.

I think I’ve likely maximized my use of Blush between these two books; unless other collections get uploaded in the future. But if you need a handful of illustrations that you can customize, definitely check it out!

And if you have ideas for other cool illustration libraries that I could use for future books, please let me know! (Or if you’re an artist who would like to contribute to one of my future books. :) )

TLDR:

I have two new children’s books, and you can find “Cooper’s Crutches” and “Chloe’s Cookies” on Amazon in paperback and Kindle formats.

Illustrating Children's Books without being an illustrator, plus introducting two new children's books by Dana M. Lewis

One Year of Pancreatic Enzyme Replacement Therapy for Exocrine Pancreatic Insufficiency (EPI or PEI)

I’ve had exocrine pancreatic insufficiency (EPI or PEI) for a full year now and have been taking pancreatic enzyme replacement therapy (PERT) ever since diagnosis.

I’ve written about what EPI is, what it’s like to go on PERT, and a variety of other posts (such as how I ultimately taught myself to titrate and adjust my dosing of PERT based on what I am eating) in the last year – you can see all my EPI posts listed at DIYPS.org/EPI. I also wrote recently about estimating the costs of PERT for a year, in which I had tallied up the number of PERT pills I had taken so far in the year. Since I’ve now hit the one year mark, I wanted to revisit that math.

In 365 days of pancreatic enzyme replacement therapy, I have consumed (at least) 3,277 pills.

That’s an average of 8.98 pills per day!

As I previously wrote, the number of pills is in part because I’m trying to lower the total costs (to everyone involved in paying for it) of my PERT by taking a mix of prescription PERT and OTC enzymes to try to balance effective dosing, cost, and the number of pills I swallow. I take one pill with my standard breakfast, so the remaining ~8 average pills are usually split between lunch, dinner, and/or a snack if I have one. (This is also influenced by my ultrarunning where I typically take ~2 pills every 30 minutes with my snacks/fuel for running, so long training days of 4 hours would involve 8 or more pills just for running fuel; obviously longer runs would involve even more, which drives the pills/day average higher.) If I wanted to reduce the total number of pills, I could by driving up the cost by using bigger, prescription PERT pills in lieu of some of the OTC options. However, most of the time, 3-4 pills per meal mixed between prescription and OTC is doable for me. I typically would choose to round up more PERT and reduce OTC pill count when I’m less certain about the macronutrient content of the meal or I want more confidence in better outcomes.

Speaking of better outcomes – is PERT effective?

For me, yes!

Overall, I feel so much better. Most of the time, I hardly ever have ANY symptoms (such as gas, bloating, or feeling icky) let alone my more extreme symptoms of “disrupting” my GI system. In the year of taking PERT, 78% of the time I had no disruption or any noticeable symptoms.

The average length of time between days with noticeable symptoms was 5.37 days.

And, if you look at the second half of the year, this increased quite a bit: 88% of the time I had no noticeable symptoms and the streak length of days between symptom days increased to 6.81 average days! The max streak is now 28 days (and counting)!

Showing the increasing length of streaks of consecutive days where I did not have any GI symptoms. The trend line shows a steady increase in the length of these streaks throughout the year.

That’s approaching a full month without any GI symptoms (woohoo) of any kind, and means less than 1 or 2 instances of symptoms per month for me in the last several months. That’s probably better than average for most people, even people without known GI conditions, and getting a lot closer back to my personal level of “normal”.

And obviously, this is continuing to increase over time as I improve my PERT dosing strategy.

This is pretty meaningful to think about.

PERT made a difference overall straight away, but I was also starting with very small portions of food and a very restricted diet. (This is because before I realized I had EPI I had done all kinds of behavioral gymnastics to try to eliminate foods like onion, garlic, and other foods that seemed to cause issues). So first I figured out PERT successfully for what I was eating; then carefully expanded my portion sizes back to typical quantities of food; then slowly expanded my diet to cover all the foods I used to eat before I started having all my GI problems.

It very much felt like I had three phases this year:

  • Phase 1: Use PERT to cover small quantities of small varieties of food. Figure out what foods I could eat that could “fit” into one PERT pill.
  • Phase 2: Start to figure out what quantities of food I wanted to eat, and get the PERT to match the food.
  • Phase 3: Finish expanding out my food choices to cover everything I was eating before and tackling all my “firsts” with PERT.

You can see this evolution in my diet, too, when you look at the relative changes in the amount of fat and protein I have eaten over the course of the year. (The one big obvious outlier on the graph in October is my 82 mile ultramarathon where I ate every 30 minutes for 25 hours!) There’s been a slight increase in my fat consumption over the course of the year, and protein consumption has stayed relatively flat as I’ve been making a very conscious effort to eat enough protein to fuel my ultrarunning endeavors throughout the year.

You can then see the relationship with increased number of pills (albeit pills with different amounts of lipase) over the course of the year, relative to the fat and protein consumed.

Displaying lines showing the relative amounts of fat and protein consumed throughout the year, plus the number of enzyme pills per day throughout 2022.

(Note that the pills per day is using a hidden right axis, whereas the fat and protein share the same left axis numbers, also not shown)

For anyone who is new (just diagnosed or recently diagnosed within a few weeks or months) to EPI, here’s what I would hope you take away:

  1. PERT works, but it needs to match what you are eating. Come up with a strategy (here’s mine – you can use it!) to adjust your dosing to match what you are eating. What you eat changes, and so should your PERT dosing.
  2. Things will improve over time, and you will get more effective at matching your dosing to what you are eating. You should be able to have more and more “streaks” of days without symptoms, or with reduced symptoms. However, this may take a few months, because you’ll likely also be – at the same time – re-expanding your variety of foods that you’re eating. The combination of eating more and different foods AND tweaking your dosing can make it take a little bit longer to figure it all out.
  3. If you’re not seeing success, talk with your doctor. There are different sizes of PERT pills – if you’re struggling to take X number of pills, you may be able to take fewer pills of a bigger size. There are different brands of PERT – so if one isn’t working for you (after you match your dosing to how much fat and protein is in each meal), you can switch and try another brand. There are also OTC options, which you can use to “top off” your prescription PERT or substitute, but you need to have an effective strategy for adjusting your dose that you can translate to your OTCs to be sure that they’re working.
One year of pancreatic enzyme replacement therapy for EPI by Dana M. Lewis

(PS – you can find my previous posts about EPI at DIYPS.org/EPI – and make sure you check out PERT Pilot, the first iOS app for Exocrine Pancreatic Insufficiency!)


You can also contribute to a research study and help us learn more about EPI/PEI – take this anonymous survey to share your experiences with EPI-related symptoms!

Looking Back Through 2022 (What You May Have Missed)

I ended up writing a post last year recapping 2021, in part because I felt like I did hardly anything – which wasn’t true. In part, that was based on my body having a number of things going on that I didn’t know at the time. I figured those out in 2022 which made 2022 hard and also provided me with a sense of accomplishment as I tackled some of these new challenges.

For 2022, I have a very different feeling looking back on the entire year, which makes me so happy because it was night and day (different) compared to this time last year.

One major example? Exocrine Pancreatic Insufficiency.

I started taking enzymes (pancreatic enzyme replacement therapy, known as PERT) in early January. And they clearly worked, hooray!

I quickly realized that like insulin, PERT dosing needed to be based on the contents of my meals. I figured out how to effectively titrate for each meal and within a month or two was reliably dosing effectively with everything I was eating and drinking. And, I was writing and sharing my knowledge with others – you can see many of the posts I wrote collected at DIYPS.org/EPI.

I also designed and built an open source web calculator to help others figure out their ratios of lipase and fat and protease and protein to help them improve their dosing.

I even published a peer-reviewed journal article about EPI – submitted within 4 months of confirming that I had it! You can read that paper here with an analysis of glucose data from both before and after starting PERT. It’s a really neat example that I hope will pave the way for answering many questions we all have about how particular medications possibly affect glucose levels (instead of simply being warned that they “may cause hypoglycemia or hyperglycemia” which is vague and unhelpful.)

I also had my eyes opened to having another chronic disease that has very, very expensive medication with no generic medication option available (and OTCs may or may not work well). Here’s some of the math I did on the cost of living with EPI and diabetes (and celiac and Graves) for a year, in case you missed it.

Another other challenge+success was running (again), but with a 6 week forced break (ha) because I massively broke a toe in July 2022.

That was physically painful and frustrating for delaying my ultramarathon training.

I had been successfully figuring out how to run and fuel with enzymes for EPI; I even built a DIY macronutrient tracker and shared a template so others can use it. I ran a 50k with a river crossing in early June and was on track to target my 100 mile run in early fall.

However with the broken toe, I took the time off needed and carefully built back up, put a lot of planning into it, and made my attempt in late October instead.

I succeeded in running ~82 miles in ~25 hours, all in one go!

I am immensely proud of that run for so many reasons, some of which are general pride at the accomplishment and others are specific, including:

  • Doing something I didn’t think I could do which is running all day and all night without stopping
  • Doing this as a solo or “DIY” self-organized ultra
  • Eating every 30 minutes like clockwork, consuming enzymes (more than 92 pills!), which means 50 snacks consumed. No GI issues, either, which is remarkable even for an ultrarunner without EPI!
  • Generally figuring out all the plans and logistics needed to be able to handle such a run, especially when dealing with type 1 diabetes, celiac, EPI, and Graves
  • Not causing any injuries, and in fact recovering remarkably fast which shows how effective my training and ‘race’ strategy were.

On top of this all, I achieved my biggest-ever running year, with more than 1,333 miles run this year. This is 300+ more than my previous best from last year which was the first time I crossed 1,000 miles in a year.

Professionally, I did quite a lot of miscellaneous writing, research, and other activities.

I spent a lot of time doing research. I also peer reviewed more than 24 papers for academic journals. I was asked to join an editorial board for a journal. I served on 2 grant review committees/programs.

I also wrote a lot.

*by ton, I mean way more than the past couple of years combined. Some of that has been due to getting some energy back once I’ve fixed missing enzyme and mis-adjusted hormone levels in my body! I’m up to 40+ blog posts this year.

And personally, the punches felt like they kept coming, because this year we also found out that I have Graves’ disease, taking my chronic disease count up to 4. Argh. (T1D, celiac, EPI, and now Graves’, for those curious about my list.)

My experience with Graves’ has included symptoms of subclinical hyperthyroidism (although my T3 and T4 are in range), and I have chosen to try thyroid medication in order to manage the really bothersome Graves’-related eye symptoms. That’s been an ongoing process and the symptoms of this have been up and down a number of times as I went on medication, reduced medication levels, etc.

What I’ve learned from my experience with both EPI and Graves’ in the same year is that there are some huge gaps in medical knowledge around how these things actually work and how to use real-world data (whether patient-recorded data or wearable-tracked data) to help with diagnosis, treatment (including medication titration), etc. So the upside to this is I have quite a few new projects and articles coming to fruition to help tackle some of the gaps that I fell into or spotted this year.

And that’s why I’m feeling optimistic, and like I accomplished quite a bit more in 2022 than in 2021. Some of it is the satisfaction of knowing the core two reasons why the previous year felt so physically bad; hopefully no more unsolved mysteries or additional chronic diseases will pop up in the next few years. Yet some of it is also the satisfaction of solving problems and creating solutions that I’m uniquely poised, due to my past experiences and skillsets, to solve. That feels good, and it feels good as always to get to channel my experiences and expertise to try to create solutions with words or code or research to help other people.