 Here are the top questions I see about exocrine pancreatic insufficiency (EPI / PEI), especially when someone is newly diagnosed.
Section 1 of 7: Symptoms
What are the symptoms of exocrine pancreatic insufficiency? Are my symptoms possibly EPI? I don’t have this symptom that someone else does, does that mean I don’t have EPI?
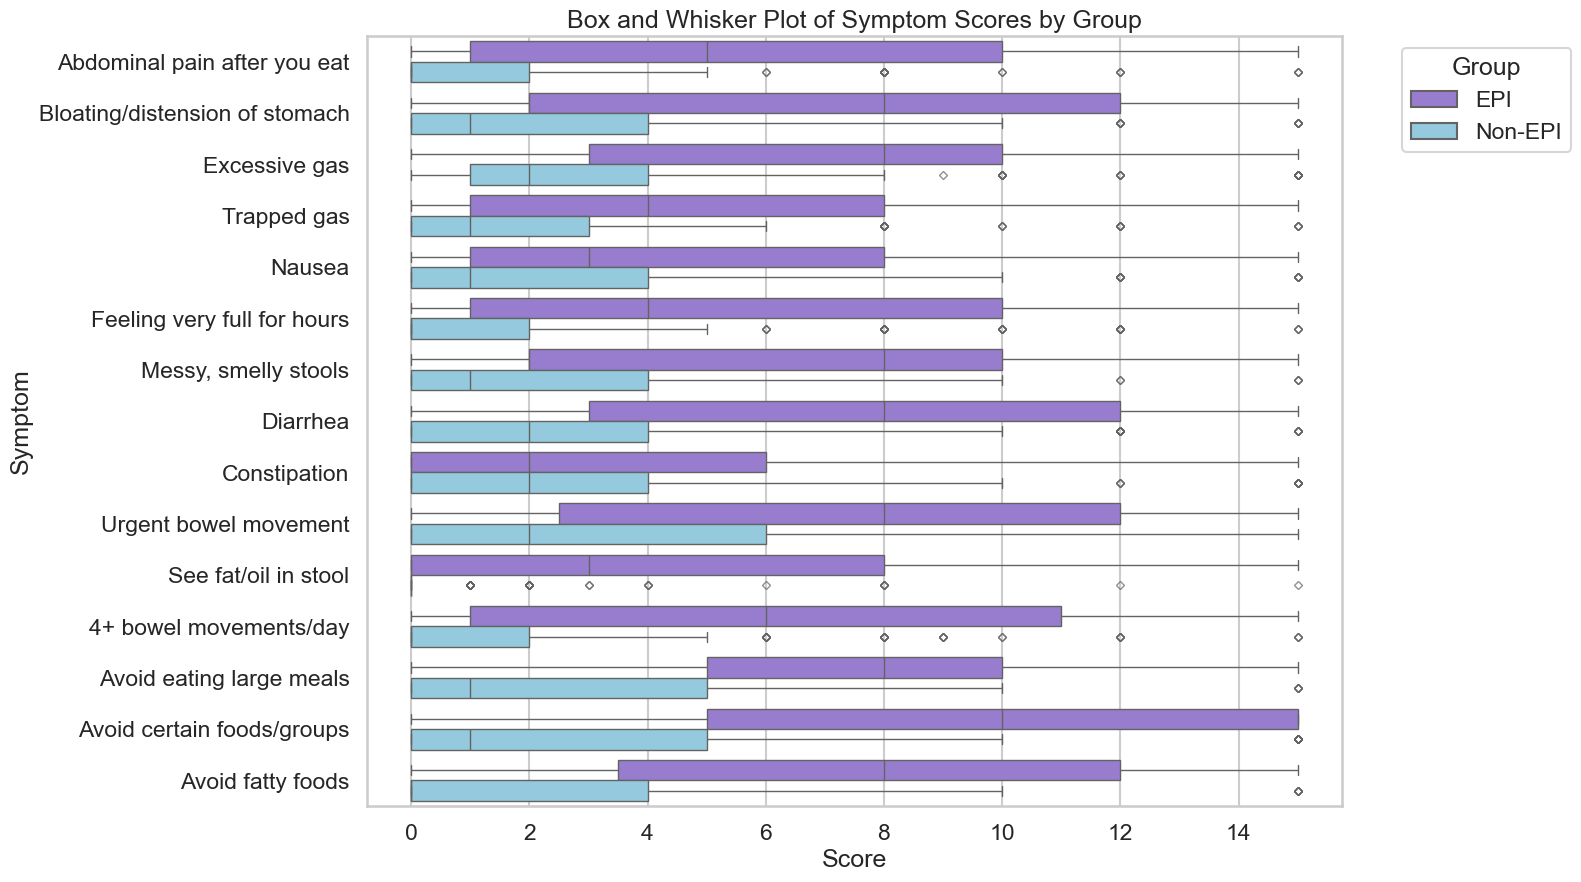
EPI can produce greasy stools, diarrhea or constipation, bloating, gas, weight change, or urgent bowel movements: any combination is possible.
EPI can have a variety of symptoms. The symptoms of EPI vary person to person in terms of frequency and severity and what symptoms you have.
Here are some common examples of symptom patterns, but if you don’t have the same exact cluster of symptoms, that doesn’t mean you don’t have EPI! These are just some of the examples.
- I have diarrhea several times a day and I’m losing weight.
- I see globs of oil in my stool (poop) or when I wipe with toilet paper. I have a lot of gas and I’m really bloated most of the time.
- My stool (poop) is really hard to clean out of the toilet bowl, it’s really sticky and messy and smells bad.
Those aren’t the only symptoms (diarrhea, weight loss, fat/steatorrhea, messy stools, excessive gas, bloating) of EPI, though.
You could also experience constipation as an EPI symptom, as well as pain in your abdomen after you eat, trapped gas, nausea, feeling excessively full for hours after you eat (e.g. not wanting to eat lunch because breakfast keeps you so full), urgently needing to rush to the toilet for a bowel movement, or 4+ bowel movements a day. You may find yourself excluding certain foods or food groups, trying to eat smaller meals, or avoiding fatty foods.
How can I check if my symptoms match EPI?
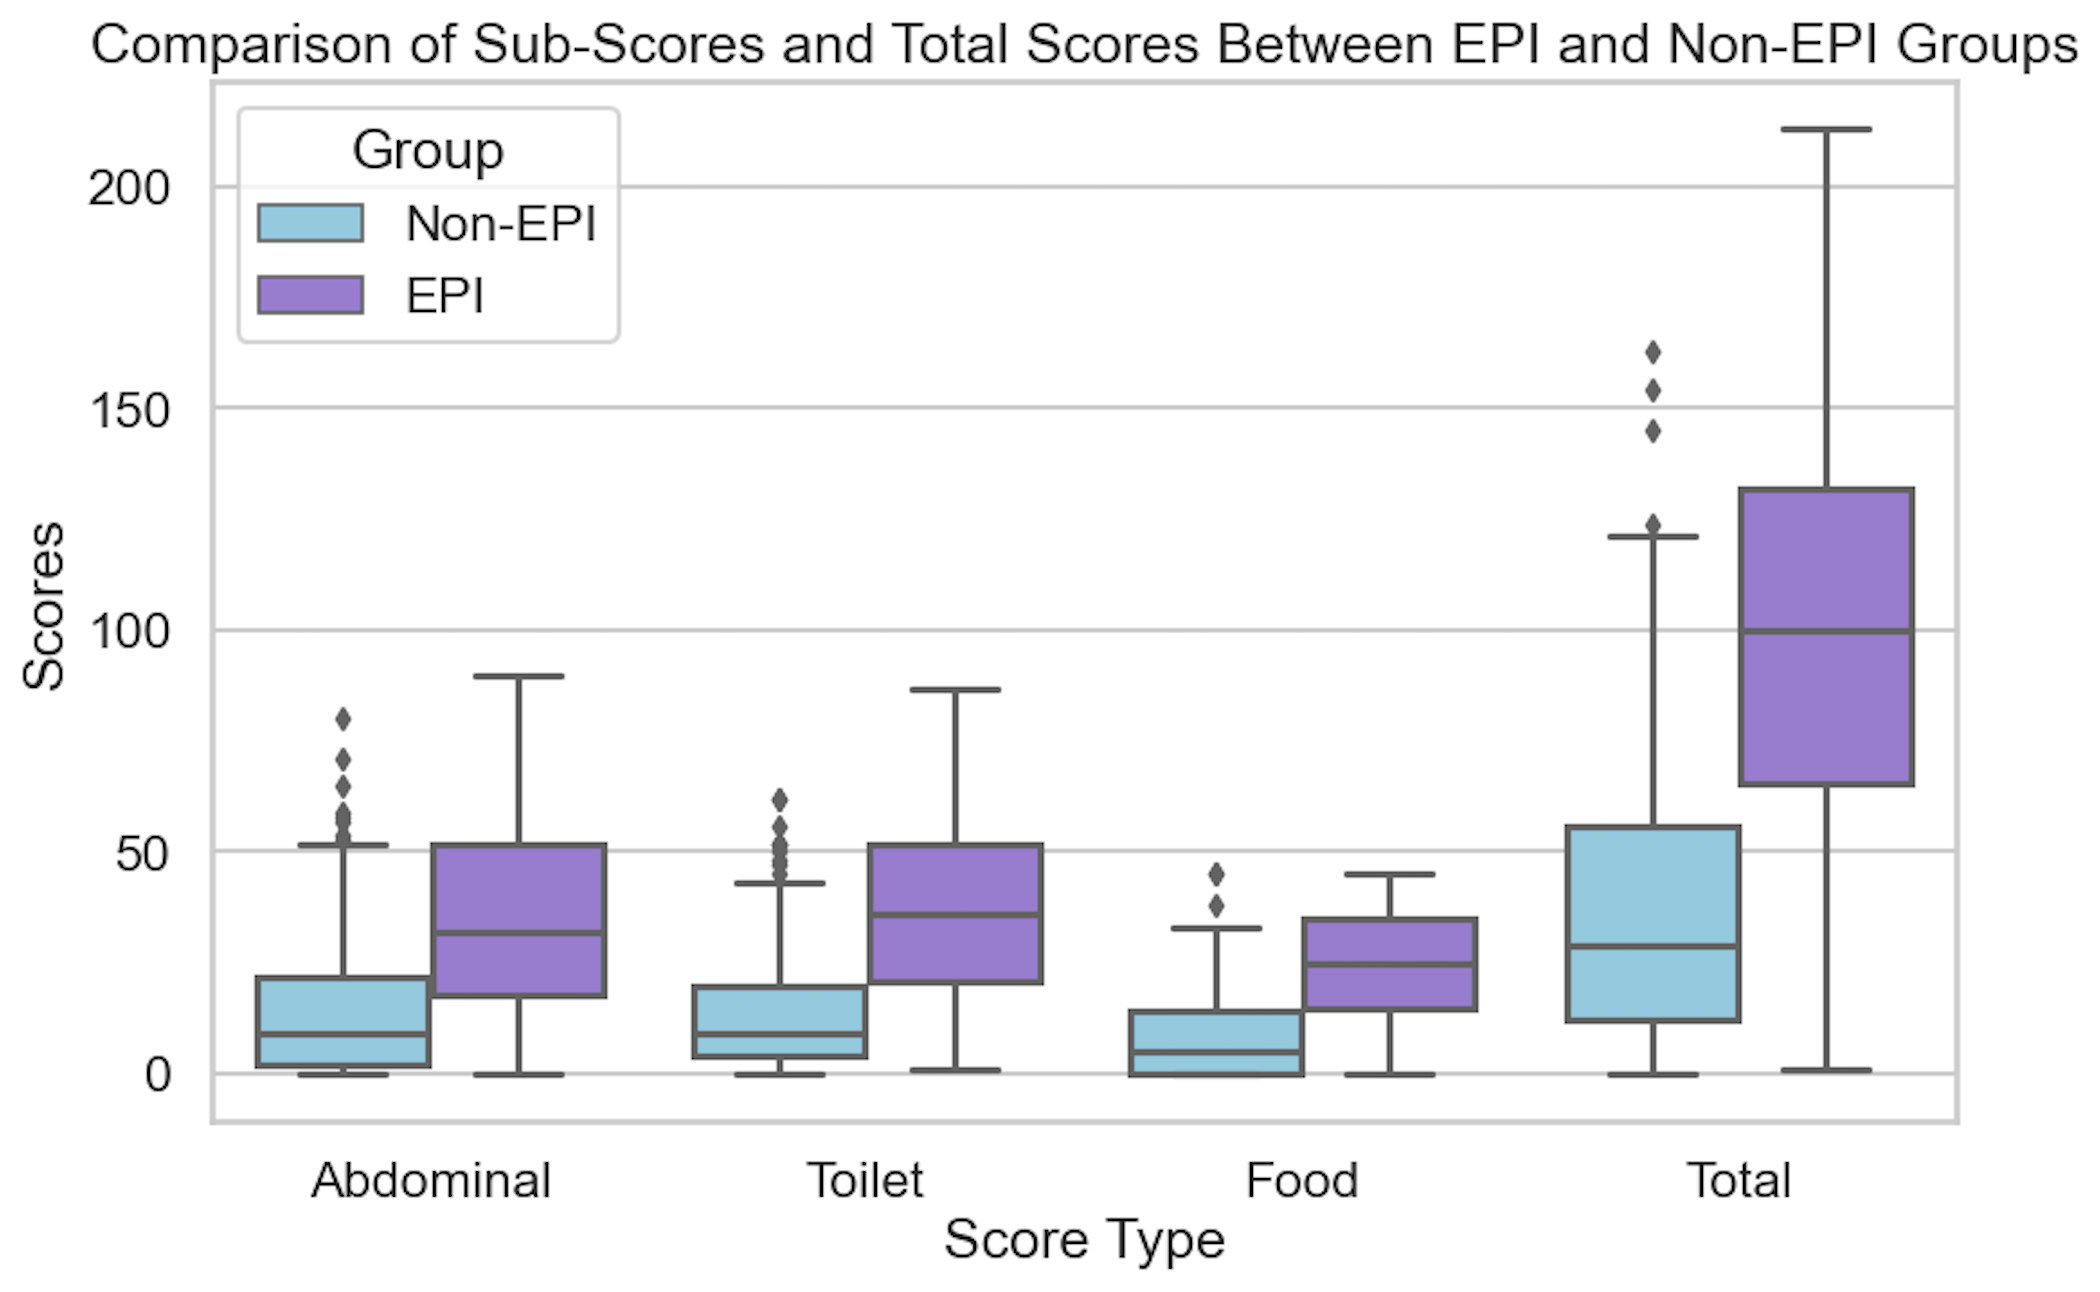
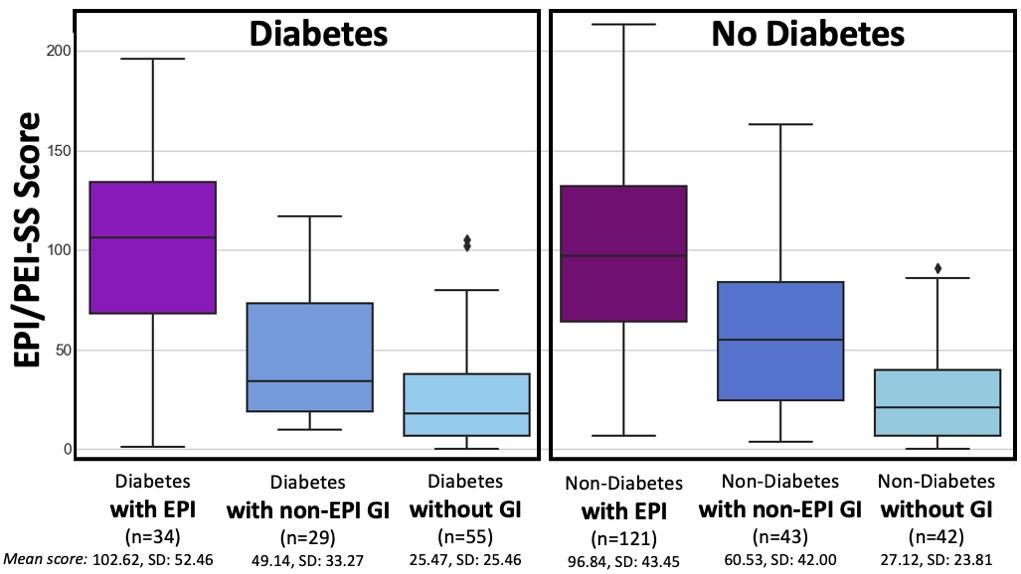
The free 15-item EPI/PEI-SS survey; scores above 60 suggest you may need fecal elastase testing.
One of the ways you can tell is using the free online EPI symptom tool, the EPI/PEI-SS, to look at which of the 15 common symptoms you have and to indicate how frequently they happen and how severe/annoying they are. It will generate a score out of 225, and you can use that score to discuss with your doctor whether you should be screened with fecal elastase or other screening methods. This survey hasn’t been validated yet to replace elastase screening, but in a real world study of people with and without EPI, people with EPI had much higher scores than people without EPI. If you have a score above 60 or so, the likelihood of your symptoms matching EPI goes up. For example, someone with a score of 178 is much more likely to have EPI than with a score of 61, but someone with a score of 61 might still have EPI. On the other hand, a score below 60 makes it less likely that you might have EPI (although not impossible), because some of these symptoms may occur everyday in people without any condition (sometimes people get diarrhea! Or get bloated!) but that’s usually with a lot less frequency and severity (the average non-EPI score is around 30, including other non-EPI GI-related conditions).
Can I still have EPI if I don’t have diarrhea or weight loss?
Yes—many people with confirmed EPI are overweight or symptom-light, so absence of diarrhea or weight loss never rules it out.
Many people have EPI and don’t have diarrhea, or steatorrhea, or any vitamin deficiencies. You can be overweight and have EPI, you can be not losing weight and have EPI. A lack of these specific symptoms do not necessarily rule out EPI (unless they are saying this in conjunction with fecal elastase testing or other test results, see below).
If your clinician dismisses EPI based solely on the absence of steatorrhea, diarrhea, or weight loss, share your EPI/PEI-SS symptom score and request objective testing such as a fecal elastase test.
Does lack of abdominal pain mean I don’t have EPI?
Pain is not a core EPI symptom; absence of pain neither confirms nor excludes the diagnosis.
When present, it often comes from trapped gas or an overlapping condition such as chronic pancreatitis. So lack of pain doesn’t exclude EPI, and pain doesn’t confirm EPI.
TL;DR: any combination of symptoms can occur in people with EPI. Use the EPI/PEI-SS to help you characterize your symptoms and discuss them with your doctor.
Section 2 of 7: Testing & Diagnosis
How is EPI diagnosed?
The simplest test is fecal elastase; a stool value ≤ 200 µg/g strongly indicates EPI.
The most common and non-invasive test for EPI is fecal elastase test. It involves you going to the lab and getting a collection kit, taking it home, using it to get a stool (poop) sample and put it in a tube, refrigerating it, and taking it back to the lab.
Pay attention to the instructions about when you need to get it back to the lab (within a certain number of days, depending on the lab). It’s better to get a less watery sample so if you’re having a short term bout of less formed stool due to eating certain foods, it’s better to wait and try to get a more formed sample on another day, if possible.
How do I get a fecal elastase test?
Your primary-care or GI doctor can order it; pay-per-order labs are an option when insurance won’t.
Your doctor can order a fecal elastase test for you. This can be your primary care provider or GP, an endocrinologist, a gastroenterologist, etc.
If you don’t have a doctor or your doctor refuses and you still want to get a fecal elastase test, it looks like some of the order-your-own lab services do have fecal elastase testing as an option, so you can get it ordered and run at labs like Labcorp or Quest. (Here’s an example, I haven’t used them and have no affiliation with them.) Insurance doesn’t cover tests ordered this way, so it would be an out of pocket cost for you.
Do I have to stop enzymes for a fecal elastase test?
No, continue PERT; it does not affect elastase results.
In general, a value ≤200 µg/g on a fecal elastase test indicates EPI. Some doctors and researchers want to only use ≤100 µg/g, but you should consider it a degree of confidence rather than an absolute yes/no for defining EPI. If you have a test result below 200, you warrant trying pancreatic enzyme replacement therapy (PERT). Even though you’ll find <100 labeled “severe” and 100-200 labeled as “mild/moderate”, elastase values don’t necessarily correlate with severity of symptoms, amount of enzymes needed, or just about anything else.
Note that you do not have to stop taking enzymes for a fecal elastase test. (But you would stop taking enzymes for a fecal fat test. Different test!)
What if my elastase result is over 200 µg/g?
Borderline scores (201–500) can still benefit from a therapeutic enzyme trial, especially if symptoms persist.
Technically, elastase >200 doesn’t indicate EPI, but there are two caveats here.
One is that these tests aren’t perfectly 100% precise. Think about a 199 score: if you’re ready to believe that this indicates EPI, then you should also be willing to believe that a 201 score indicates EPI. These tests have some limitations in terms of accuracy, AND the sample matters – watery samples (less firm stool, more mushy) may result in inaccurate results.
The second caveat is that some people even with scores between 201-500 ug/g show benefit from PERT.
(You can read a lot more in this post about fecal elastase accuracy.)
I got two different elastase results—which is right?
The elastase number can move around from natural fluctuations of how much elastase your pancreas is producing.
Here are some examples where the changes may or may not matter:
- 36 -> 145. (Even though it goes from “severe”, aka <100, to above 100, that change isn’t meaningful)
- 135 -> 78. (Ditto, even though it changes categories, it doesn’t change the result).
- 185 -> 387. (May be meaningful – if you’ve been on enzymes, it may be worth considering a trial without enzymes and see if your symptoms continue to be resolved. The slightly low elastase result could have been from a watery sample and/or a temporary reduction in elastase that resolved on its own.)
- 185 -> 745 (Meaningful change. The first sample may have been watery and/or a result of a temporary reduction in elastase that was resolved. A good reason to try stopping enzymes and see if your symptoms continue to be gone.)
Remember that watery or diarrheal samples dilute elastase and can produce a falsely low reading: retest when stools are well-formed, and know that levels can fluctuate naturally or with acute infections or other conditions (like SIBO). Some people who treat the SIBO then see elastase return to and stay normal; other people happen to have both SIBO and EPI, and treating the SIBO does not change the fact that they have EPI.
Section 3 of 7: Enzyme Dosing
How much pancreatic enzyme replacement therapy should I be taking for EPI?
Adults generally begin at 40 000–50 000 lipase units per meal and half that for snacks.
Doctors are often unaware of the guidelines and up to date clinical practice recommendations, which are that the starting dose should be 40-50,000 units of lipase; it is common to need more than this; and that the dose of pancreatic enzyme replacement therapy (PERT) needs adjusting to match your food intake.
If your doctor prescribes 40,000 units per meal and 20,000 units per snack, that’s an acceptable starting point that aligns with guidelines.
If your doctor prescribes 10,000 units per meal and 5,000 (or none) per snack, that’s well below guidelines. You could share this systematic review article with them and ask for an increased dose to match the guidelines (but also be aware you may need even more in future, although you’d likely see an improvement in symptoms when bumping from 10,000 to 40,000 or 50,000!). This blog post might also help you think through the conversation with your doctor about increasing your dose.
How much Creon should I take? How much Zenpep should I take?
Ignore everyone who answers this question definitively, unless it’s in the context of starting dose guidelines, like I did above.
Your body and your food intake are different from everyone else’s! Just like a person with type 1 diabetes takes a different amount of insulin than their friend who also has type 1 diabetes, your needs will be different than someone else, even if they also have EPI.
Instead, follow this simple guide:
- Start with the starting dose recommended by guidelines (e.g. 40,000 or 50,000 units, or more depending on condition.)
- If you’re still having symptoms every time you eat, you may need more enzymes. Try increasing by one pill per meal. Also spend a few days recording what you eat and how many grams of fat and protein are in the meal (you can use something like PERT Pilot). This may help you see which meals are causing symptoms and whether it’s the quantity of fat/protein that may be the issue. For example, if sometimes your meals are 10g of fat and do ok on 50,000 units of lipase, but sometimes your 30g of fat meals have symptoms with 50,000 units of lipase, this can help you adjust for larger meals.
- Look at the size of pill you’ve been prescribed. If your doctor prescribed 10,000 unit capsules, know that depending on the brand, there may be capsules with more lipase (eg 24,000 or 36,000 or 40,000) that you can get, so that you can get more lipase per meal with a small number of pills to swallow. If you need around 75,000 units of lipase for most meals, you’d want to increase to 2 pills per meal of 36,000 or 3 pills of 25,000. (Exact numbers vary by brand).
How quickly can I tell if my enzymes are working?
Most people notice symptom improvement within a few meals or days when the dose is adequate.
More details in this post, but in general you should be able to tell the difference for most meals within a few hours or the next day (eg bowel movement improvements). It may be harder to tell if you don’t have obvious symptoms, but for people who have bloating, gas, diarrhea, messy stools, etc., you should be able to tell within days. It would be harder if you eat really different size meals, e.g. sometimes 10g of fat and sometimes 45g of fat per meal, but take the same dose of enzymes, and don’t record the meals. So consider using some tracking tools like a spreadsheet, journal, or app like PERT Pilot to help you keep track of things and more quickly see changes in symptoms so you can adjust your dose more quickly.
When do I take enzymes? When, relative to meal timing, and when, in terms of what foods need enzymes?
Enzymes are to help your food get digested. If you’re not eating or drinking something with fat/protein/carbs, you don’t need enzymes.
Things that don’t need enzymes:
- Water
- Beverages without fat, protein, or many calories (for example a 5 calorie drink doesn’t need enzymes)
- Medicines that are taken on an empty stomach
Things that do need enzymes:
- Milky drinks (because milk has fat and protein, so it needs help digesting)
- Protein shakes
- Food with fat and protein
Things that may or may not need enzymes, depending on your body:
- Carb-only food or drinks. For example, a fruit smoothie that’s just fruit and water and ice mixed up, may or may not need enzymes. Or a piece of fruit, or a piece of candy (that doesn’t have fat or protein). It may also be a quantity thing: with a few bites or < X grams of carbs you may do ok without enzymes, whereas larger amounts may need enzymes to help you digest the carbs.
- Small amounts of fat and protein. Some people may be able to consume a few grams of fat, without needing enzymes. Ditto for protein. This amount is going to vary person to person, but if you’re for example taking a taste test of food you are cooking to season the food, 0.3 g of fat hitting your tongue likely doesn’t need enzymes. However, you might be sensitive enough that 3g of fat (eg several bites) may need some enzymes. When you’re not eating much, you could also choose to take a cheaper over-the-counter (non-prescription) enzyme pill with a lower dose of enzymes, and save your prescription PERT for meals.
When should I take my enzymes during a meal?
Swallow at least one capsule with the first bite and the rest mid-meal if eating longer than 15 minutes.
- At least one pill at the start of when you’re eating and drinking. (This can be swallowing your pill and starting eating, or taking your first bite and then swallowing the pill. The timing is not that precise, so whatever works for you.)
- If you’re taking multiple pills and/or if you are eating/drinking spread out beyond 15 minutes, you may want to split your dose and take one at the start and the others in the middle or toward the end.
(The point is to get your enzymes into your digestive tract close to when your food needs digesting. It’s not super precise to the matter of seconds or single digits of minutes. If you have three pills and you take one up front and two with your last bites, it’s pretty close to taking one at the start, one at the middle of your plate, and one at the end, assuming your meal isn’t spread out over hours. You may be able to notice a small difference, but getting the right amount to cover the fat/protein is likely to have a bigger impact than timing within a handful of minutes. Don’t stress if you eat a few bites and only then remember to take your first pill(s).)
What if I’m eating multiple courses, like at a restaurant?
You may need more pills than you would for the same amount of food when it’s spread out over time. Imagine a meal with an appetizer, entree, and a few bites of dessert that in terms of meal composition could be covered by 3 of your pills. However, the appetizer comes out and then it’s another 30 minutes to your entree, and the dessert is 30 minutes later. You may want to take one with the appetizer, two with the entree, and then another pill with the dessert bites, even though the total amount of food “should” be ok with 3 pills, the timing may necessitate 4 pills in this meal example.
(Some strategies to get around this include asking for dessert to come out at the same time as your entrees, or appetizers + entree at the same time, etc. or just accepting that the ‘cost’ of a spread out meal is additional pills compared to what you would do at home, eating all your food within ~15 minutes or so).
Section 4 of 7: Diet & Food Choices
Do I have to adjust my diet or eat low fat for EPI?
Short answer: no.
No. You adjust your enzymes to match your diet, rather than the other way around. A low fat diet is no longer recommended for people with EPI as a general rule (although some people with EPI and additional conditions may have other reasons why their clinicians think they may benefit).
Long answer, with caveats:
It’s common for people before they get diagnosed with EPI to do all kinds of gymnastics with food intake. You may have eliminated certain foods, tried reducing how much fat you consumed, eating smaller, more frequent meals, tried a low FODMAP diet, or made any number of other food changes. All of that was because you were not digesting your food well.
When you start taking PERT, you may find an initial dose that works for you (let’s say 50,000 units of lipase or 72,000 units of lipase) for most foods that you eat. But, that’s based on your limited roster of foods that you had reduced to. As you feel better, you may experiment with more foods, adding them back in, and/or different quantities of food. Sometimes people make the mistake of thinking symptoms after a new food are a result of the food itself, because they haven’t accounted for the fat or protein that they’re consuming. You should read this post with a lot more detail, but sometimes symptoms are a result of needing more enzymes and not a sensitivity to the food/ingredient, so track the quantity as well as the food type and be willing to try it again with more enzymes before you rule it out.
A common example I see is people saying they can only eat X grams of fat per meal, or they get symptoms. That’s based on a certain dose. Let’s say you can only eat X grams of fat on your dose of 50,000 units of lipase. You could probably consume more if you increased by one pill, to 75,000 units of lipase. It takes a bit of work, but you’ll likely end up being able to eat a lot more foods and more flexibility on quantity, if you put in the work to track and figure out what one pill “covers” for you so you can adjust per-meal. The same goes for protein, it’s common to see people struggle with “low fat meat” like chicken or fish when the problem is that they need more enzymes for the protein content – in that case it’s not about the fat.
Why do some people or clinicians recommend low fat diets?
Some people with EPI have found success with low fat diets and stick with it because it works for them and they’re ok with those tradeoffs, or they have other conditions that necessitate it. They don’t always mention those other conditions, so be aware that this might be driving that decision for some people. When they give advice, it’s really “_____ works for me” even if they phrase it as “you should _____”. Reframe and look at the variety of advice you’re getting (sometimes conflicting!) and you’ll see it’s the case that different people find different things that work well for them. You might ultimately choose a lower fat diet than me, but that may or may not be “low fat”. A lot of the “low” aspects of fat or fiber are relative.
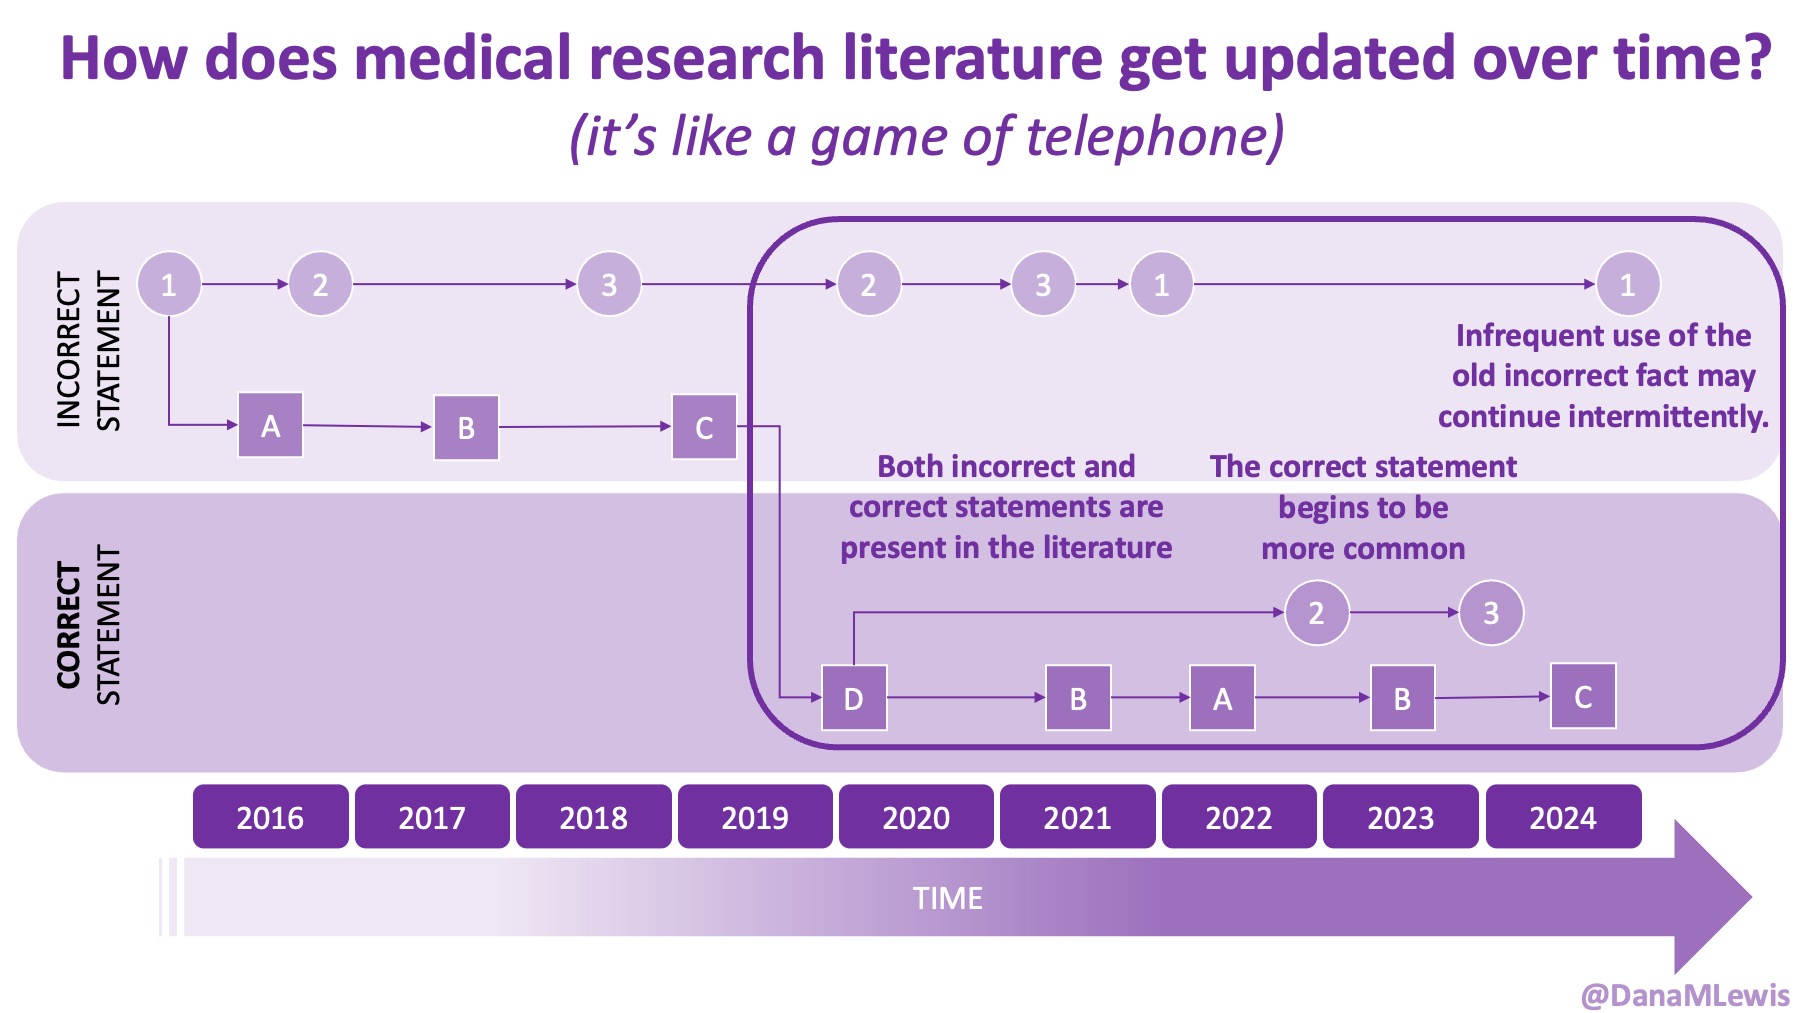
Sometimes this kind of advice comes from clinicians who’ve read older research papers: back in the 1990s we didn’t have encapsulated enzymes (so they didn’t work as well), and eating lower fat was a way to compensate for less effective enzymes and not result in symptoms and malabsorption and weight loss. Nowadays, though, prescription enzymes are encapsulated and the modern clinical best practice guidelines for EPI no longer recommend low fat. If they do, it’s a copy-paste game of telephone error. Sometimes clinicians will make population-based recommendations that aren’t a fit for you, individually, and sometimes this may be one of the cases.
Section 5 of 7: Side Effects & Brand Switching
What do I do if my enzymes are causing side effects?
First rule out other causes of symptoms, then trial a different prescription brand or over the counter enzyme under doctor guidance.
For most people, there are no side effects to taking enzymes. Yes, side effects are listed on the label, that means it’s an entire list of everything anyone ever reported during clinical trials…even if those were caused by other conditions.
Do enzymes cause hyperglycemia (high blood sugar) or hypoglycemia (hypoglycemia)?
No: blood-sugar changes reflect changing nutrient absorption, not a direct drug effect.
A low or high blood sugar can occur while taking enzymes. It’s not directly from enzymes – it’s a result of changing how your body is digesting food (with enzymes), and those changes then sometimes result in high or low blood sugar. And sometimes those changes are temporary, as your body gets used to digesting food successfully again. If you are concerned about your blood sugars, talk with your doctor and ask for an A1c test, which represents a 3 month average of your glucose level. That can be more helpful for seeing trends and whether you are seeing recurring high glucose for example, versus fingerstick blood glucose testing or CGM graphs that show you sometimes rise after a meal. That’s actually normal for everyone, including people without diabetes! So an A1c test can help put things into context. Keep in mind also that 10% of people have diabetes and so while you will see some people discover that they have type 2 or pre-diabetes, for example, around the time they started taking enzymes, it wasn’t “caused” by enzymes but likely was developing previously and happened to be discovered then, especially if you weren’t paying attention to blood sugars before and now are. It is possible to have type 3c (a different type) of diabetes develop either with EPI or as the cause of EPI (among many other causes of EPI – see below), but a lot of people may happen to have type 2 (or type 1) diabetes alongside EPI and that’s a result of how common both diabetes and EPI are; taking enzymes doesn’t cause diabetes.
Why do all the enzyme labels mention hyperglycemia or hypoglycemia? As I mentioned, it’s because people with diabetes are included in the clinical trial studies for enzymes, and when you have diabetes you have high or low blood sugar sometimes. For an infinite number of reasons. Clinical trial staff asks if you had hypo or hyperglycemia during the trial; you say yes, because you did; there’s no direct correlation with enzymes but because it happened in the trial it gets written down as a list of possible side effects. That doesn’t mean it happens to everyone or will happen to you, and if it does happen, it doesn’t mean you have diabetes. Again, people without diabetes see their glucose go up when they eat, too.
The bigger question is what if you see other side effects when taking enzymes.
What if enzymes are giving me diarrhea?
If your symptoms of EPI don’t include diarrhea, and you start taking enzymes and experiencing diarrhea, that might be a side effect of the enzymes. Or, it could correlate with bad timing where you happened to get foodborne illness or another type of illness that causes diarrhea.
Depending on your symptoms and when they started, you could consider:
- Waiting a few days to see if it continues
- Asking your doctor about trying a different kind of enzyme
Some people do react to fillers in one brand of enzyme, switch enzymes, and do just fine on the other brand. For example, they may react to Creon and switch to Zenpep and do fine. Or they react to Zenpep and switch to Creon. (Or fill in the name of a prescription enzyme brand).
Technically, these enzymes have not been studied for interchangeability…but in practical real-world terms, you can try them and use the lipase dosing to compare. For example, if you were prescribed 2 pills of Creon 24,000, you could switch to 2 pills per meal of Zenpep 25,000. If you were on Creon 10,000 and taking 4 per meal, you might switch to a single pill of Zenpep 40,000. Again, they haven’t been studied for equivalence, but they all have the same unit size of lipase and thus can generally be changed in that manner. Your doctor may not be aware of other brands (pharmaceutical marketing plays a big role in which ones they know about!), so you can look up what is approved in your country and ask to try another brand of an equivalent size dose. Again, remember to pay attention to your total dose per meal so you end up with a close equivalent size on the new brand.
Which enzymes do people react more to? Is there a better brand to start with?
Clinical data has no answers to this; tolerance is individual, so switch brands if needed but it’s more likely down to insurance coverage and doctor familiarity.
Plain and simple, there’s no data on this.
Any anecdata you see from people in a thread reporting their issues with one enzyme or another is not a representative sample.
The only reason to consider one brand or another at the start is if your insurance will only cover brand A and not brand B, or if they cover both and one is cheaper than the other (again, remember to look at the total number of pills you need, not just the cost per pill or per bottle.
If you have side effects, you could also try switching to over the counter (OTC) enzymes
Using over the counter (OTC) enzymes is slightly different, though, than switching between prescription types. These aren’t tested and vetted through FDA manufacturing practices. These enzymes are not encapsulated like prescription enzymes are, so when they break down in your body may be differently timed. There’s been no testing for reliability in terms of how much they actually contain compared to the label. And, they’re not able to be covered by insurance, so you’ll have to pay out of pocket for these.
That being said, some people really like OTC enzymes and/or can’t tolerate the fillers in all prescription brands but can tolerate an OTC version.
Other people might prefer prescription but can’t afford them, so even out of pocket, OTC may be cheaper.
Just be aware of all the caveats above, including that you should also pay close attention to the label on OTC enzymes. Many list the serving size for 2 pills and often contain a lot less lipase than prescription pills, which means you might end up needing to take a much higher number of pills for an equivalent size dose…and possibly even more than an equivalent dose size, since they are unencapsulated.
What do I do if all enzymes give me side effects?
This is a good example of when you should be working with your doctor.
It’s possible that your symptoms are caused by another condition that is occurring alongside or happens to be in addition to EPI, or was causing EPI-like symptoms. It can be hard to tell when a medicine is causing side effects or if you happen to be having other symptoms from another GI-related condition. Your doctor is trained and can help you think through when your symptoms occur relative to when you eat and when you take enzymes and whether they may be related to something else.
(See below sections for other overlapping conditions.)
Section 6 of 7: Possible Misdiagnosis
Can EPI be misdiagnosed or temporary?
Yes—watery stools, untreated celiac disease, or SIBO can transiently lower elastase; repeat testing after treatment clarifies.
It’s possible to have a misdiagnosis with EPI. Remember or re-read the sections above about how EPI is diagnosed and how the symptoms can overlap with other conditions. It’s also possible to have low elastase temporarily due to another condition, where it later resolves and returns to normal.
This can happen for a small number of people with celiac disease, for example, and there are studies showing people with newly diagnosed celiac with EPI-like symptoms and lowered elastase that eventually (on a fully gluten free diet) have their elastase return to normal levels and not require enzymes. That’s not true for all cases of celiac, though.
It’s also common to hear people report that they had SIBO (small intestinal bacterial overgrowth) and once treated, sometimes their elastase returns to normal and they no longer need enzymes.
It’s also possible to have SIBO and EPI, and even after successfully treating SIBO and eliminating it, they still have EPI and lowered elastase and need enzymes.
There are no good numbers, unfortunately, on how common these different scenarios are. Just in general, remember:
- It is possible to be misdiagnosed. This can be from having a condition that temporarily causes lowered elastase, or it can be due to a watery stool sample during the elastase test.
- It is also possible to have multiple conditions at the same time, which makes it challenging to track whether your enzyme dosing is optimal for EPI.
Section 7 of 7: Causes & Long-Term Outlook
What causes exocrine pancreatic insufficiency?
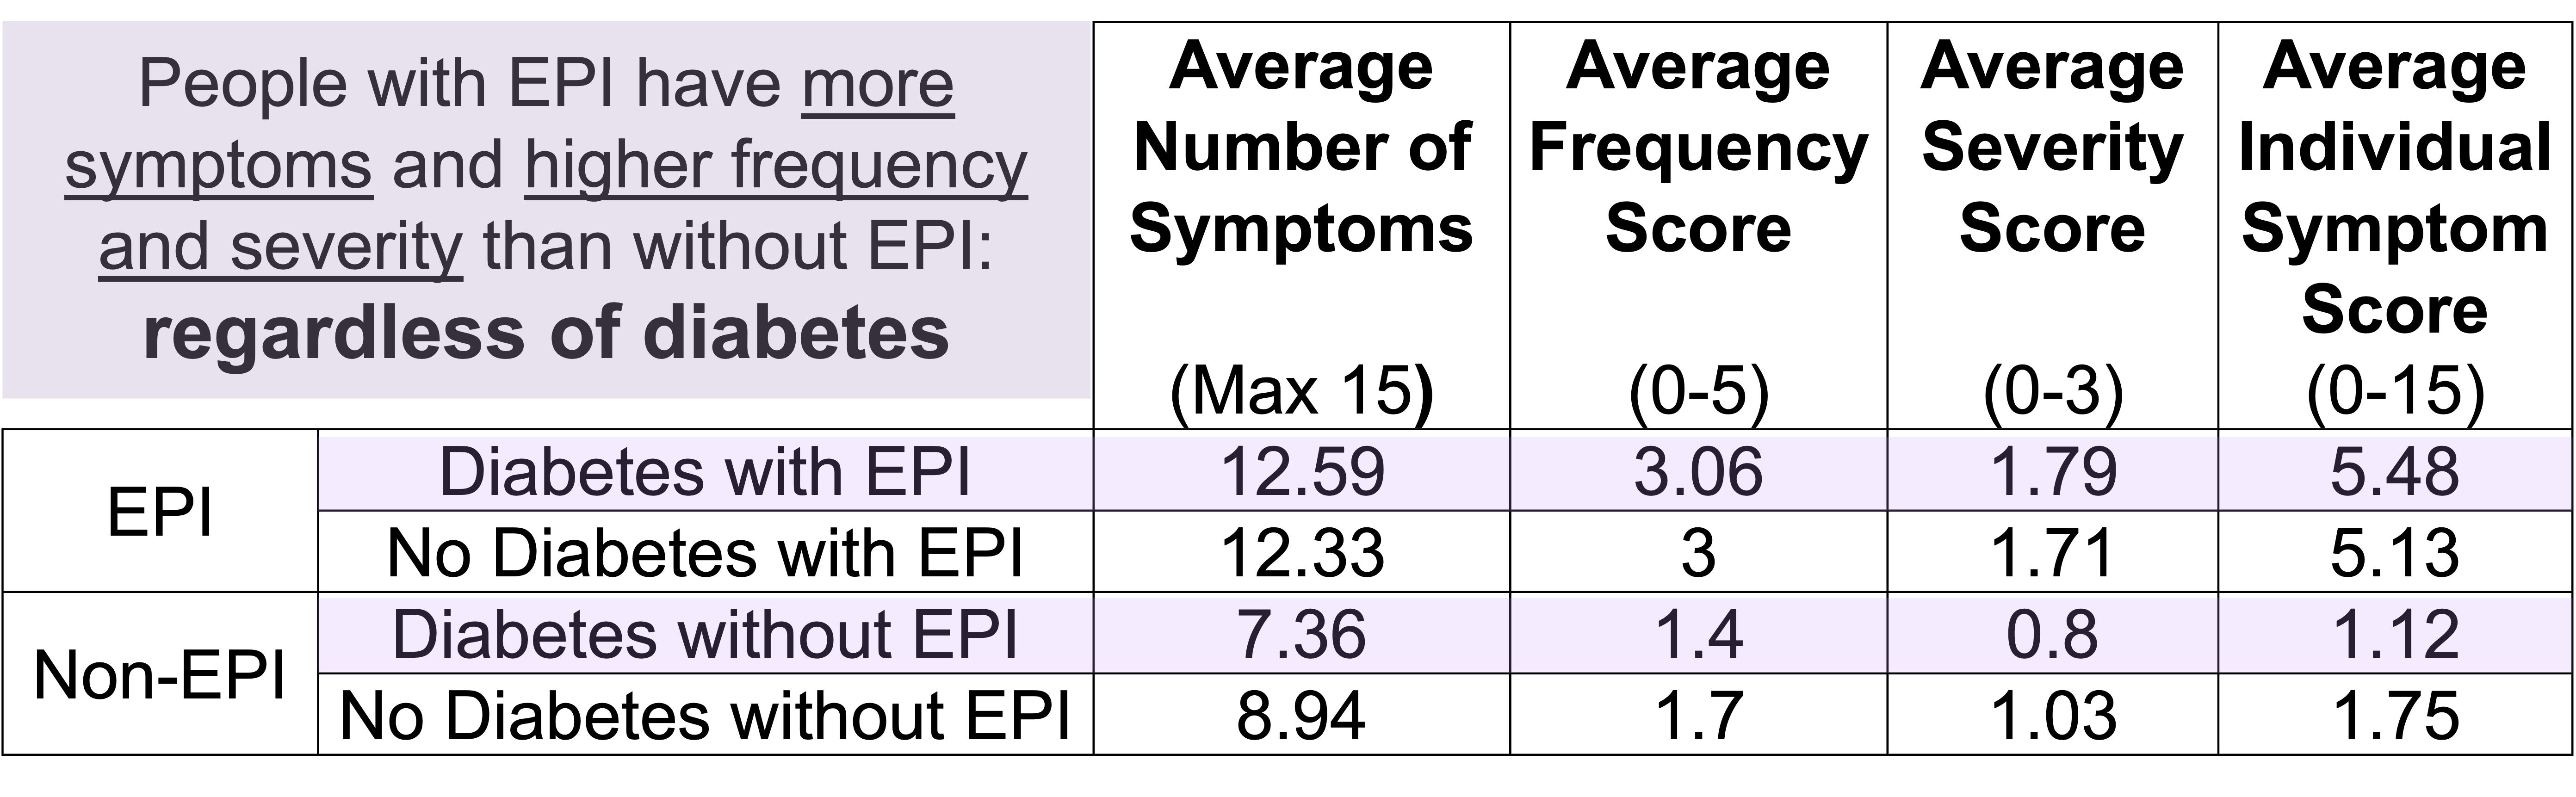
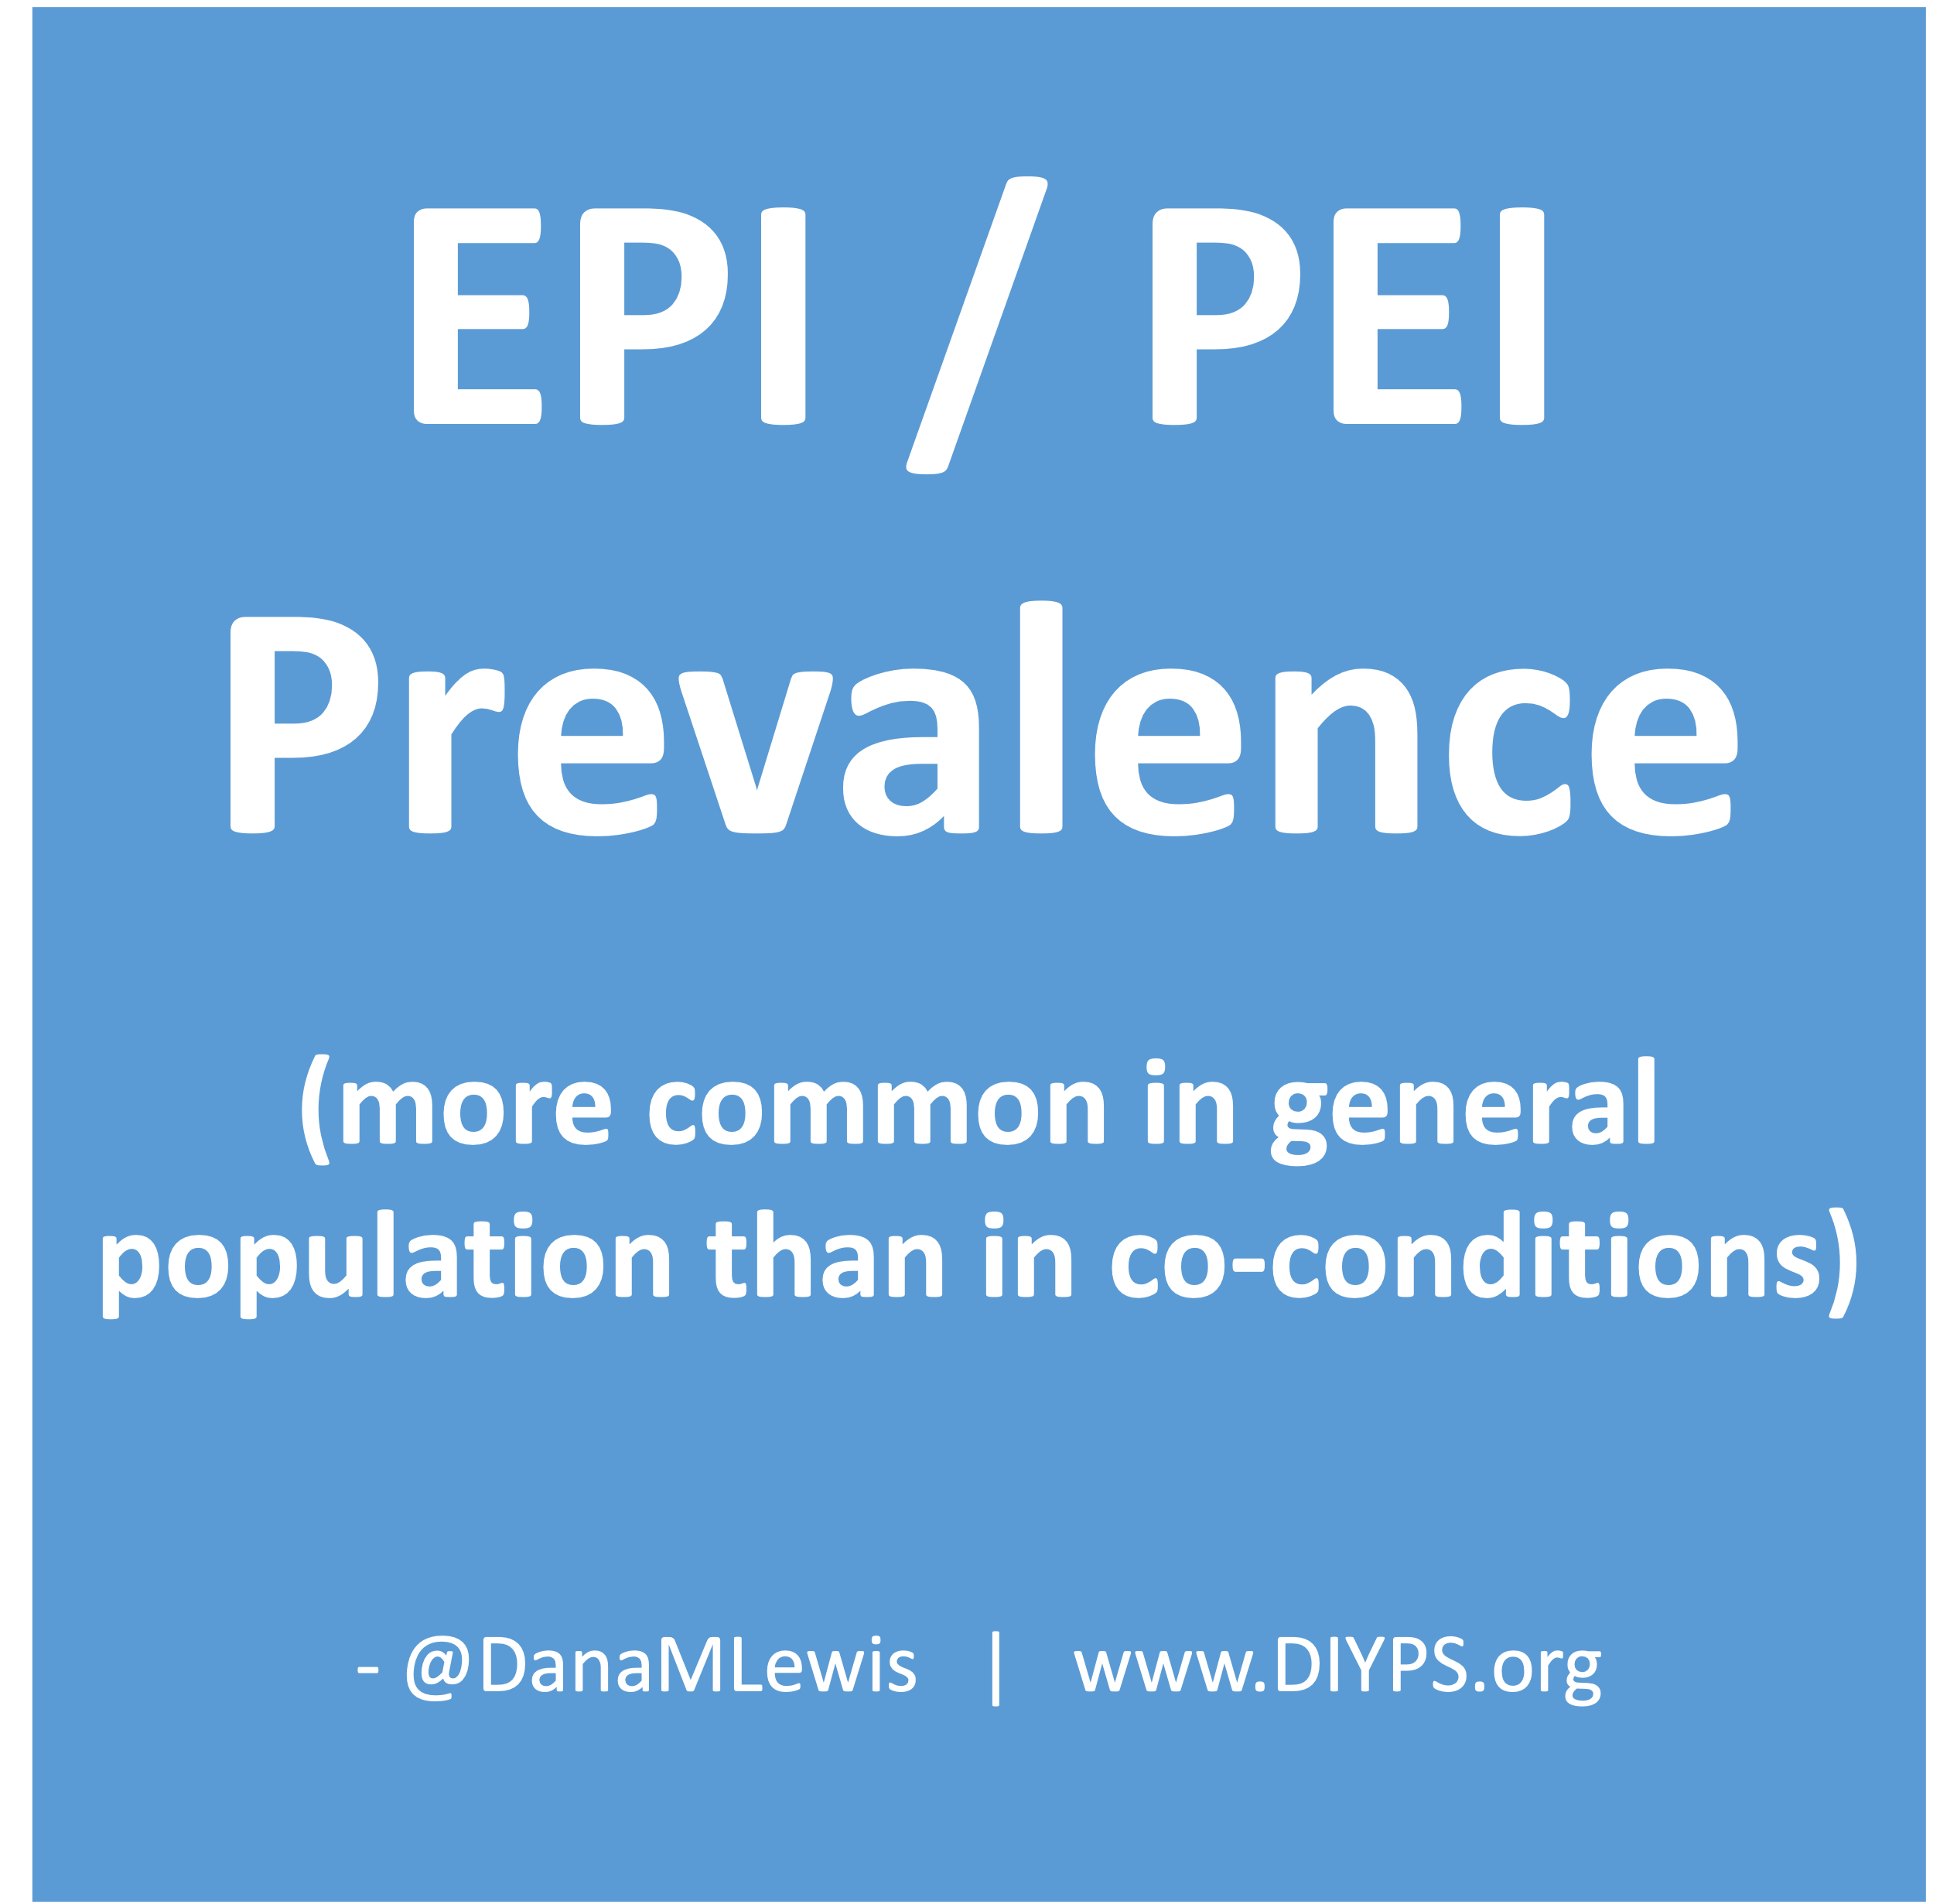
EPI may follow pancreatic surgery or occur in people with diabetes, chronic pancreatitis, cystic fibrosis, or certain cancers, but often occurs without a clear cause; the enzyme problem itself does not usually cause diabetes or cancer.
There is no single cause of EPI.
Another way to put it: there are a lot of ways to have EPI and likely from different mechanisms in your body. It’s also not always possible to tell what the causal mechanism is, even if you have a condition that is known to have higher rates of EPI than in the general population.
For example, if you had pancreatic surgery and removed part or all of your pancreas, such that there isn’t a part left that produces enzymes? Then you’d have EPI.
Sometimes cancer (GI cancers or pancreatic cancer or other) can result in people having EPI, and it’s unclear whether it’s an effect of treatment (such as chemotherapy) or if it is a mechanism of the cancer itself impacting the pancreatic function.
People with diabetes (type 1 or type 2) sometimes get EPI, but not all do. It’s possible this is due to atrophy of the pancreas or there could be other mechanisms. Note that it’s more common for people with EPI to have diabetes than any other co-conditions (prevalence of low elastase can be as high as 30% among people with diabetes, much higher than gastroparesis or celiac, and diabetes is far more common than the rare conditions like CP or PC that have high rates of EPI). So if you have gastrointestinal symptoms and you have type 1 or type 2 diabetes, you should ask your doctor about testing for EPI.
People with chronic pancreatitis often, but not always, get EPI.
Did these conditions “cause” EPI? It’s hard to say and people (including doctors) sometimes will casually use this language to mean that it’s highly associated with getting EPI when you have this other condition, but whether or not it was caused by that condition, or both conditions were caused by the same underlying factor, we don’t have evidence to prove it.
And importantly: the majority of people have no idea what caused their EPI, and have EPI without any other common co-condition (e.g. diabetes, pancreatitis, certain cancers, etc.) or health related risk factor (such as drinking alcohol or having a higher body weight or being older).
If I get EPI, will I develop diabetes or cancer?
EPI itself rarely leads to diabetes or cancer; these conditions usually stem from shared underlying physiology, not directlyfrom enzyme loss.
Most people do not develop diabetes when they have EPI. There’s no good study data on how many people do, but you can look at general population estimates of diabetes overall (roughly 10%) and estimate that you having EPI doesn’t raise your chances beyond that, otherwise we’d have a lot of studies showing this. If you do develop diabetes, it’s not necessarily because you have EPI: it could have just happened, anyway. Remember how common it is in the general population!
Most people with EPI do not have it because of cancer and most people with EPI do not develop cancer.
If you’re interested in more data on the % prevalence of each of these conditions and visualizing the size of these populations relative to each other, you will like this blog post outlining the most common ‘causes’ of EPI. Looking at the data on how few people have pancreatic cancer and chronic pancreatitis compared to the general population rates of EPI can be eye opening.
—
That’s a lot of information that can be summarized simply as:
- Symptoms of EPI are more than diarrhea and weight loss, and tools like the EPI/PEI-SS can help you track and communicate which symptoms, how frequent and severe they are, and contribute to deciding whether or not you should get a fecal elastase or other diagnostic tests.
- Fecal elastase tests are the most common way to diagnose EPI. You don’t have to stop taking enzymes when taking a fecal elastase test. This result can slightly fluctuate: changes within the EPI range don’t matter or change or your enzyme dose, but changes due to water in your sample or other conditions can cause this number to be temporarily low sometimes.
- Most people don’t take enough enzymes and could spend more time optimising their dose relative to what they eat. If you only have EPI, you should be able to resolve the majority of your symptoms to non-annoying levels with optimal enzyme dosing. The timing of when you take your enzyme matters.
- You don’t have to eat a low fat diet or a specific diet with EPI; it is more important to match the right amount of enzymes that you need for the fat (and protein) that you eat. Apps like PERT Pilot (available on iOS and Android) may help.
- Sometimes people do experience side effects to one enzyme type or another. You can change brands. Most people do fine on another brand even if they react to the first one they try (which isn’t that common, but isn’t rare either). Most people don’t have any side effects from enzymes.
- It is possible to be misdiagnosed, so if increasing dosing is not resolving your symptoms, continue to work with your doctor to evaluate what might be going on instead of, or in addition to EPI. SIBO can be a common cause of similar symptoms.
- There’s no one cause of EPI, and most people don’t know the “cause” of their EPI or have any other conditions that are known to have high prevalence of EPI. EPI is likely more common outside of other conditions, but commonly occurs in people with diabetes, chronic pancreatitis, cystic fibrosis, and some types of cancer. EPI doesn’t cause those conditions, though.
 If you have any feedback (for example, if it’s been helpful or not), you can email me any time (Dana+EPI-PEI-SS@OpenAPS.org). I’d also love to collaborate, if you’re interested in partnering on any research studies. We have some ongoing studies in different countries (US, Ireland, New Zealand, Australia) in different populations (general population; people with diabetes; people with pancreatic cancer; etc) and I’m looking forward to partnering with other researchers on additional validation studies and exploring if and how the EPI/PEI-SS can help us address some of the gaps of real-world clinical practice and life with EPI.
 As things change in my body (I have several autoimmune diseases and have gained more over the years), my ‘budget’ on any given day has changed, and so have my priorities. During times when I feel like I’m struggling to get everything done that I want to prioritize, it sometimes feels like I don’t have enough energy to do it all, compared to other times when I’ve had sufficient energy to do the same amount of daily activities, and with extra energy left over. (

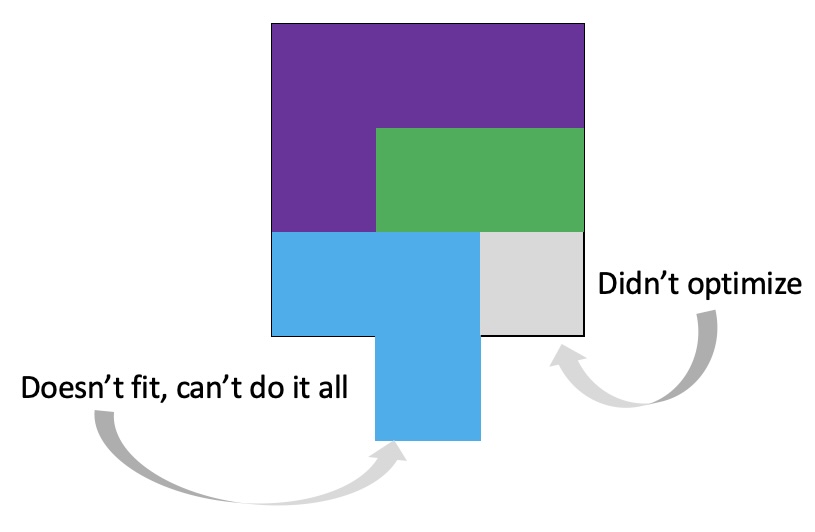 It’s important to remember that even if the total amount of time is “a lot”, it doesn’t have to be done all at once. Historically, a lot of us might work 8 hour days (or longer days). For those of us with desk jobs, we sometimes have options to split this up. For example, working a few hours and then taking a lunch break, or going for a walk / hitting the gym, then returning to work. Instead of a static 9-5, it may look like 8-11:30, 1:30-4:30, 8-9:30.


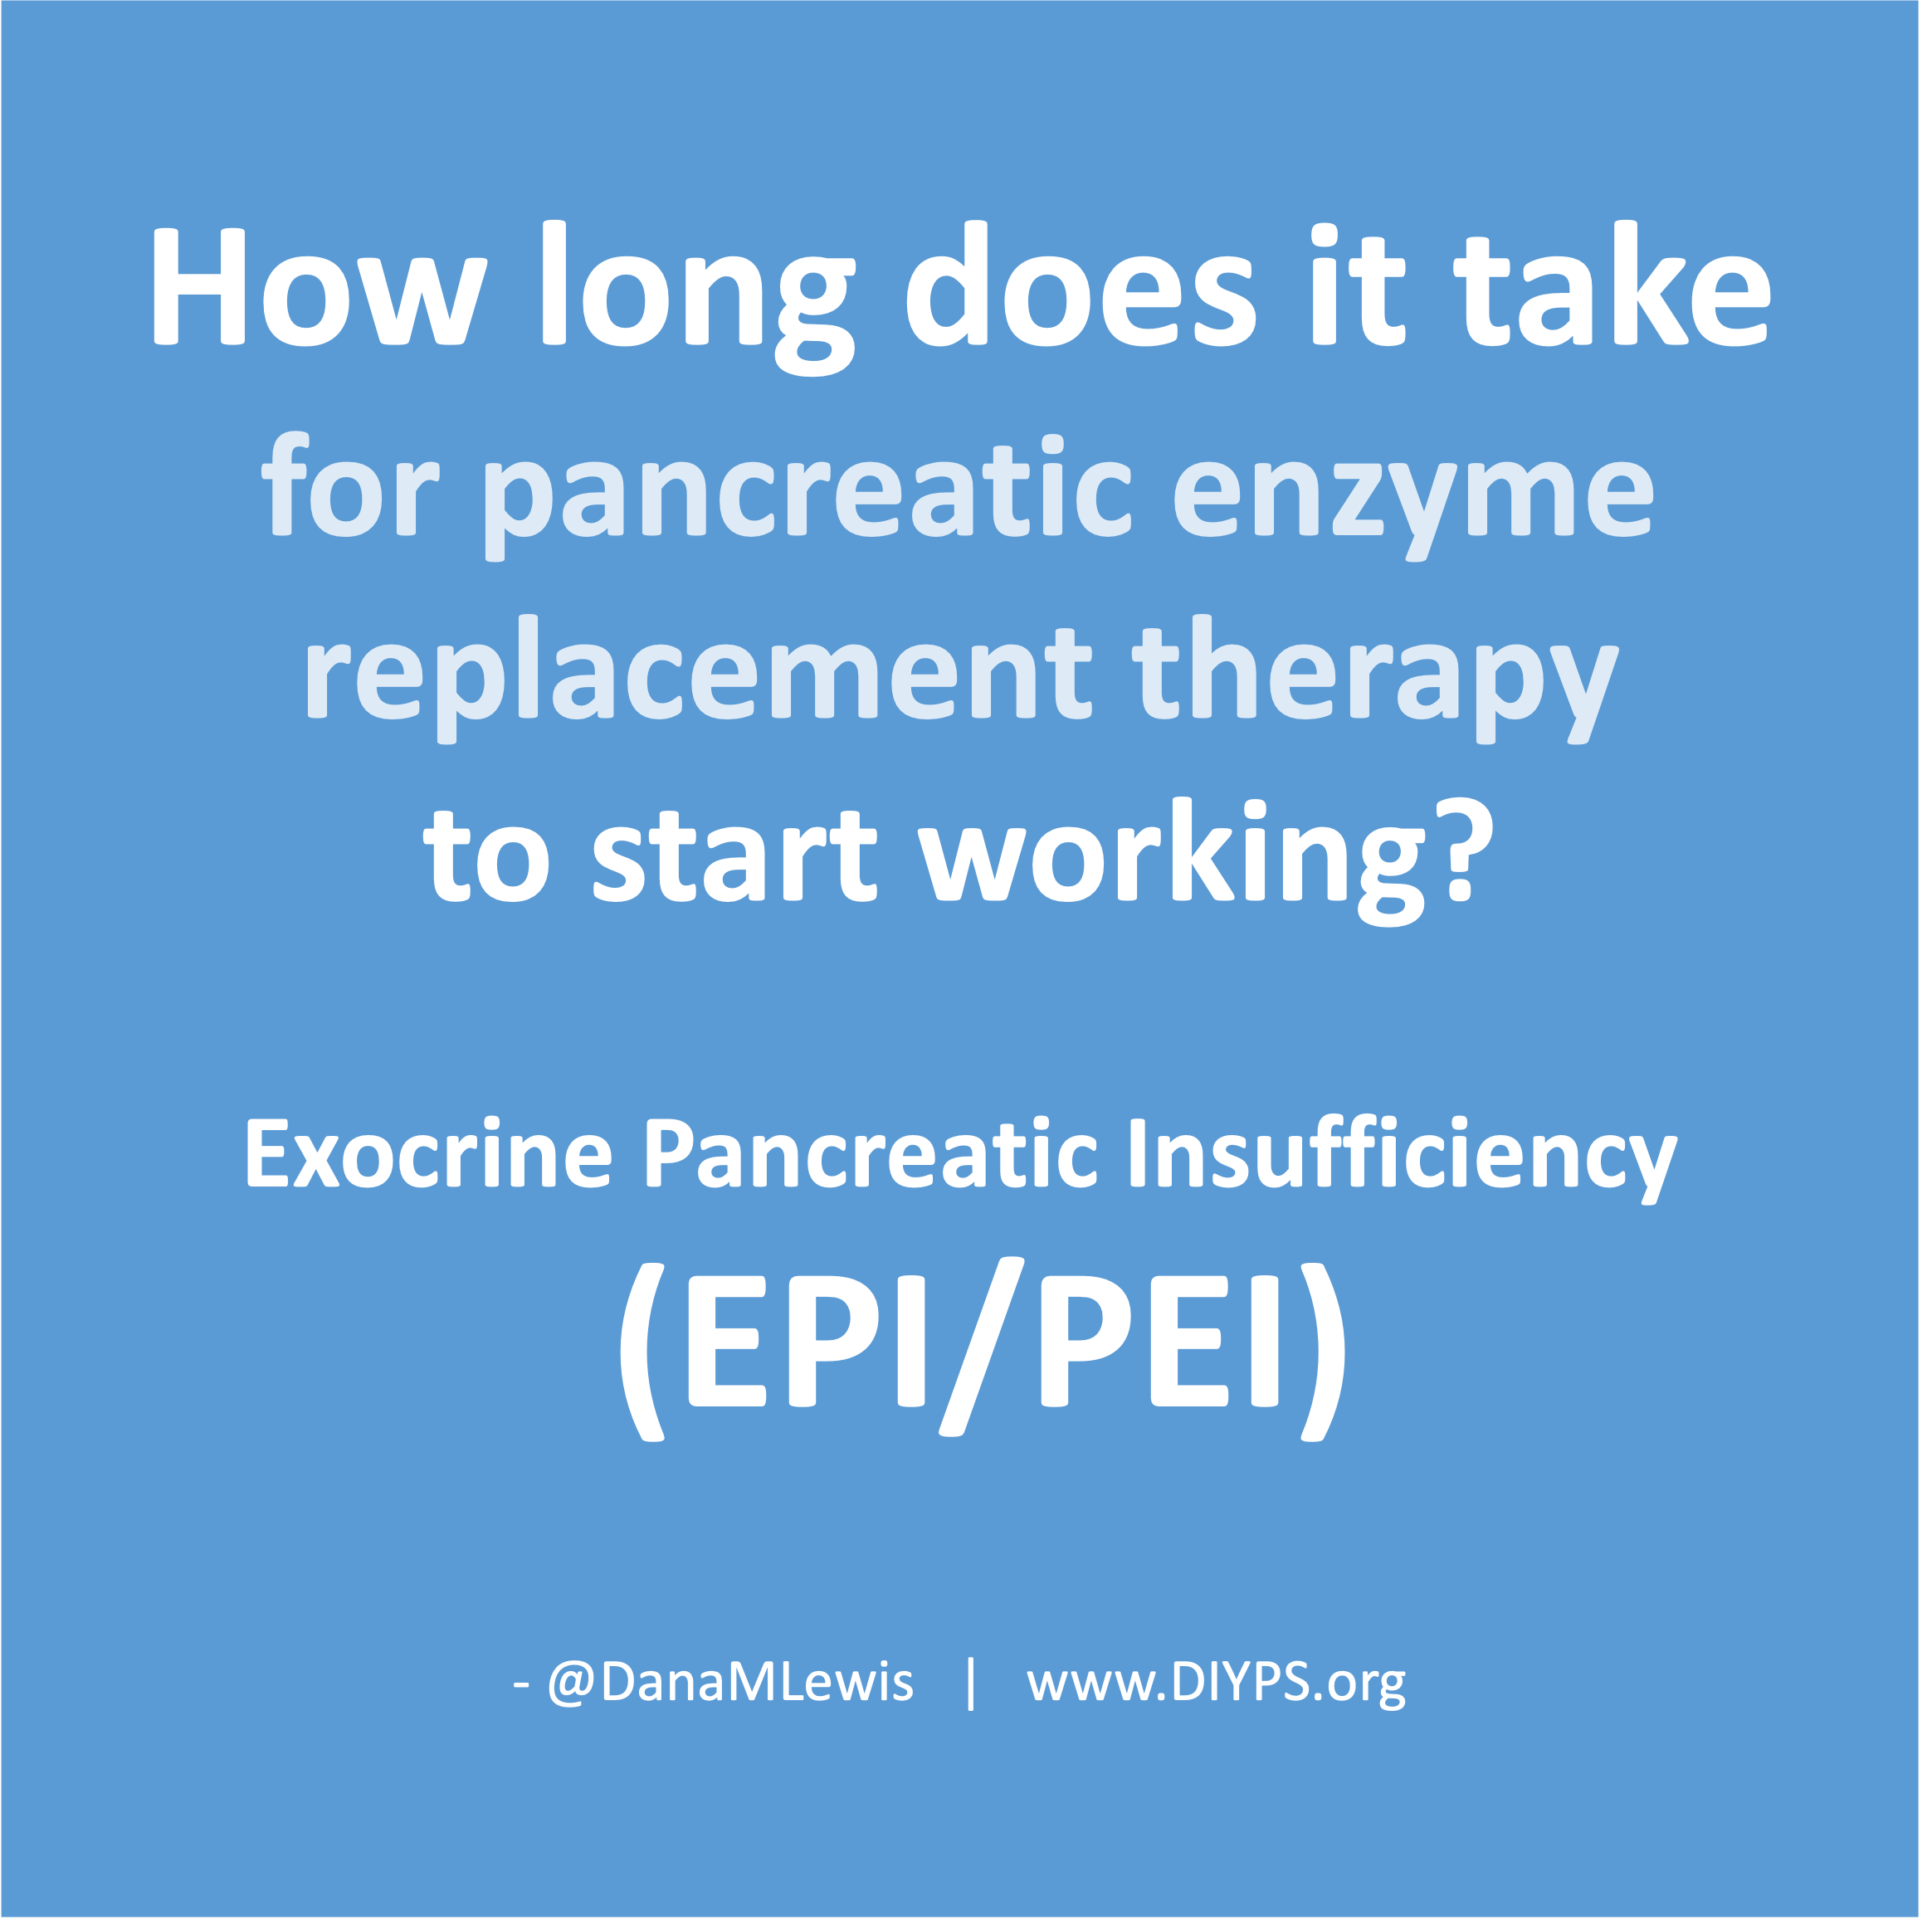 If you have been prescribed pancreatic enzyme replacement therapy (PERT), aka enzymes for exocrine pancreatic insufficiency (EPI or PEI), you may be wondering how long it will take before you start to feel better or it starts to work. This is a common question, and the answer depends on several factors, including the dosage, meal composition, and how well your body uses the enzymes. Some improvements can be seen within a single meal, while other benefits take longer to manifest. It also depends on whether you have EPI, or if you have EPI in concert with other types of gastrointestinal conditions, because some of your symptoms may be coming from other conditions.
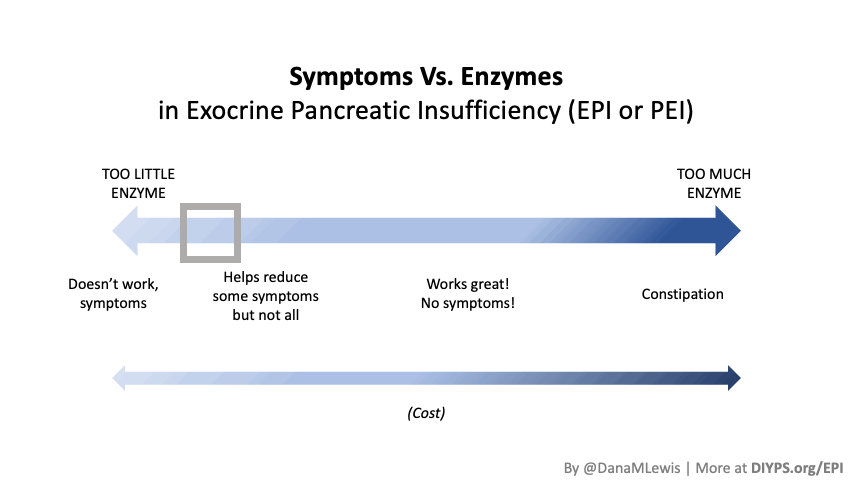
 TL;DR: Instead of arbitrarily lowering or increasing fat or fiber in the diet, measure and estimate what you are consuming first. If you have EPI,
 How do you have people take the EPI/PEI-SS? You can pull this link up (
 This came to mind because he went on a work trip, and I stuck things in the dishwasher for 2 days, and jokingly texted him to “come home and do the dishes that the raccoon left”. He came home well after dinner that night, and the next day texted when he opened the dishwasher for the first time that he “opened the raccoon cage for the first time”. (LOL).
Recent Comments