Sometimes, it’s the little things that make a big difference – even little glimpses of data, or little improvements to ways that you can control the way you access and view your data (and generate alarms).
For example, I recently had a conversation with a few people in the #WeAreNotWaiting community about the different watch faces that exist for displaying CGM data; and about how much I like my #DIYPS watch face. A few reasons why:
- It’s a little more discreet than some watch faces showing BG data, so the average person won’t glance at my watch and see a large number.
- It pulls from the #DIYPS interface, so I can see what I’m predicted to be, and any current recommendations (such as carbs, temp basal, or bolus needed).
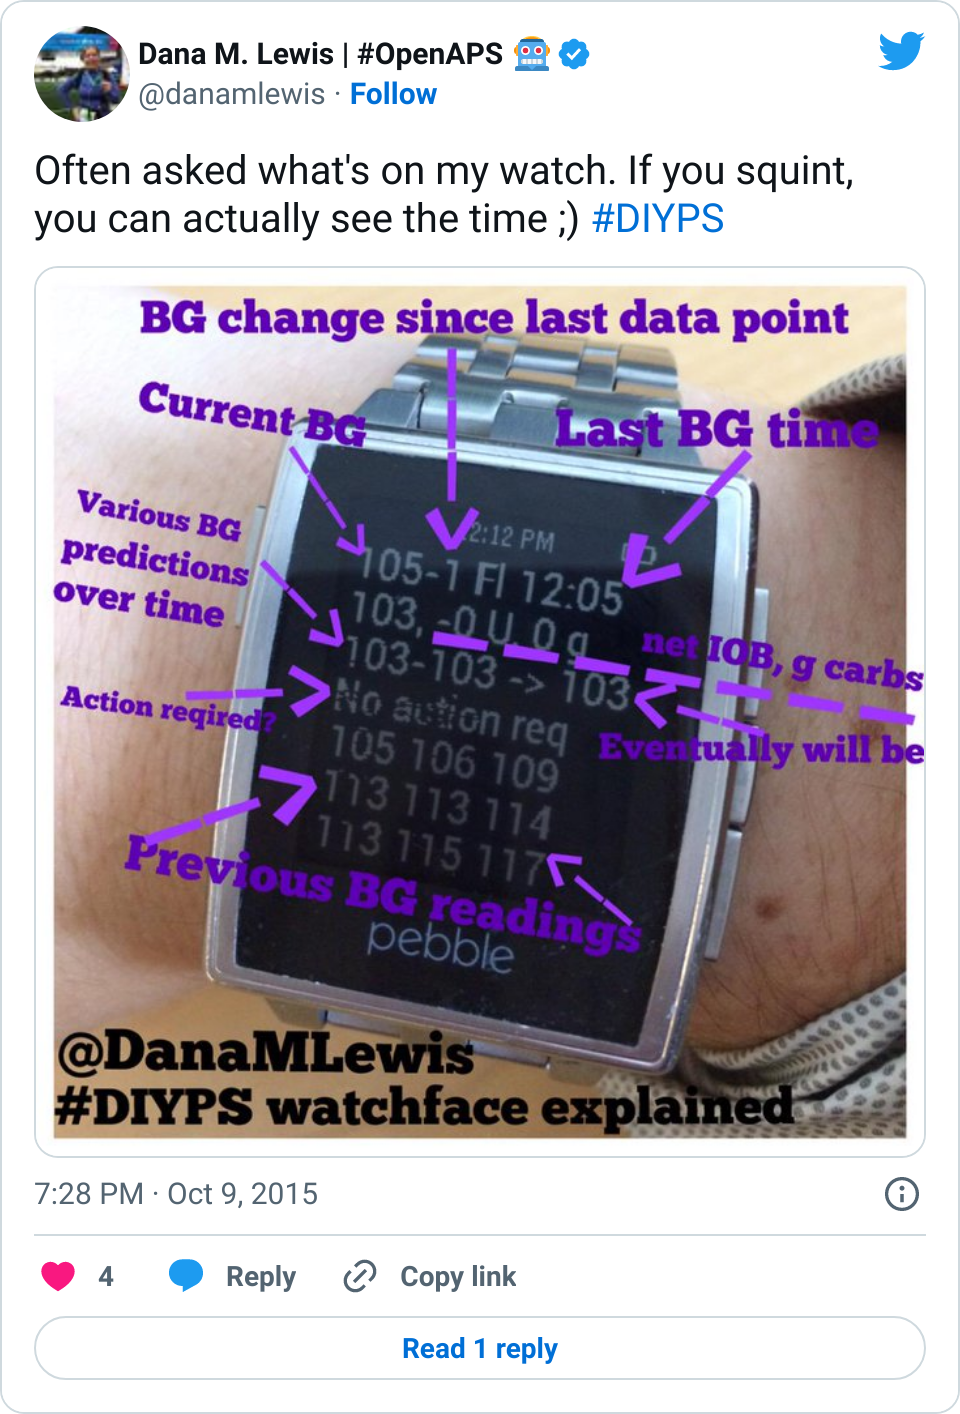
It’s data-heavy, but I like having all this information without having to pull my CGM out and run calculations in my head; or pull out my phone and pull up a web page to #DIYPS; etc.
One of the many cool things about the #WeAreNotWaiting community is how together we have learned and created so many new ways to visualize our data, on various devices (tablets, phones, smart watches) and various size screens. And so when I hear that someone’s not wanting a smart watch, or isn’t using it for diabetes related things, sometimes I think it’s a matter of them finding the right tools to build their own display that works for them. Several times a week I hear about various people working on new, interesting DIY diabetes projects, and it’s awesome that we have tech to improve the tools we have – and excellent social media channels to communicate about these projects.
Related to that, I wanted to share an update – recently Milos, Jason, and others have done some really amazing work to visualize basal rates in Nightscout. (If you use Nightscout, you can get this in the 0.8.2 release – see here for more details.) This means it also can pull in temporary basal rates that are used in #OpenAPS, so you can get a nice visual showing the adjusted basal rate compared to normal scheduled basal rates – and see why it might be needed – on top of display of BG data and everything else that Nightscout offers.
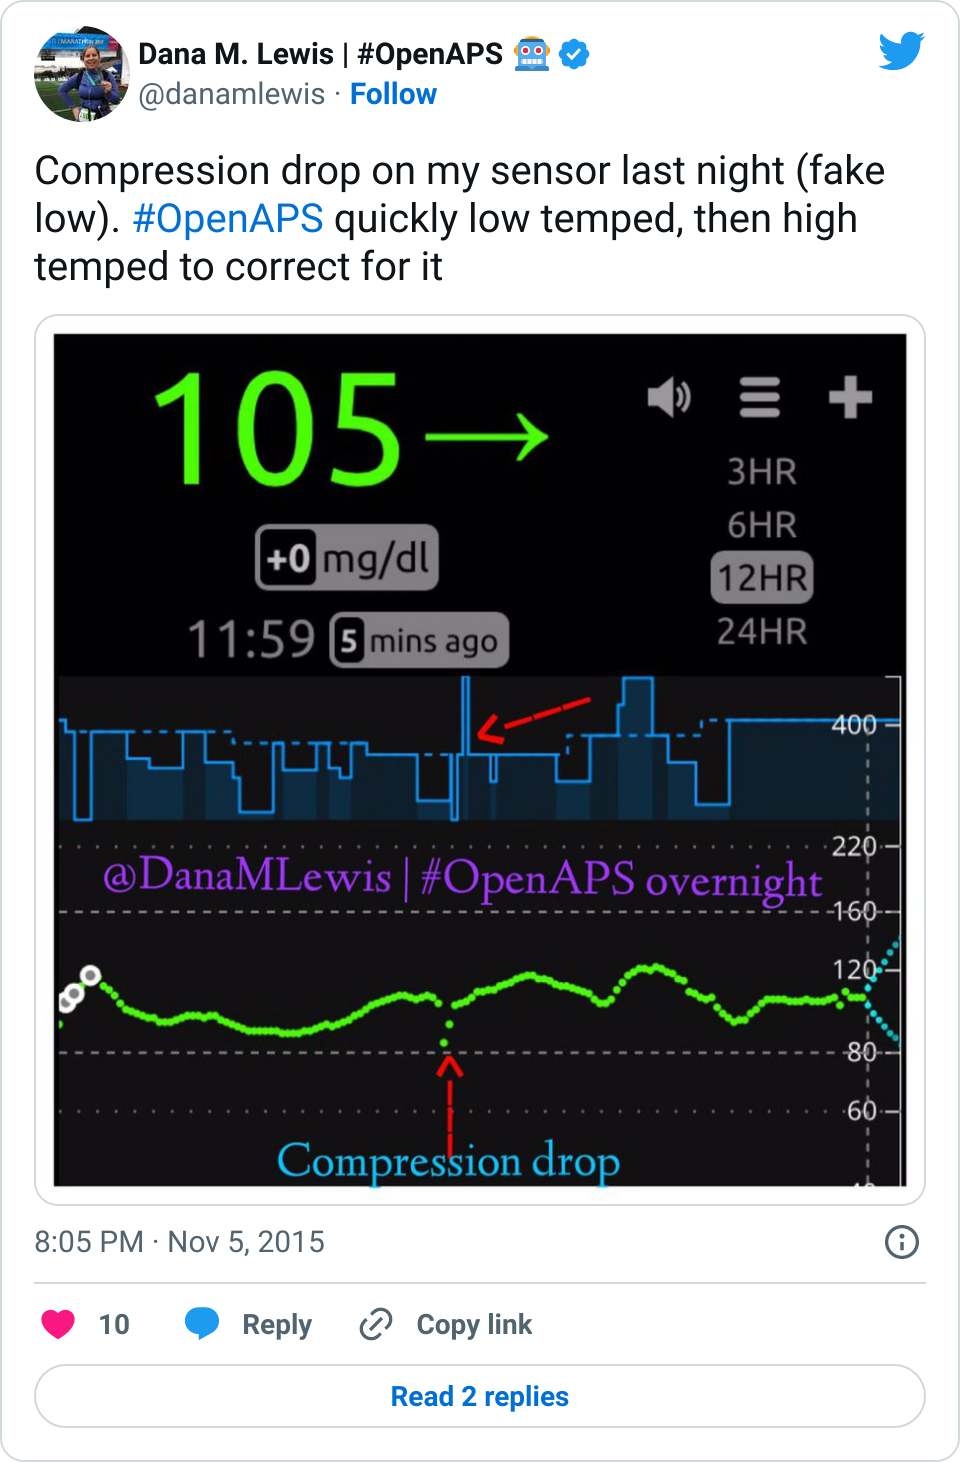
In this example, it also shows how OpenAPS deals with compression drops, or how it might react to other flukey data. Remember, we designed OpenAPS to only enact 30 minute temporary basal rates in a way that is the safest possible thing to do, even if it loses communication. But if it keeps communication, and the system sees a drop and a return to the normal pattern from before (see visual), it can counteract a low temp with higher temp, or vice versa.
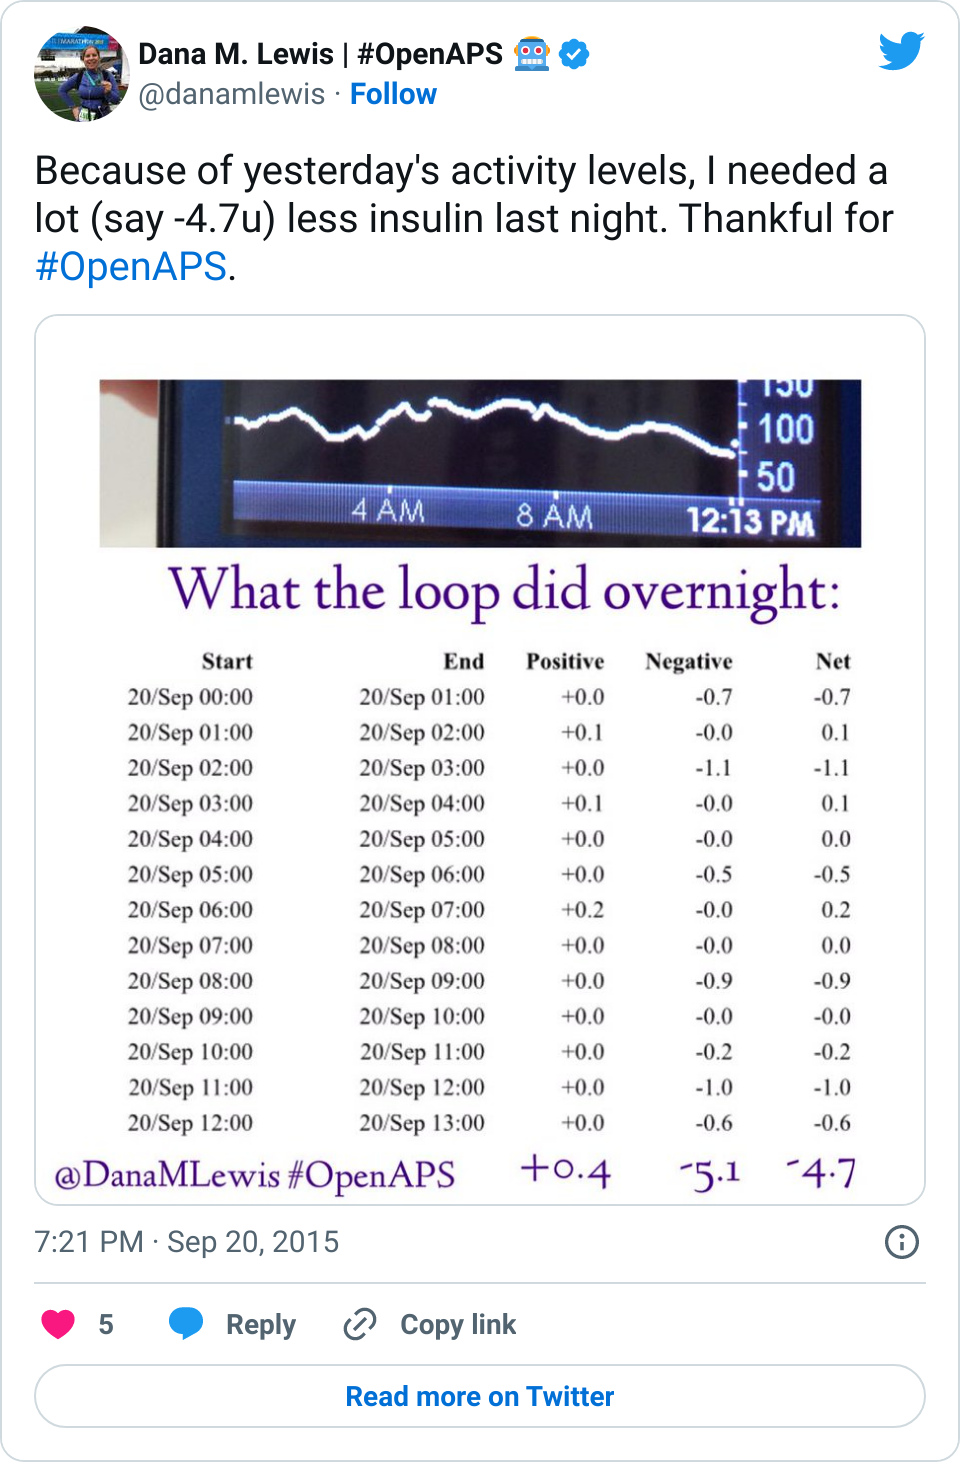
The visualization of temp basals in Nightscout (another example here) is an excellent improvement over how I previously used to check and see what OpenAPS had been doing. I have a watchface (similar to the above #DIYPS one) that shows me what the loop is doing currently, but when I wake up in the morning, I was mostly using a basic screen like the below to see the positive, negative, and net temp basal rates on an hourly basis and comparing that to my CGM graph to get an understanding of what happened.
Visualizing basal rates in Nightscout is a seemingly minor change, but every time we make a change like this that allows me to contextualize all of my data in one place (on a single glanceable watchface; or on the Nightscout screen); it saves a few seconds or minutes that add up to a lot of time saved every day, week, month, and additional year that I’m dealing with diabetes – a big win.
Recent Comments