Want signal? We need more noise (more examples to address the quiet bottleneck)

Note: I’m assuming if you are reading this post that you’ve first read this post, summarizing the concept. The below is a companion piece with some expanded details about the concepts and more examples of how I think addressing this bottleneck will help make a difference.

You might hold the perspective that in the growing era of AI, there’s too much noise already. Slopocalypse. (Side note: this entire post, and my other post, was written by me, a human.) That’s not the biggest problem in healthcare, though: in both research and clinical care, so much critical data is simply not collected. We are missing sooooo much important data. Some of this is an artifact of past clinical trial design and how it was hard to collect or analyze or store the data; there were less established norms around data re-use; and some of it is a “collect the bare minimum to study the endpoints because that’s all we are supposed to do” phenomenon.

Nowadays, we should be thinking about how to make data and insights from clinical work and research available to AI, too, because AI will increasingly be used by humans to sort through what is known and where the opportunities are, plus make cross-domain connections that humans have been missing. And we need to be thinking about whether the incentives are set up correctly (spoiler: they’re not) to make sure all available data is able to be collected and shared or at least stored for humans and AI to have access to for future insight. What is studied is also ‘what is able to be funded’, which is disproportionately things that come to the commercial market eventually after regulatory approval.)

“But what’s the point?” you ask. “If no one is looking at the data from this study, why collect it?” Because the way we design studies – to answer a very limited-scope question, i.e. safety and efficacy for labeling claims and regulatory approval – is very different than the studies we need around optimizing and personalizing treatments. If you look at really large populations of people accessing a treatment –  think GLP-1 RA injectables, for example – you eventually start to see follow-on studies around optimization and different titration recommendations. But most diseases and most treatments aren’t for a population even 1/10th the size of people accessing those meds. So those studies don’t get done. Doctors don’t necessarily pay attention to this; patients may or may not report relevant data about this back to the doctor (and again even if they do: doctors don’t mentally or physically store this data, often); and the signal is missed because we don’t capture this ‘noise’.

This means people with rare diseases, undiagnosed diseases, atypical or seronegative diseases, unusual responses to treatments, multiple conditions (comorbidities), or any other scenario that results in them being part of a small population and where customizing and individualizing their care is VERY important…they have no evidence-based guidance. Clinicians do the best they can to interpret in the absence of evidence or guidelines, but no wonder patients often turn to LLMs (AI) for additional input and contextualization and discussion of the tradeoffs and pros and cons of different approaches.

We have to: the best available human (our clinicians) may not have the relevant expertise; or they may not be available at all; or they may be biased (even subconsciously) or forgetful of critical details or not up to date on the latest evidence; or they may be faced with a truly novel situation and they don’t have the skills to address it because they’re used to cookie-cutter standardized cases. This is not a dig at clinicians, but I recognize that we now have tools that can address some of the existing flaws in our human-based healthcare system. I keep talking about how we need to recognize that evaluations of AI in healthcare shouldn’t treat the status quo as the baseline to defend, because the status quo itself has problems, as I just described.

And AI has some of the same problems. (Except for the ‘not available’ part, unless you consider the lower-utility free access models to mean that the more advanced, thinking-based models are ‘not available’ because of cost access barriers). An AI may not have any training data on a rare disease… because nothing exists. It may drop information out of the context window, and we may not realize that this has happened (i.e., it ‘forgets’ something). Usually these are critiques of AI, juxtaposed against the implication that humans are better. But notice that these critiques are the same of humans, too! This happens all the time with human clinicians in healthcare. A human can’t make decisions on data that doesn’t exist in the world, either!

So…how do we “fix” AI? Or, how do we fix human healthcare? We should be asking BOTH questions. Maybe the answer is the same: increase the noise so we increase the signal. Argue about the ratio later (of signal:noise), but increase the amount of everything first. That is most important.

How might we do this? I have been thinking about this a lot, and Astera recently posted an essay contest asking for ideas that don’t fit the current infrastructure. (That’s why I’m finally writing this up, not because I think I’ll win the essay contest, but mostly because i’s an opportunity for people to consider whether/not this type of solution is a good idea as a separate analysis from “well, who is going to fund THAT?”. Let’s discuss and evaluate the idea, or riff on it, without being bogged down by the ‘how exactly it gets funded and managed over time’.)

I think we should create some kind of digitally-managed platform/ecosystem to do the following:

  1. Incentivize and facilitate written (AI-assisted allowed) output of everything. Case reports and scenarios of people and what they’re facing. All the background information that might have contributed. All the data we have access to that is related to the case, plus other passive, easy-to-collect data (that may already be collected, e.g., wearables and phone accelerometer data) even if it does not appear to be related. Patient-perspective narratives, clinical interpretations, clinical data, wearable data – all of this.

    A.) And, be willing to take variable types of data even from the same study population. For example, as a person with type 1 diabetes, I have 10+ years of CGM data. For a future study on exocrine pancreatic insufficiency, for example, not everyone will have CGM data, but because CGM data is increasingly common in people with T2D (a much larger population) and in the general population, a fraction of people will have CGM data and a fraction of people are willing to share it. We should enable this, even if it’s not for a primary endpoint analysis on the EPI study and even if only a fraction of people choose to share it – it might still be useful for subgroup analysis, determining power for a future study where it is part of the protocol, and identifying new research directions!

  2. Host storage somewhere. There can be some automated checking against identifiable information and sanity checking what’s submitted into the repository, plus consent (either self-consent or signed consent forms for this purpose.)
  3. Provide ‘rewards’ as incentives for inputting cases and data.

    A) Rewards might differ for patients self-submitting data and researchers and clinicians inputting data and cases. Maybe it’s one type of reward for patients and a batch reward of a free consult or service of some kind for researchers/clinicians (e.g. every 3 case reports submitted = 1 credit, credits can be used toward a new AI tool or token budget for LLMs or human expertise consult around study design, or all kinds of things.)

    B) Host data challenges where different types of funders incentivize different disease groups or families of conditions to be added, to round out what data is available in different areas.

  4. Enable AI and human access (including to citizen scientists/independent researchers who don’t have institutions) to these datasets, after self-credentialing and providing a documented use case for why the data is being accessed.

    A) Require anyone accessing the dataset to make their analysis code open source, or otherwise openly available for others to use, and to make the results available as well.

    B) Tag anytime an individual dataset is used by a project, that way individuals with self-donated data (or clinicians submitting a case) can revisit and see if there are any research insights or data analysis that applies to their case.

    C) Provide starter projects to show how the data can be used for novel insight generation. For example, develop sandboxes for different types of datasets with existing ‘lab notebooks’, so to speak, to onboard people to different datasets/groups of data, different types of analyses they might do, and to cut down on the environment setup barriers to getting started to analyzing this data.

    D) Facilitate outreach to institutions, disease-area patient nonprofits and advocacy groups both to solicit data inputs AND to use the data for generating outputs.

Why should we do this?

  • Clinical trials do not gather all of the possible useful data, because it’s not for their primary/secondary endpoints. Plus, they would have to clean it upon collection. Plus storage cost. Plus management decisions. Etc. There’s a lot of real barriers there, but the result is that clinical trials do not capture enough or the most possible relevant data. So we need a different path.
  • Clinicians/clinical pathways don’t have ways to review data, so they avoid doing it. There’s no path to “submit this data to my record but I don’t expect you to look at it” in medical charts (but there should be). So we need a different path.
  • Disease groups/organizations sometimes host and capture datasets, but like clinical trials, this is limited data; it often comes through clinical pathways (further limiting participation and diversity of the data); it doesn’t include all the additional data that might be useful. So we need a different path.
  • Some patients do publish or co-author in traditional journals, but it’s a limited, self-selected group. Then there are the usual journal hurdles that filter this down further. Not everyone knows about pre-prints. And, not everyone knows how useful their data can be – either as an n=1 alone or as an n=1*many for it to be worth sharing. A lot of people’s data may be in video/social media formats inaccessible to LLMs (right now) or locked in private Facebook groups or other proprietary platforms. So we need a different path.

Thus, the answer to ‘why we should do this’ is recognizing that: AI does not create magic out of nowhere. It relies on training data and extrapolating from that, plus web search. If it’s not searchable or findable, and it’s not in the training data, it’s not there. Yes, even the newer models and prompting it to extrapolate doesn’t solve all of these problems. What AI can do is shaped disproportionately by formal literature, institutional documents, and whatever scraps of publicly available content remain. If we want to shape what’s possible in the future, we need to start now by shaping and collecting the inputs to make it happen. We can’t fix the past trial designs but we can start to fill in the gaps in the data!

Here is an example of how this might work and why it matters to build and incentivize this type of data sharing.

  1. If we build and incentivize data sharing, the following individuals might self-donate their data and write-ups, or a clinician might submit them. Later, someone might analyze the data and put the pieces together.
  • Someone with type 1 diabetes (an autoimmune condition) and this new-onset muscle-related issue. Glucose levels are well-managed, and they don’t have neuropathy/sensory issues (which are common complications of decades of living with type 1 diabetes), and muscle damage and inflammation markers are normal. MRIs are normal. The person submits their data which includes their lab tests, clinical chart notes (scrubbed for anonymity), a patient write-up of what their symptoms are like, and exported data from their phone with years of motion/activity data.
  • A different person with Sjogren’s disease (also an autoimmune condition) and a similar new-onset muscle-related issue. There are known neurological manifestations or associations with Sjogren’s, but more typically those are small-fiber neuropathy or similar. The symptoms here are not sensory or neuropathy. MRIs don’t show inflammation or muscle atrophy. Their clinician is stumped, but knows they don’t see a lot of patients with Sjogren’s and wonders if there is a cohort of people with Sjogren’s facing this. The clinician asks the patient and gains consent; scrubs the chart note of identifying details, and submits the chart notes, labs, and a clinician summary describing the situation.
  • Later, a researcher (either a traditional institutional-affiliated researcher OR a citizen scientist, such as a third person with a new-onset muscle-related issue) decides to investigate a new-onset muscle-related issue. They register their hypothesis: that there may be a novel autoimmune condition that results in this unique muscle-related issue as a neuromuscular disease (that’s not myasthenia gravis or another common NMJ disease) that shows up in people with polyautoimmunity (multiple autoimmune conditions), but we don’t know which antibodies are likely correlated with it. The research question is to find people in the platform with similar muscle-related conditions and explore the available lab data to help find what might be the connecting situation and classify this disease or better understand the mechanism.
  • They are granted access to the platform, start analyzing, and come across an interesting correlation with antibody X, which is considered a standard autoimmune marker but one that doesn’t differentiate by disease, and which does highly correlate with this possibly novel muscle condition when it exists and is elevated in people with at least one existing autoimmune condition and these muscle-symptoms that are seronegative for every other autoimmune and neurologic condition. Further, by reading the clinical summary related to patient B and the self-written narrative from patient A, it becomes clear that this is likely neuromuscular – stemming from transmission failure along the nerves – and that the muscles are the ‘symptom’ but not the root cause of disease. This provides an avenue for a future research protocol to 1) allow these types of patients to be characterized into a cohort so this can be determined whether it is a novel disease or a subgroup of an adjacent condition (e.g., a seronegative subgroup);  2) track whether the antibody levels are treatment-sensitive or not or stay elevated always; and 3) cohorts of treatments that can be trialed off-label because they work in similar NMJ diseases even though the mechanism isn’t identical.
  • The mechanism for this novel disease isn’t proven, yet, but in the face of all the previous negative lab data and neurological testing patient A and patient B have experienced, it narrows it down from “muscle or neuromuscular” which is a significant improvement from their previous situations. Plus, this provides pathways for additional characterization; research; and eventual treatment options to explore versus the current dead ends both patients (and their clinical teams) are stuck in. And because there are no good clinical pathways for these types of undiagnosed cases, this type of insight development across multiple cases would not have occurred at all without this database of existing data.

2. The above is a small-n example, but consider a large dataset where there are hundreds or thousands of people with CGM data submitted. Plus meal tracking data, because people can export and provide that from whatever meal-logging apps some of them happen to use.

  • By analyzing this big dataset, an individual researcher could hypothesize that they could build a predictor to identity the onset of exocrine pancreatic insufficiency, which can occur in up to 10% of the general population (more frequently in older adults, people with any type of diabetes, as well as other pancreas-related conditions like pancreatitis, different types of cancer, etc), by comparing increases in glucose variability that correlate with a change in dietary consumption patterns, notably around decreasing meal size and eventually lowering the quantity of fat/protein consumed. (These are natural shifts people make when they notice they don’t feel good because their body is not effectively digesting what they are eating). They analyze and exclude the effect of GLP1-RA’s and other medications in this class: the effect size persists outside of medication usage patterns. This can later be validated and tested in a prospective clinical trial, but this dataset can be used to identify what level of correlation between meal consumption change and glucose variability change happen over what period of time in order to power a high-quality subsequent clinical trial. This may lead to an eventual non-invasive method to diagnose exocrine pancreatic insufficiency through wearable and meal-tracking data. (None exists today: only a messy stool test that no one wants to do and is hampered by other issues for accuracy.)

These are two examples and show how even small-n data or a large dataset where there are additional subgroups with additional datasets can be useful. In the past, it’s been a “we need X, Y, Z data from everyone. A, B, C would be nice to have, but it’s hard and not everyone will share it (or is willing to collect it due to burden), so we won’t enable it to be shared for the 30% of people who are willing”. Thus, we lose the gift and contributions from the people who are able and willing to share that data. Sometimes that 30% is a small n but that small n is >0 and may be the ONLY data that will eventually answer an important future research question.

signal-noise-more-examples-DanaMLewisWe are missing so much, because we don’t collect it. So, we should collect it. We need a platform to do this outside of any single disease group patient registry; we need to support clinician and patient entries into this platform; we need to support intake of a variety of types of data; and we need to have low (but sensible) barriers to access so individuals (citizen scientists, patients themselves) can leverage this data alongside traditional researchers. We need all hands on deck, and we need more data collected.

Want signal? We need more noise (looking at the quiet bottleneck)

We need more signal, which means we want more noise. A lot of current scientific infrastructure is designed to minimize messiness: define a narrow question, collect the minimum data required to answer it, standardize the dataset, exclude complicating variables, finish the analysis, publish the result. That approach is understandable. It is also one reason we repeatedly fail the patients who most need evidence: people with unusual responses, multiple conditions, atypical phenotypes, rare diseases, or combinations of features that do not fit cleanly into existing bins. Our systems today are structurally designed to discard or never capture the kinds of heterogeneous, partial, contextual, or longitudinal data that could eventually make critical insights available to us.

My hypothesis is that one important scientific bottleneck is not a lack of intelligence, or even a lack of data in the abstract, but a lack of infrastructure for accepting, preserving, and reusing the kinds of data that fall outside formal trial endpoints and standard clinical workflows. I am proposing a solution: a shared platform that accepts optional, heterogeneous, participant- and clinician-contributed data, which will generate clinically useful subgroup hypotheses that standard trial and registry structures fail to generate.

Here are the quiet bottlenecks in the current system that I run into and that this platform would address:

  1. Atypical, comorbid, and small-population patients are systematically left without usable evidence because current research systems are optimized to suppress heterogeneous data rather than preserve it. (Clinical trials are usually designed around narrow endpoint collection, fixed inclusion and exclusion criteria, and standardized datasets that are tractable for a specific immediate question. Patients are often told there is “no evidence,” when what is really missing is a system that could have captured and preserved evidence that can help with future translation for atypical or edge-case presentations.)
  2. Useful data is routinely discarded because no existing structure is responsible for capturing it. (Clinical trials generally do not want to collect data outside primary and secondary endpoints because of cleaning, storage, analysis, and governance costs. Clinical care systems do not want to ingest large volumes of patient-generated data that clinicians are not expected to review. Disease registries are usually narrow and disease-specific. Journals are poor infrastructure for surfacing up data. There is no home for this data.)
  3. AI and humans are constrained by the same missingness problem: the knowledge base is biased and uneven because we do not capture enough of the right kinds of real-world data. (LLMs and other AI systems are often criticized for bias, holes, and nonrepresentative training data. But this overlooks that clinicians and researchers are also reasoning from the same incomplete literature, selective trial populations, under-collected real-world evidence, and publication-filtered case reports. The bottleneck is upstream of both.)AI now makes it possible to overcome these constraints, but only if the data is collected and made available in the first place.
  1. Current systems privilege uniform completeness over partial but valuable contribution, which causes preventable signal loss. (If not everyone has or is willing to provide the data, it’s not collected. Subsets of participants who are willing and able to contribute additional data, such as wearables, CGM, meal logs, phone sensor streams, or symptom data, are prevented from doing so.)

Why current structures produce these bottlenecks

No single existing institution is responsible for optional data intake, long-term stewardship, and broad downstream access. And different structures prioritize different data capture, with no harmonization between these two settings. Clinical trials are funded, regulated, and staffed to answer bounded questions. Clinical trial incentives reward endpoint completion, analyzable datasets, and publication-ready results. Anything beyond the core clinical trial protocol creates additional costs: more data cleaning, more storage, more governance, and more analytic work that may not directly serve the trial’s primary purpose. Under those conditions, narrowness is rational but it is also systematically lossy. Clinical care systems have a different but related design problem. Electronic health records are built for documentation, care coordination, and billing, not for capturing or allowing participant-generated, future-use data that a clinician does not need for real-time decision making. This illustrates the infrastructure gap: patients may have useful longitudinal data, but there is often no legitimate pathway to store it in a way that supports future analysis. Disease registries and advocacy-group datasets help in some cases, but they are typically narrow in scope, tied to a disease silo, and constrained by the same pressures toward standardization and limited datastreams. Publications are also poorly matched to this problem, because they are optimized for polished outputs, not for preserving heterogeneous data. Much of the infrastructure was shaped from prior underlying constraints (when data capture, storage, and analysis was more expensive).

Testable hypotheses that would address these challenges:

  1. Allowing partial, nonuniform data donation from participants will outperform “uniform minimum dataset only” models for early discovery in rare, atypical, and comorbid populations.
  2. Structured case narratives combined with quantitative data will enable more useful discovery than quantitative data alone for poorly characterized conditions, because the narrative context helps identify mechanistic or phenotypic patterns that are otherwise lost.
  3. Modern tools (LLMs etc) make it feasible to analyze and normalize real-world participant-contributed data at a scale and cost that was previously impractical.
  4. For some under-characterized conditions, a heterogeneous real-world repository can identify candidate biomarkers, phenotypic subgroups, or prospective-study designs and lead to a shorter timeline for protocol development and funding of eventual trials, compared to the status quo.

Here are a few example experiments we can use to validate these hypotheses:

  1. Use heterogenous real-world data to test whether a shared repository can generate an earlier detection hypothesis that existing structures are poorly positioned to generate. For example, exocrine pancreatic insufficiency. EPI is common but underdiagnosed and its current diagnostic pathway is unpleasant (a stool test) and imperfect. As digestion becomes less effective, people often change what and how they eat before anyone labels it as a problem: meal sizes may shrink, fat and protein consumption may drift downward, symptom patterns develop, and glucose variability may shift in parallel, especially in people with diabetes or others who happen to have CGM data. A conventional clinical trial would rarely collect all of these data together (GI symptoms, meal logs, and CGM data). We have shown that a patient-developed symptom survey can effectively distinguish between EPI and non-EPI gastrointestinal symptom patterns in the general population. But this relies on people to know they have a problem and fill out the symptom survey to assess their symptoms. By analyzing CGM and meal logging data, we may be able to create a diagnostic signal from CGM data that may provide an earlier detection of EPI or other digestive problems, noninvasively and much earlier. If successful, the output would be a concrete, testable hypothesis for a future prospective study: for example, that a specific combination of changing meal patterns and glucose variability could serve as an early noninvasive screening signal for EPI.
  2. A second, smaller experiment would test the same infrastructure in a very different setting: under-characterized autoimmune or neuromuscular overlap syndromes. Here the problem is not underdiagnosis at scale, but invisibility in small-n edge cases. Patients with unusual muscle-related symptoms, normal or ambiguous standard workups, and backgrounds that include autoimmune disease often remain isolated within separate clinics and disease silos. One person may carry a type 1 diabetes diagnosis, another Sjögren’s, another a different autoimmune history, and yet their new symptoms may share an overlooked mechanism. In current systems, these cases rarely become legible as a group because the relevant data are scattered across chart notes, patient stories, normal imaging, lab panels, and passive longitudinal data that no one is collecting or comparing systematically. This tests the same core hypothesis under tougher conditions: smaller numbers, less uniform data, less obvious endpoints, and a heavier dependence on narrative context. If the EPI case shows that optional heterogeneous data can support tractable hypothesis generation in an underdiagnosed condition, the neuromuscular case shows why the same infrastructure could matter even more in sparse-data, high-ambiguity situations where it is even harder to capture data to generate evidence in support of and funding for subsequent trials.

What we might learn if these fail

We will learn what the barrier is, whether it is still a problem of infrastructure; a lack of the right people (or AI) leveraging the data; whether partial nonuniform data donation is operationally feasible; and whether limiting factors are data availability, harmonization, governance, or analytic quality. Plus, we can determine whether certain diseases or use cases (e.g. developing novel diagnostics versus assessing medication responses) are better suited than others for this type of platform.

Why now?

Passive and participant-generated data collection is easier. Wearables, phone sensing, CGM data, meal logging apps, symptom trackers, and similar are now significantly more common. Technology makes it easier than ever to create custom apps to track n=1 data or study-specific data. Storage is cheaper. Technology improvements, most notably AI tools, have made it more tractable to collect data; and have made it more tractable for researchers to analyze this data. The remaining bottleneck is capturing, storing, and making the data available. It is less of a technological bottleneck and instead a bottleneck of funding/governance/etc. This is addressable now that the capture/analysis barriers have been lowered!

signal-noise-DanaMLewisI don’t think the question we should be asking is whether every piece of heterogenous data will be useful, but whether we can afford to keep doing what we are doing (throwing away data and still expecting discovery for the populations our current systems and infrastructure already quietly fail).  

Note: I am submitting this post to the Astera essay contest, which you can read about here. You should write up your ideas about the bottlenecks you see and submit as well! I also wrote an additional piece with more details and examples, which you can read here. 

A new symptom score for people with exocrine pancreatic insufficiency (the EPI/PEI-SS)

One of the frequent complaints in the literature about exocrine pancreatic insufficiency (known as EPI in some parts of the world, or PEI for pancreatic exocrine insufficiency elsewhere) is that the symptoms are not specific and they can overlap with other conditions. Diarrhea, for example, can happen from a lot of conditions and a lot of medications. Not everyone with EPI has diarrhea, though. Another problem is that there are other symptoms that occur in EPI other than diarrhea and weight loss, but there’s not been any data on which groups of people experience which types of symptoms with EPI, or how common the other symptoms are, so they often aren’t listed. This leads to a cycle of lack of awareness, lack of screening, lack of diagnosis, and lack of treatment.

There’s been little effort to date to solve this problem, and I found myself wondering if we as patients, who experience the symptoms directly, could find a way to address this. Between my systematic review papers (where I’ve read hundreds of papers about the symptoms & diagnostic approaches to EPI) and personal experience with EPI, I made a list of 15 symptoms. But it’s not just about which symptoms people have: that’s where the overlap problem comes in. With EPI, many people have a lot of symptoms, a lot of the time, and they are VERY annoying. So the frequency and severity of the symptoms are a hallmark as well. I put together a way to quantify the frequency and severity (using plain language)of symptoms, and the EPI/PEI-SS (Exocrine Pancreatic Insufficiency Symptom Score) was born.

With help from more than a dozen people, some with EPI and some who didn’t have EPI, I ran a pilot test with the symptom score to see if the people with EPI would generate scores, the way I did, and whether people without EPI (and with either everyday gastrointestinal symptoms, or other conditions that sometimes cause GI symptoms) would have scores to match. They did not: it was a stark difference, and there wasn’t any overlap. The EPI symptom burden was quantifiably much higher than everyday GI symptoms for someone without a condition, and also higher compared to people with other conditions with GI symptoms (think food intolerances, IBS, other non-EPI GI conditions).

So I launched a bigger study that many of you participated in (thank you!), with the goal of exploring whether this score would be useful in the general population to help distinguish EPI from other conditions and whether it might possibly aid in screening for EPI.

And now, the results are published! (You can read the full open access paper here: https://doi.org/10.3390/epidemiologia6030048).

Here’s what we learned:

There were 324 participants at the time I cut off data collection for the analysis (after three weeks). This included 155 people who identified as having EPI, and 169 people without EPI. Everyone answered whether or not they had any of the 15 symptoms (falling into three groups: abdominal, toilet-related, and food-related symptoms) and indicated frequency and severity. Multiplying frequency (0–5) x severity (0–3) by each of the 15 symptoms, the EPI/PEI-SS score range is 0–225. (See Table 1 for a list of the symptoms and rating description).

The key finding: people with EPI had higher scores than people without EPI.

In this real-world study, the mean total score of those with EPI was 98.11 (min 1, max 213), in contrast to a mean total score of 38.86 for those without EPI (min 0, max 163). The difference is practically as well as statistically (p<.001) significant.

Figure 1 from the paper showing the sub-scores and total scores broken out by EPI and non-EPI groups, respectively.

Even when I separated the people without EPI into two groups, those with other gastrointestinal conditions and those without, the scores were still distinct and statistically significant from the people with EPI. I also did a sub-analysis of each individual condition and none had a significant impact on the overall score. (Because there are so many people with diabetes in my network who participated in the study, I also ran a separate sub-analysis to deeply analyse the contributions of type 1 diabetes and type 2 diabetes – and made a separate paper on this analysis, which is also open access and available to read here.) Also in the bucket of “things that did not affect the score” was age. However, females in the study reported higher scores compared to males (this matches other studies showing a higher gastrointestinal burden, so this isn’t necessarily unique to EPI).

In addition to the overall score, you can see the difference by looking at the number of symptoms people reported and the difference in frequency and severity:

  • EPI group: 12.39 symptoms, average frequency 3.02, average severity 1.73
  • Non-EPI group: 8.15 symptoms, with nearly half the frequency (1.55) and severity (0.91)
Figure 3 from the paper, showing each of the 15 symptoms and the range of scores for the EPI group (purple) and non-EPI group (blue), respectively.

Nerdy notes (you can read more in the full paper): Cohen’s d (1.475) indicated a large effect size; all comparisons overall and across sub-groups and across symptom categories were statistically significant (p<0.001). Cronbach’s alpha for sub-score categories was “good” (0.88 abdominal, 0.83 toilet, 0.88 food), indicating high internal consistency and good construct validity. Using an EPI/PEI-SS cutoff of 59 (out of possible 225), area under the curve was 0.85, sensitivity was 0.81, and specificity was 0.75.

Were there limitations for this study? You bet. It was online and based on people who happened to fill it out, so follow up studies will help confirm these results in different populations to confirm if it is representative of the average EPI experience. (Note though that this study population did have a lot more diversity of people with EPI, though, compared to most other EPI-related symptom assessment studies, which are often limited to chronic pancreatitis and cystic fibrosis, and/or pancreatic surgery/cancer.) There was a large number of people with diabetes who participated, in part because of my network and where I recruited participants from – however, as seen in this sub-study, presence of diabetes (any type, or split in type 1 and type 2) did not influence scores (analysis here). This study was also exploratory, meaning it was not powered for a specified outcome. We’ve now been able to use this data to power follow up studies, now that we know what to expect score-wise in people with and without EPI!

What should you take away from this study?

If you are a person with some kind of gastrointestinal symptoms, you can use the EPI/PEI-SS to explore your symptoms and quantify them based on frequency and severity. If your score is near or above the cutoff, you may want to consider discussing your symptoms with your doctor and exploring whether testing for EPI (often fecal elastase testing) is warranted. This tool hasn’t been validated as a diagnostic method, but this data can help the shared decision making process and hopefully also aid you in a better conversation with your doctor as you explore pathways to solutions.

The EPI/PEI-SS is available online, for free, and you can use it right now: https://danamlewis.github.io/EPI-PEI-SS/

If you are a person with EPI and you are still struggling with symptoms of EPI (PEI), you may find it handy to take the EPI/PEI-SS to document your symptom burden. Then, as you adjust your enzyme dosing, you can periodically take the EPI/PEI-SS again (every few weeks or months) and use it to help you track whether things are improving. You can use the web version, or if you want to also track your enzyme (PERT) dosing, you can use the EPI/PEI-SS in both the iOS (https://bit.ly/PERT-Pilot-iOS) and Android (https://bit.ly/PERT-Pilot-Android) versions of “PERT Pilot”. Then you can see your scores and view them over time in the same place.

Note that the scores of people with EPI in the study don’t mean that ‘this is as good as it gets’ when you go on enzymes. Many people with EPI indicate that they feel they are not dosing enough enzymes (see this study); the scores on the EPI/PEI-SS reflect this. It is possible for people with EPI to get scores in the non-EPI range, once enzymes are regularly dosed to match what you’re eating. (For example, my score went from well above the cutoff to well below the average non-EPI score once I started enzymes.)

If you are a doctor, take a look at the EPI/PEI-SS (see links, or Table 1 in the paper) so you know what some of the symptoms of EPI are. Notably, be aware that diarrhea and weight loss are not the only symptoms of EPI. In the diabetes sub-study, for example, we found food-related behaviors to be a key variable, as many people intuitively adjust what or how they are eating to try to eliminate symptoms on their own. Pain is not prominent in all corners of the EPI community (it’s more common among people with pancreatitis). Feel free to have patients use the EPI/PEI-SS any time and use it as part of your shared decision making process.

A new symptom score for exocrine pancreatic insufficiency: new research on the EPI/PEI-SS (a blog by Dana M. Lewis on DIYPS.org)If you have any feedback (for example, if it’s been helpful or not), you can email me any time (Dana+EPI-PEI-SS@OpenAPS.org). I’d also love to collaborate, if you’re interested in partnering on any research studies. We have some ongoing studies in different countries (US, Ireland, New Zealand, Australia) in different populations (general population; people with diabetes; people with pancreatic cancer; etc) and I’m looking forward to partnering with other researchers on additional validation studies and exploring if and how the EPI/PEI-SS can help us address some of the gaps of real-world clinical practice and life with EPI.

If you’re a researcher with shared interest in EPI…ditto the above!

Read the research referenced in this blog post: https://doi.org/10.3390/epidemiologia6030048

Cite it: Lewis DM, Landers A. Development of Novel Symptom Score to Assist in Screening for Exocrine Pancreatic Insufficiency. Epidemiologia. 2025; 6(3):48. https://doi.org/10.3390/epidemiologia6030048

Questions? Please comment below!

If you have EPI-specific questions, you might also like this blog post with 25 questions and answers about EPI (PEI) ranging from symptoms and diagnosis to treatment and dosing titration.

Facing Uncertainty with AI and Rethinking What If You Could?

If you’re feeling overwhelmed by the rapid development of AI, you’re not alone. It’s moving fast, and for many people the uncertainty of the future (for any number of reasons) can feel scary. One reaction is to ignore it, dismiss it, or assume you don’t need it. Some people try it once, usually on something they’re already good at, and when AI doesn’t perform better than they do, they conclude it’s useless or overhyped, and possibly feel justified in going back to ignoring or rejecting it.

But that approach misses the point.

AI isn’t about replacing what you already do well. It’s about augmenting what you struggle with, unlocking new possibilities, and challenging yourself to think differently, all in the pursuit of enabling YOU to do more than you could yesterday.

One of the ways to navigate the uncertainty around AI is to shift your mindset. Instead of thinking, “That’s hard, and I can’t do that,” ask yourself, “What if I could do that? How could I do that?”

Sometimes I get a head start by asking an LLM just that: “How would I do X? Layout a plan or outline an approach to doing X.” I don’t always immediately jump to doing that thing, but I think about it, and probably 2 out of 3 times, laying out a possible approach means I do come back to that project or task and attempt it at a later time.

Even if you ultimately decide not to pursue something because of time constraints or competing priorities, at least you’ve explored it and possibly learned something even in the initial exploration about it. But, I want to point out that there’s a big difference between legitimately not being able to do something and choosing not to. Increasingly, the latter is what happens, where you may choose not to tackle a task or take on a project: this is very different from not being able to do so.

Finding the Right Use Cases for AI

Instead of testing AI on things you’re already an expert in, try applying it to areas where you’re blocked, stuck, overwhelmed, or burdened by the task. Think about a skill you’ve always wanted to learn but assumed was out of reach. Maybe you’ve never coded before, but you’re curious about writing a small script to automate a task. Maybe you’ve wanted to design a 3D-printed tool to solve a real-world problem but didn’t know where to start. AI can be a guide, an assistant, and sometimes even a collaborator in making these things possible.

For example, I once thought data science was beyond my skill set. For the longest time, I couldn’t even get Jupyter Notebooks to run! Even with expert help, I was clearly doing something silly and wrong, but it took a long time and finally LLM assistance to get step by step and deeper into sub-steps to figure out the step that was never in the documentation or instructions that I was missing – and I finally figured it out! From there, I learned enough to do a lot of the data science work on my own projects. You can see that represented in several recent projects. The same thing happened with iOS development, which I initially felt imposter syndrome about. And this year, after FOUR failed attempts (even 3 using LLMs), I finally got a working app for Android!

Each time, the challenge felt enormous. But by shifting from “I can’t” to “What if I could?” I found ways to break through. And each time AI became a more capable assistant, I revisited previous roadblocks and made even more progress, even when it was a project (like an Android version of PERT Pilot) I had previously failed at, and in that case, multiple times.

Revisiting Past Challenges

AI is evolving rapidly, and what wasn’t possible yesterday might be feasible today. Literally. (A great example is that I wrote a blog post about how medical literature seems like a game of telephone and was opining on AI-assisted tools to aid with tracking changes to the literature over time. The day I put that blog post in the queue, OpenAI announced their Deep Research tool, which I think can in part address some of the challenges I talked about currently being unsolved!)

One thing I have started to do that I recommend is keeping track of problems or projects that feel out of reach. Write them down. Revisit them every few months, and explore them with the latest LLM and AI tools. You might be surprised at how much has changed, and what is now possible.

Moving Forward with AI

You don’t even have to use AI for everything. (I don’t.) But if you’re not yet in the habit of using AI for certain types of tasks, I challenge you to find a way to use an LLM for *something* that you are working on.

A good place to insert this into your work/projects is to start noting when you find yourself saying or thinking “this is the way we/I do/did things”.

When you catch yourself thinking this, stop and ask:

  • Does it have to be done that way? Why do we think so?
  • What are we trying to achieve with this task/project?
  • Are there other ways we can achieve this?
  • If not, can we automate some or more steps of this process? Can some steps be eliminated?

You can ask yourself these questions, but you can also ask these questions to an LLM. And play around with what and how you ask (the prompt, or what you ask it, makes a difference).

One example for me has been working on a systematic review and meta analysis of a medical topic. I need to extract details about criteria I am analyzing across hundreds of papers. Oooph, big task, very slow. The LLM tools aren’t yet good about extracting non-obvious data from research papers, especially PDFs where the data I am interested may be tucked into tables, figure captions, or images themselves rather than explicitly stated as part of the results section. So for now, that still has to be manually done, but it’s on my list to revisit periodically with new LLMs.

However, I recognized that the way I was writing down (well, typing into a spreadsheet) the extracted data was burdensome and slow, and I wondered if I could make a quick simple HTML page to guide me through the extraction, with an output of the data in CSV that I could open in spreadsheet form when I’m ready to analyze. The goal is easier input of the data with the same output format (CSV for a spreadsheet). And so I used an LLM to help me quickly build that HTML page, set up a local server, and run it so I can use it for data extraction. This is one of those projects where I felt intimidated – I never quite understood spinning up servers and in fact didn’t quite understand fundamentally that for free I can “run” “a server” locally on my computer in order to do what I wanted to do. So in the process of working on a task I really understood (make an HTML page to capture data input), I was able to learn about spinning up and using local servers! Success, in terms of completing the task and learning something I can take forward into future projects.

Another smaller recent example is when I wanted to put together a simple case report for my doctor, summarizing symptoms etc, and then also adding in PDF pages of studies I was referencing so she had access to them. I knew from the past that I could copy and paste the thumbnails from Preview into the PDF, but it got challenging to be pasting 15+ pages in as thumbnails and they were inserting and breaking up previous sections, so the order of the pages was wrong and hard to fix. I decided to ask my LLM of choice if it was possible to automate compiling 4 PDF documents via a command line script, and it said yes. It told me what library to install (and I checked this is an existing tool and not a made up or malicious one first), and what command to run. I ran it, it appended the PDFs together into one file the way I wanted, and it didn’t require the tedious hand commands to copy and paste everything together and rearrange when the order was messed up.

The more I practice, the easier I find myself switching into the habit of saying “would it be possible to do X” or “Is there a way to do Y more simply/more efficiently/automate it?”. That then leads to portions which I can decide to implement, or not. But it feels a lot better to have those on hand, even if I choose not to take a project on, rather than to feel overwhelmed and out of control and uncertain about what AI can do (or not).

Facing uncertainty with AI and rethinking "What if you could?", a blog post by Dana M. Lewis on DIYPS.orgIf you can shift your mindset from fear and avoidance to curiosity and experimentation, you might discover new skills, solve problems you once thought were impossible, and open up entirely new opportunities.

So, the next time you think, “That’s too hard, I can’t do that,” stop and ask:

“What if I could?”

If you appreciated this post, you might like some of my other posts about AI if you haven’t read them.

How Medical Research Literature Evolves Over Time Like A Game of Telephone

Have you ever searched for or through medical research on a specific topic, only to find different studies saying seemingly contradictory things? Or you find something that doesn’t seem to make sense?

You may experience this, whether you’re a doctor, a researcher, or a patient.

I have found it helpful to consider that medical literature is like a game of telephone, where a fact or statement is passed from one research paper to another, which means that sometimes it is slowly (or quickly!) changing along the way. Sometimes this means an error has been introduced, or replicated.

A Game of Telephone in Research Citations

Imagine a research study from 2016 that makes a statement based on the best available data at the time. Over the next few years, other papers cite that original study, repeating the statement. Some authors might slightly rephrase it, adding their own interpretations. By 2019, newer research has emerged that contradicts the original statement. Some researchers start citing this new, corrected information, while others continue citing the outdated statement because they either haven’t updated their knowledge or are relying on older sources, especially because they see other papers pointing to these older sources and find it easiest to point to them, too. It’s not necessarily made clear that this outdated statement is now known to be incorrect. Sometimes that becomes obvious in the literature and field of study, and sometimes it’s not made explicit that the prior statement is ‘incorrect’. (And if it is incorrect, it doesn’t become known as incorrect until later – at the time it’s made, it’s considered to be correct.) 

By 2022, both the correct and incorrect statements appear in the literature. Eventually, a majority of researchers transition to citing the updated, accurate information—but the outdated statement never fully disappears. A handful of papers continue to reference the original incorrect fact, whether due to oversight, habit (of using older sources and repeating citations for simple statements), or a reluctance to accept new findings.

The gif below illustrates this concept, showing how incorrect and correct statements coexist over time. It also highlights how researchers may rely on citations from previous papers without always checking whether the original information was correct in the first place.

Animated gif illustrating how citations branch off and even if new statements are introduced to the literature, the previous statement can continue to appear over time.

This is not necessarily a criticism of researchers/authors of research publications (of which I am one!), but an acknowledgement of the situation that results from these processes. Once you’ve written a paper and cited a basic fact (let’s imagine you wrote this paper in 2017 and cite the 2016 paper and fact), it’s easy to keep using this citation over time. Imagine it’s 2023 and you’re writing a paper on the same topic area, it’s very easy to drop the same citation from 2016  in for the same basic fact, and you may not think to consider updating the citation or check if the fact is still the fact.

Why This Matters

Over time, a once-accepted “fact” may be corrected or revised, but older statements can still linger in the literature, continuing to influence new research. Understanding how this process works can help you critically evaluate medical research and recognize when a widely accepted statement might actually be outdated—or even incorrect.

If you’re looking into a medical topic, it’s important to pay attention not just to what different studies say, but also when they were published and how their key claims have evolved over time. If you notice a shift in the literature—where newer papers cite a different fact than older ones—it may indicate that scientific understanding has changed.

One useful strategy is to notice how frequently a particular statement appears in the literature over time.

Whenever I have a new diagnosis or a new topic to research on one of my chronic diseases, I find myself doing this.

I go and read a lot of abstracts and research papers about the topic; I generally observe patterns in terms of key things that everyone says, which establishes what the generally understood “facts” are, and also notice what is missing. (Usually, the question I’m asking is not addressed in the literature! But that’s another topic…)

I pay attention to the dates, observing when something is said in papers in the 1990s and whether it’s still being repeated in the 2020s era papers, or if/how it’s changed. In my head, I’m updating “this is what is generally known” and “this doesn’t seem to be answered in the literature (yet)” and “this is something that has changed over time” lists.

Re-Evaluating the Original ‘Fact’

In some cases, it turns out the original statement was never correct to begin with. This can happen when early research is based on small sample sizes, incomplete data, or incorrect assumptions. Sometimes that statement was correct, in context, but taken out of context immediately and this out of context use was never corrected. 

For example, a widely cited statement in medical literature once claimed that chronic pancreatitis is the most common cause of exocrine pancreatic insufficiency (EPI). This claim was repeated across numerous papers, reinforcing it as accepted knowledge. However, a closer examination of population data shows that while chronic pancreatitis is a known co-condition of EPI, it is far less common than diabetes—a condition that affects a much larger population and is also strongly associated with EPI. Despite this, many papers still repeat the outdated claim without checking the original data behind it.

(For a deeper dive into this example, you can read my previous post here. But TL;DR: even 80% of .03% is a smaller number than 10% of 10% of the overall population…so it is not plausible that CP is the biggest cause of EPI/PEI.)

Stay Curious

This realization can be really frustrating, because if you’re trying to do primary research to help you understand a topic or question, how do you know what the truth is? This is peer-reviewed research, but what this shows us is that the process of peer-review and publishing in a journal is not infallible. There can be errors. The process for updating errors can be messy, and it can be hard to clean up the literature over time. This makes it hard for us humans – whether in the role of patient or researcher or clinician – to sort things out.

But beyond a ‘woe is me, this is hard’ moment of frustration, I do find that this perspective of literature as a process of telephone makes me a better reader of the literature and forces me to think more critically about what I’m reading, and take papers in context of the broader landscape of literature and evolving knowledge base. It helps remove the strength I would otherwise be prone to assigning any one paper (and any one ‘fact’ or finding from a single paper), and encourages me to calibrate this against the broader knowledge base and the timeline of this knowledge base.

That can also be hard to deal with personally as a researcher/author, especially someone who tends to work in the gaps, establishing new findings and facts and introducing them to the literature. Some of my work also involves correcting errors in the literature, which I find from my outsider/patient perspective to be obvious because I’ve been able to use fresh eyes and evaluate at a systematic review level/high level view, without being as much in the weeds. That means my work, to disseminate new or corrected knowledge, is even more challenging. It’s also challenging personally as a patient, when I “just” want answers and for everything to already be studied, vetted, published, and widely known by everyone (including me and my clinician team).

But it’s usually not, and that’s just something I – and we – have to deal with. I’m curious as to whether we will eventually develop tools with AI to address this. Perhaps a mini systematic review tool that scrapes the literature and includes an analysis of how things have changed over time. This is done in systematic review or narrative reviews of the literature, when you read those types of papers, but those papers are based on researcher interests (and time and funding), and I often have so many questions that don’t have systematic reviews/narrative reviews covering them. Some I turn into papers myself (such as my paper on systematically reviewing the dosing guidelines and research on pancreatic enzyme replacement therapy for people with exocrine pancreatic insufficiency, known as EPI or PEI, or a systematic review on the prevalence of EPI in the general population or a systematic review on the prevalence of EPI in people with diabetes (Type 1 and Type 2)), but sometimes it’s just a personal question and it would be great to have a tool to help facilitate the process of seeing how information has changed over time. Maybe someone will eventually build that tool, or it’ll go on my list of things I might want to build, and I’ll build it myself like I have done with other types of research tools in the past, both without and with AI assistance. We’ll see!

TL;DR: be cognizant of the fact that medical literature changes over time, and keep this in mind when reading a single paper. Sometimes there are competing “facts” or beliefs or statements in the literature, and sometimes you can identify how it evolves over time, so that you can better assess the accuracy of research findings and avoid relying on outdated or incorrect information.

Whether you’re a researcher, a clinician, or a patient doing research for yourself, this awareness can help you better navigate the scientific literature.

A screenshot from the animated gif showing how citation strings happen in the literature, branching off over time but often still resulting in a repetition of a fact that is later considered to be incorrect, thus both the correct and incorrect fact occur in the literature at the same time.

The prompt matters when using Large Language Models (LLMs) and AI in healthcare

I see more and more research papers coming out these days about different uses of large language models (LLMs, a type of AI) in healthcare. There are papers evaluating it for supporting clinicians in decision-making, aiding in note-taking and improving clinical documentation, and enhancing patient education. But I see a wide-sweeping trend in the titles and conclusions of these papers, exacerbated by media headlines, making sweeping claims about the performance of one model versus another. I challenge everyone to pause and consider a critical fact that is less obvious: the prompt matters just as much as the model.

As an example of this, I will link to a recent pre-print of a research article I worked on with Liz Salmi (published article here pre-print here).

Liz nerd-sniped me about an idea of a study to have a patient and a neuro-oncologist evaluate LLM responses related to patient-generated queries about a chart note (or visit note or open note or clinical note, however you want to call it). I say nerd-sniped because I got very interested in designing the methods of the study, including making sure we used the APIs to model these ‘chat’ sessions so that the prompts were not influenced by custom instructions, ‘memory’ features within the account or chat sessions, etc. I also wanted to test something I’ve observed anecdotally from personal LLM use across other topics, which is that with 2024-era models the prompt matters a lot for what type of output you get. So that’s the study we designed, and wrote with Jennifer Clarke, Zhiyong Dong, Rudy Fischmann, Emily McIntosh, Chethan Sarabu, and Catherine (Cait) DesRoches, and I encourage you to check out the article here pre-print and enjoy the methods section, which is critical for understanding the point I’m trying to make here. 

In this study, the data showed that when LLM outputs were evaluated for a healthcare task, the results varied significantly depending not just on the model but also on how the task was presented (the prompt). Specifically, persona-based prompts—designed to reflect the perspectives of different end users like clinicians and patients—yielded better results, as independently graded by both an oncologist and a patient.

The Myth of the “Best Model for the Job”

Many research papers conclude with simplified takeaways: Model A is better than Model B for healthcare tasks. While performance benchmarking is important, this approach often oversimplifies reality. Healthcare tasks are rarely monolithic. There’s a difference between summarizing patient education materials, drafting clinical notes, or assisting with complex differential diagnosis tasks.

But even within a single task, the way you frame the prompt makes a profound difference.

Consider these three prompts for the same task:

  • “Explain the treatment options for early-stage breast cancer.”
  • “You’re an oncologist. Explain the treatment options for early-stage breast cancer.”
  • “You’re an oncologist. Explain the treatment options for early-stage breast cancer as you would to a newly diagnosed patient with no medical background.”

The second and third prompt likely result in a more accessible and tailored response. If a study only tests general prompts (e.g. prompt one), it may fail to capture how much more effective an LLM can be with task-specific guidance.

Why Prompting Matters in Healthcare Tasks

Prompting shapes how the model interprets the task and generates its output. Here’s why it matters:

  • Precision and Clarity: A vague prompt may yield vague results. A precise prompt clarifies the goal and the speaker (e.g. in prompt 2), and also often the audience (e.g. in prompt 3).
  • Task Alignment: Complex medical topics often require different approaches depending on the user—whether it’s a clinician, a patient, or a researcher.
  • Bias and Quality Control: Poorly constructed prompts can inadvertently introduce biases

Selecting a Model for a Task? Test Multiple Prompts

When evaluating LLMs for healthcare tasks—or applying insights from a research paper—consider these principles:

  1. Prompt Variation Matters: If an LLM fails on a task, it may not be the model’s fault. Try adjusting your prompts before concluding the model is ineffective, and avoid broad sweeping claims about a field or topic that aren’t supported by the test you are running.
  2. Multiple Dimensions of Performance: Look beyond binary “good” vs. “bad” evaluations. Consider dimensions like readability, clinical accuracy, and alignment with user needs, as an example when thinking about performance in healthcare. In our paper, we saw some cases where a patient and provider overlapped in ratings, and other places where the ratings were different.
  3. Reproducibility and Transparency: If a study doesn’t disclose how prompts were designed or varied, its conclusions may lack context. Reproducibility in AI studies depends not just on the model, but on the interaction between the task, model, and prompt design. You should be looking for these kinds of details when reading or peer reviewing papers. Take results and conclusions with a grain of salt if these methods are not detailed in the paper.
  4. Involve Stakeholders in Evaluation: As shown in the preprint mentioned earlier, involving both clinical experts and patients in evaluating LLM outputs adds critical perspectives often missing in standard evaluations, especially as we evolve to focus research on supporting patient needs and not simply focusing on clinician and healthcare system usage of AI.

What This Means for Healthcare Providers, Researchers, and Patients

  • For healthcare providers, understand that the way you frame a question can improve the usefulness of AI tools in practice. A carefully constructed prompt, adding a persona or requesting information for a specific audience, can change the output.
  • For researchers, especially those developing or evaluating AI models, it’s essential to test prompts across different task types and end-user needs. Transparent reporting on prompt strategies strengthens the reliability of your findings.
  • For patients, recognizing that AI-generated health information is shaped by both the model and the prompt. This can support critical thinking when interpreting AI-driven health advice. Remember that LLMs can be biased, but so too can be humans in healthcare. The same approach for assessing bias and evaluating experiences in healthcare should be used for LLM output as well as human output. Everyone (humans) and everything (LLMs) are capable of bias or errors in healthcare.

Prompts matter, so consider model type as well as the prompt as a factor in assessing LLMs in healthcare. Blog by Dana M. LewisTLDR: Instead of asking “Which model is best?”, a better question might be:

“How do we design and evaluate prompts that lead to the most reliable, useful results for this specific task and audience?”

I’ve observed, and this study adds evidence, that prompt interaction with the model matters.

Best practices in communication related to writing a journal article and sharing it with co-authors

I’ve been a single author, a lead author, a co-author, a corresponding author, AND a last author. Basically, I have written a lot of journal articles myself, solo / single, and with other people. One area in this process that I observe frequently gets overlooked is what happens during and after the submission process, as it relates to communicating about the article itself.

I’m not talking about disseminating the article to your target audience or the public, either (although that is important as well). I’m talking about making sure all authors know the article has been accepted; when it is live; have access to a copy of the article (!); etc.

Most people don’t know that by default, not all journals give all authors access to their own articles for free.

Here are some tips about the process of submitting and saving published articles that will help all authors – even solo authors – in the future.

Basically, help you help your future self! (As well as help your co-authors).

Journals typically only notify the lead/corresponding/submitting author about where the manuscript is in terms of revision, acceptance, and publication. That puts the responsibility on the lead/corresponding/submitting author to notify the full team of authors of where the article is in the process. Similarly, some journals will send a PDF/final copy of the proofed, final, version of record article to the lead author (not always, but usually), but that often does not go out to the full author team by default.

This means that it is the lead author’s responsibility to forward the copy of the final, PDF, proofed article to the entire authorship team so everyone has a copy.

(No, most of the time authors do not have free access to the journal they are submitting to. No, most authors do not have budget to make articles open access and free to all, which means unless they manage to snag and save this PDF article when it is sent to them at the time of publication, in the future, they may not have access to their very own article! Just because you, as the lead/corresponding author do have access, this does not mean everyone on your article team will.

I’m a good example of someone who authors frequently but is not at an institution and has zero access to any paywalled journals. If I’m not given a copy of my articles at the time of publication, I have to phone-a-friend (thanks, Liz Salmi, for being the go-to for me here) to help pull articles. There are things like S c i H u b, but they more often than not do not have super recent, fresh off the press articles. So yes, people like me exist on your authorship teams.)

Best practices for authors include:

  • Once you submit a manuscript, mark your file name (somehow) with “Submitted”. This way you know this is the version that was submitted. This is a useful step related to the below, we’ll come back to why we may want to use only the ‘submitted’ version.

    Example: “JournalAcronym-Article-Blah-Blah-SUBMITTED.docx”.

    Even as the non-lead author, when co-writing articles, as any type of author I prefer to have access to this submitted version. This way, I can see all incorporated edits and the ‘final’ version we submitted. There’s also cases where, see below, I need this for sharing it with other people.

  • Usually, the article goes through peer review and you get comments, so you make revisions and re-submit your article. Again, once submitted, make sure you’ve marked this as ‘revision’ somehow (usually people do) and that is was submitted.

    Example: “JournalAcronym-Article-Blah-Blah-SUBMITTED-R1.docx”.

    Again, best practice would be to send out this re-submitted revision version to all authors so everyone has it.

  • You may end up with multiple rounds of revisions and peer review (moving to R2, etc), or you may get an acceptance notice. Your article will then move to copyediting stage and you get proofs. It’s useful to save these for your own purpose, such as making sure that the edits you make are actually executed in the final article. This is less important for dissemination, though, although I do recommend giving all co-authors the ability to edit/review/proof and request changes.
  • Accepted, proofed, published! THIS is the step that I see most people miss, so pay attention.If you are the lead or solo author, you will probably get an email saying your article is now online, either online first or published. You may get an attachment PDF of your article. If not, you should be able to click on your access link and go to access the article online.

    IMPORTANT STEP HERE: go ahead and download the PDF of the article then. Right then, go ahead and save it.

    Example: “JournalAcronym-Article-Blah-Blah-Year.PDF”.

    (Why do you care about this if you are a solo author? Because the link may expire and you may lose access to this article. More on sharing your article below.)

  • Email your entire author team (if you’re not a solo author). Tell them the article was published; provide a link and/or the DOI link; and attach the PDF to the email so everyone on the team has a copy of the final article. Not all of your co-authors will work at an institution that has unlimited library access; if they do, that might change in the future. Give everyone a copy of the article to save for themselves.You can also remind everyone what the sharing permissions (or limitations) are for the article.

    For example, some articles are paywalled but authors have permission to store the final copy (PDF of the final version) on their own repository or not-for-profit website. For an example, see my research page of DIYPS.org/research – you’ll notice how sometimes I link to an “author copy” PDF, which is what this is – the final article PDF like you would get by accessing the paywalled journal.

    Other times, though, you are specifically not permitted to share the final/proofed/formatted copy. Instead, you’ll be allowed to share the “submitted” manuscript (usually prior to the revision stage). Remember how step 1 that I told you was to save a SUBMITTED copy? This is why! You can PDF this up; add a note to the top that references the final version of record (usually, journals give you recommended language for this) and a link/DOI link to it, and share away on your own site. Again, look at DIYPS.org/research and you’ll notice some of my “author copy” versions are these submitted versions rather than the final versions.

    You’ll also notice that sometimes I link to articles that are open access and then also have a link to a PDF author copy. This is in case something changes in the future with open access links breaking, the journal changing, etc. I have actually had free non-paywalled articles get turned into paywalled journal articles years later, which is why I do point to both places (the open access version and a back up author copy).

    Regardless of what the permissions are for sharing on your own website/repository/institutional repository: you as the author always have permission to give this PDF out when you are asked directly. For example, someone emails you and asks for a copy: you can email back and attach the PDF! This is true even if the permissioning for your own website is the submitted version (not the final version), you can still hand out the final, formatted, pretty PDF version when asked directly.

    As a related tip, this is a great way to disseminate your research and build relationships, so if someone does email you and ask for an author copy…please reply and send them a copy. (Saying this as someone without access to articles who sends requests to many authors to get access to their research, and I only get responses from 50% of authors. Sad panda.) Again, this is why it is helpful to get in the habit of saving your articles as you submit and have them published; it makes it easy to jump into the “Published copy” folder (or however you name it) and attach the PDF to the email and send it.

To recap, as a best practice, you should disseminate various versions of articles to your entire co-author team at the following points in time:

  • Original submission.

    Suggestion: Write an email, say you’ve successfully submitted, remind everyone which journal this was submitted to, and attached a copy of your “JournalAcronym-Article-Blah-Blah-SUBMITTED.docx”(If you end up getting a desk rejection, and you are re-submitting elsewhere, it is also nice to email co-authors and tell them so. You don’t necessarily need to send out a newly retitled version, unless there’s new changes to the submission, such as if you did go through a partial round of peer review before getting rejected and you are submitting the revised version to the new target journal.)

  • Revision submission.

    Suggestion: Write an email, say you’ve successfully submitted the revisions, remind everyone which journal this was submitted to, and attached a copy of your “JournalAcronym-Article-Blah-Blah-SUBMITTED-R1.docx” and the reviewer response document so everyone can see how edits/feedback were incorporated (or not).

  • Acceptance.

    Suggestion:

    A) Forward the email if it has the PDF attached to your full author team. Say congratulations; the article was accepted; and point out the article is attached as PDF.

    B) If you don’t have a PDF attachment in your email already, go to the online access link the journal gave you and save a copy of the PDF. Then, email the author team with the FYI that the article is live; provide the link to the online version; and attach the PDF directly to that email so everyone has a final version.

    Regardless of A or B, remind everyone what the permissions are for sharing to their own/institution repository (eg final PDF or use the submitted version, which you previously shared or could also re-share here).

Bonus tip:

Depending on the content of your article, you may also want to think about sending copies of the final PDF article to certain people who are not co-authors with you.

For example, if you are heavily citing someone’s work or talking about their work in a constructive way – you could email them and give them a heads up and provide a copy of the article. It’s a great way to contribute to your relationship (if you have an existing relationship) and/or foster a relationship. Remember that many people will have Google Scholar Alerts or similar with their name and/or citation alerts from various services, so people are likely to see when you talk about them or their work or are heavily citing their work. Again, some of those people may not have access to your article and may reach out to ask for an article; you can (and should) send them a copy! (And again, consider thinking about it as a relationship building opportunity rather than a transactional thing related to this single article.)

I would particularly flag this as something to pay attention to and do if you are someone working in the space of patient engagement in healthcare. For example, if you write an article and mention them or their body of work by name, it would be courteous to email them, let them know about the article, and send them a PDF.

Otherwise, I can speak from the experience of being talked about as a patient like I’m an ant under the microscope where someone cites an article where my work is mentioned; talks about me by name and references my perspective; and I get a notification about this article….but I can’t access it because it’s in a paywalled journal. Awkward, and a little weird in some cases when the very subject of the article(s) are about patient engagement and involving patients in research. Remember, research involvement should include all stages from design, planning, doing the research, and then disseminating the research. So this meta point is that if there is scholarly literature of any kind (whether original research articles or reviews, commentaries, letters in response to other articles, etc) talking about specific patients and their bodies of work – best practice should be to email them and send a copy of the article. Again, think less transactional and more about relationships – it will likely give you benefit in the long run! Plus, less awkward, a short-term benefit.

—-

best practices for communicating with co-authors about published articles, by Dana M. Lewis from DIYPS.orgAs an example for how I like to disseminate my articles personally, every time a journal article is published and I have access to it, I updated DIYPS.org/research with the title, journal, a DOI link (to help people find it online and/or cite it), and a link to the open access version if available and if not, an author copy PDF of the final or submitted version. So, if you’re ever looking for any of my articles, you can head there (DIYPS.org/research) first and grab copies any time!

If you are looking for a particular article and can’t find it or it’s not listed there yet (e.g. likely because it just came out and I haven’t been sent my own copy by my co-authors yet…), you can always email me directly (Dana@OpenAPS.org) and I’m more than happy to send you a copy of whatever version I have available and/or the final PDF once I have access to it.

Assessing the Impact of Diabetes on Gastrointestinal Symptom Severity in Exocrine Pancreatic Insufficiency (EPI/PEI): A Diabetes Subgroup Analysis of EPI/PEI-SS Scores – Poster at #ADA2024

Last year, I recognized that there was a need to improve the documentation of symptoms of exocrine pancreatic insufficiency (known as EPI or PEI). There is no standardized way to discuss symptoms with doctors, and this influences whether or not people get the right amount of enzymes (pancreatic enzyme replacement therapy; PERT) to treat EPI and eliminate symptoms completely. It can be done, but like insulin, it requires matching PERT to the amount of food you’re consuming. I also began observing that EPI is underscreened and underdiagnosed, whether that’s in the general population or in people with diabetes. I thought that if we could create a list of common EPI symptoms and a standardized scale to rate them, this might help address some of these challenges.

I developed this scale to address these needs. It is called the “Exocrine Pancreatic Insufficiency Symptom Score” or “EPI/PEI-SS” for short.

I had a handful of people with and without EPI help me test the scale last year, and then I opened up a survey to the entire world and asked people to share their experiences with GI-related symptoms. I specifically sought people with EPI diagnoses as well as people who don’t have EPI, so that we could compare the symptom burden and experiences to people without EPI. (Thank you to everyone who contributed their data to this survey!)

After the first three weeks, I started analyzing the first set of data. While doing that, I realized that (both because of my network of people with diabetes and because I also posted in at least one diabetes-specific group), I had a large sub-group of people with diabetes who had contributed to the survey, and I was able to do a full subgroup analyses to assess whether having diabetes seemed to correlate with a different symptom experience of EPI or not.

Here’s what I found, and what my poster is about (you can view my poster as a PDF here), presented at ADA Scientific Sessions 2024 (#ADA2024):

1985-LB at #ADA2024, “Assessing the Impact of Diabetes on Gastrointestinal Symptom Severity in Exocrine Pancreatic Insufficiency (EPI/PEI): A Diabetes Subgroup Analysis of EPI/PEI-SS Scores”

Exocrine pancreatic insufficiency has a high symptom burden and is present in as many as 3 of 10 people with diabetes. (See my systematic review from last year here). To help improve conversations about symptoms of EPI, which can then be used to improve screening, diagnosis, and treatment success with EPI, I created the Exocrine Pancreatic Insufficiency Symptom Score (EPI/PEI-SS), which consists of 15 individual symptoms that people separately rate the frequency (0-5) and severity (0-3) for which they experience those symptoms, if at all. The frequency and severity get multiplied for an individual symptom score (0-15 possible) and these get added up for a total EPI/PEI-SS score (0-225 possible, because 15 symptoms times 15 possible points per symptom is 225).

I conducted a real-world study of the EPI/PEI-SS in the general population to assess the gastrointestinal symptom burden in individuals with (n=155) and without (n=169) EPI. Because there was a large cohort of PWD within these groups, I separately analyzed them to evaluate whether diabetes contributes to a difference in EPI/PEI-SS score.

Methods:

I calculated EPI/PEI-SS scores for all survey participants. Previously, I had analyzed the differences of people with and without EPI overall. For this sub-analysis, I analyzed and compared between PWD (n=118 total), with EPI (T1D: n=14; T2D: n=20) or without EPI (T1D: n=78; T2D: n=6), and people without diabetes (n=206 total) with and without EPI.

I also looked at sub-groups within the non-EPI cohorts and broke them into two groups to see whether other GI conditions contributed to a higher EPI/PEI-SS score and whether we could distinguish EPI from other GI and non-GI conditions.

Results:

People with EPI have a much higher symptom burden than people without EPI. This can be assessed by looking at the statistically significant higher mean EPI/PEI-SS score as well as the average number of symptoms; the average severity score of individual symptoms; and the average frequency score of individual symptoms.

This remains true irrespective of diabetes. In other words, diabetes does not appear to influence any of these metrics.

People with diabetes with EPI had statistically significant higher mean EPI/PEI-SS scores (102.62 out of 225, SD: 52.46) than did people with diabetes without EPI (33.64, SD: 30.38), irrespective of presence of other GI conditions (all group comparisons p<0.001). As you can see below, that is the same pattern we see in people without diabetes. And the stats confirm what you can see: there is no significant difference overall or in any of the subgroups between people with and without diabetes.

Box plot showing EPI/PEI-SS scores for people with and without diabetes, and with and without EPI or other GI conditions. The scores are higher in people with EPI regardless of whether they have diabetes. The plot makes it clear that the scores are distinct between the groups with and without EPI, even when the people without EPI have other GI conditions. This suggests the EPI/PEI-SS can be useful in distinguishing between EPI and other conditions that may cause GI symptoms, and that the EPI/PEI-SS could be a useful screening tool to help identify people who need screening for EPI.

T1D and T2D subgroups were similar
(but because the T2D cohort is small, I did not break them out separately in this graph).

For example, people with diabetes with EPI had an average of 12.59 (out of 15) symptoms, with an average frequency score of 3.06 and average severity score of 1.79, and an average individual symptom score of 5.48. This is a pretty clear contrast to people with diabetes without EPI who had had an average of 7.36 symptoms, with an average frequency score of 1.4 and average severity score of 0.8, and an average individual symptom score of 1.12. All comparisons are statistically significant (p<0.001).

A table comparing the average number of symptoms, frequency, severity, and individual symptom scores between people with diabetes with and without exocrine pancreatic insufficiency (EPI). People with EPI have more symptoms and higher frequency and severity than without EPI: regardless of diabetes.

Conclusion 

  • EPI has a high symptom burden, irrespective of diabetes.
  • High scores using the EPI/PEI-SS among people with diabetes can distinguish between EPI and other GI conditions.
  • The EPI/PEI-SS should be further studied as a possible screening method for EPI and assessed as a tool to aid people with EPI in tracking changes to EPI symptoms over time based on PERT titration.

What does this mean if you are a healthcare provider? What actionable information does this give you?

If you’re a healthcare provider, you should be aware that people with diabetes may be more likely to have EPI – rather than celiac or gastroparesis (source) – if they mention having GI symptoms. This means you should incorporate fecal elastase screening into your care plans to help further evaluate GI-related symptoms.

If you want to further improve your pre-test probability of the elastase testing, you can use the EPI/PEI-SS with your patients to assess the severity and frequency of their GI-related symptoms. I will explain the cutoff and AUC numbers we calculated, but first understand the caveat that these were calculated in the initial real-world study that included people with EPI who are already treating with PERT; thus these numbers might change a little when we repeat this study and evaluate it in people with untreated EPI. (However, I actually predict the mean score to go up in an undiagnosed population, because scores should go down with treatment.) But that different population study may change these exact cutoff and sensitivity specificity numbers, which is why I’m giving this caveat. That being said: the AUC was 0.85 which means a higher EPI/PEI-SS is pretty good for differentiating between EPI and not having EPI. (In the diabetes sub-population specifically, I calculated a suggested cutoff of 59 (out of 225) with a sensitivity of 0.81 and specificity of 0.75. This means we estimate that if people are bringing up GI symptoms to you and you have them take the EPI/PEI-SS and their score is greater than or equal to 59, you would expect that out of 100 people that 81 with EPI would be identified (and 75 of 100 people without EPI would also correctly be identified via scores lower than 59). That doesn’t mean that people with EPI can’t have a lower score; or that people with a higher score do have EPI; but it does mean that the chances of having fecal elastase <=200 ug/g is a lot more likely in those with higher EPI/PEI-SS scores.

In addition to the cutoff score, there is a notable difference in people with diabetes and EPI compared to people with diabetes without EPI in their top individual symptom scores (representing symptom burden based on frequency and severity). For example, the top 3 symptoms of those with EPI and diabetes include avoiding certain food/groups; urgent bowel movements; and avoiding eating large meals. People without EPI and diabetes also score “Avoid certain food/groups” as their top score, but the score is markedly different: the mean score of 8.94 for people with EPI as compared to 3.49 for people without EPI. In fact, the mean score on the lowest individual symptom is higher for people with EPI than the highest individual symptom score for people without EPI.

QR code for EPI/PEI-SS - takes you to https://bit.ly/EPI-PEI-SS-Web
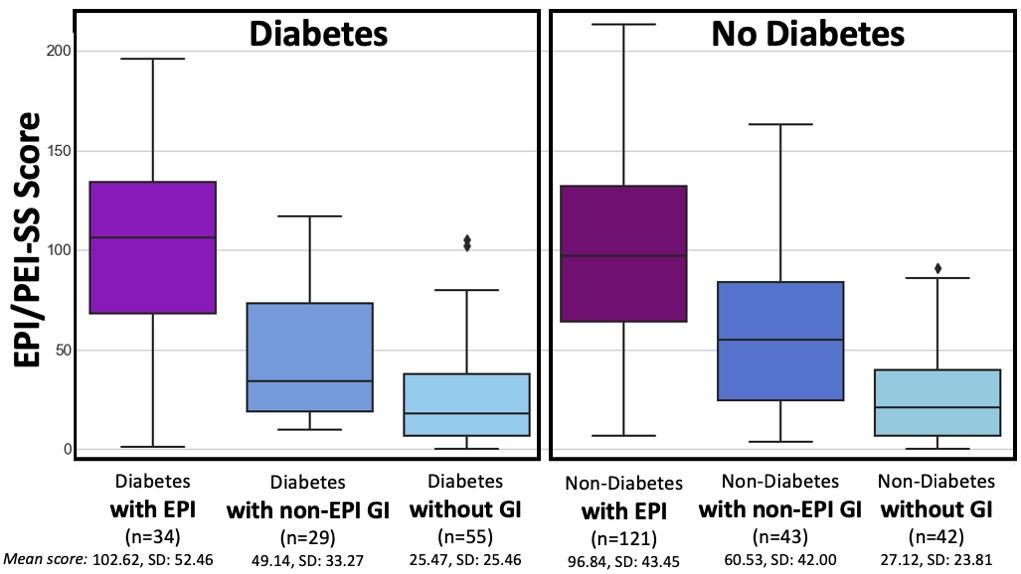
How do you have people take the EPI/PEI-SS? You can pull this link up (https://bit.ly/EPI-PEI-SS-Web), give this link to them and ask them to take it on their phone, or save this QR code and give it to them to take later. The link (and the QR code) go to a free web-based version of the EPI/PEI-SS that will calculate the total EPI/PEI-SS score, and you can use it for shared decision making processes about whether this person would benefit from a fecal elastase test or other follow up screening for EPI. Note that the EPI/PEI-SS does not collect any identifiable information and is fully anonymous.

(Bonus: people who use this tool can opt to contribute their anonymized symptom and score data for an ongoing observational study.)

If you have feedback about whether the EPI/PEI-SS was helpful – or not – in your care of people with diabetes; or if you want to discuss collaborating on some prospective studies to evaluate EPI/PEI-SS in comparison to fecal elastase screening, please reach out anytime to Dana@OpenAPS.org

What does this mean if you are a patient (person with diabetes)? What actionable information does this give you?

If you don’t have GI symptoms that bother you, you don’t necessarily need to take action. (Just put a note in your brain that EPI is more likely than celiac or gastroparesis in people with diabetes so if you or a friend with diabetes have GI symptoms in the future, you can make sure you are assessed for EPI.) You can also choose to take the EPI/PEI-SS regardless, and also opt in to donate your data.

If you do have GI symptoms that are annoying, you may want to take the EPI/PEI-SS to help you evaluate the frequency and severity of your GI symptoms. You can take it for free and anonymously – no identifiable information is needed to access the tool. It will generate the EPI/PEI-SS score for you.

Based on the score, you may want to ask your doctor (which could be the doctor that treats your diabetes, or a primary/general care provider, or a gastroenterologist – whoever you seek routine care from or have an appointment from next) about your symptoms; share the EPI/PEI-SS score; and explain that you think you may warrant screening for EPI.

(You can also choose to contribute your anonymous symptom data to a research dataset, to help us improve the EPI/PEI-SS and help us figure out how to help improve screening and diagnosis and treatment of EPI. Remember, this tool will not ask you for any identifying information. This is 100% optional and you can opt out of doing so if you do not prefer to contribute to research, while still using the tool.)

You can see a pre-print version of the diabetes sub-study here or pre-print of the general population data here.

If you’re looking for more personal experiences about living with EPI, check out DIYPS.org/EPI, and also for people with EPI looking to improve their dosing with pancreatic enzyme replacement therapy – you may want to check out PERT Pilot (a free iOS app to record enzyme dosing, also available for free for Android).

Researchers & clinicians, if you’re interested in collaborating on studies in EPI (in diabetes, or more broadly on EPI), whether specifically on EPI/PEI-SS or broader EPI topics, please reach out! My email is Dana@OpenAPS.org

New Systematic Review Showing General Population Prevalence of Exocrine Pancreatic Insufficiency Is Higher Than In Co-Conditions

For those unfamiliar with academic/medical journal publishing, it is slow. Very slow. I did a systematic review on EPI prevalence and submitted it to a journal on May 5, 2023. It underwent peer review and a round of revisions and was accepted on July 13, 2023. (That part is actually relatively quick.) However, it sat, and sat, and sat, and sat, and sat. I was impatient and wrote a blog post last year about the basic premise of the review, which is that despite commonly repeated statements about the prevalence of EPI being so high in co-conditions that those conditions therefore are the highest drivers of EPI… this unlikely to be true because it is mathematically improbable.

And then this paper still sat several more months until it was published online ahead of print…today! Wahoo! You can read “An Updated Review of Exocrine Pancreatic Insufficiency Prevalence finds EPI to be More Common in General Population than Rates of Co-Conditions in the Journal of Gastrointestinal and Liver Diseases ahead of print (scheduled for the March 2024 issue).

It’s open access (and I didn’t have to pay for it to be!), so click here to go read it and download your own PDF copy of the article there. (As a reminder, I also save a version of every article including those that are not open access at DIYPS.org/research, in case you’re looking for this in the future or want to read some of my other research.) If you don’t want to read the full article, here’s a summary below and key takeaways for providers and patients (aka people like me with EPI!).

I read and systematically categorized 649 articles related to exocrine pancreatic insufficiency, which is known as EPI or PEI depending on where in the world you are. EPI occurs when the pancreas no longer produces enough enzymes to successfully digest food completely; when this occurs, pancreatic enzyme replacement therapy (PERT) is needed. This means swallowing enzyme pills every time you eat or drink something with fat or protein in it.

Like many of my other EPI-related research articles, this one found that EPI is underdiagnosed; undertreated; treatment costs are high; and prevalence is widely misunderstood, possibly leading to missing screening key populations.

  • Underdiagnosis – for a clearer picture and specific disease-related example of how EPI is likely underdiagnosed in a co-condition, check out my other systematic review specifically assessing EPI in diabetes. I show in that paper how EPI is likely many times more likely than gastroparesis and celiac disease, yet it’s less likely to be screened for.
  • Undertreated – another recent systematic review that I wrote after this paper (but was published sooner) is this systematic review on PERT dosing guidelines and dosing literature, showing how the overwhelming majority of people are not prescribed enough enzymes to meet their needs. Thus, symptoms persist and the literature continues to state that symptoms can’t be managed with PERT, which is not necessarily true: it just hasn’t been studied correctly with sufficient titration protocols.
  • PERT costs are high – I highlight that although PERT costs continue to rise each year, there are studies in different co-condition populations showing PERT treatment is cost-effective and in some cases reduces the overall cost of healthcare. It’s hard to believe when we look at the individual out of pocket costs related to PERT sometimes, but the data more broadly shows that PERT treatment in many populations is cost-effective.
  • Prevalence of EPI is misunderstood. This is the bulk of the paper and goes into a lot of detail showing how the general population estimates of EPI may be as high as 11-21%. In contrast, although prevalence of EPI is much higher within co-conditions, these conditions are such a small fraction of the general population that they therefore are also likely a small fraction of the EPI population.

As I wrote in the paper:

“The overall population prevalence of cystic fibrosis, pancreatitis, cancer, and pancreatic-related surgery combined totals <0.1%, and the lower end of the estimated overall population prevalence of EPI is approximately 10%, which suggests less than 1% of the overall incidence of EPI occurs in such rare co-conditions.

We can therefore conclude that 99% of EPI occurs in those without a rare co-condition.”

I also pointed out the mismatch of research prioritization and funding to date in EPI. 56-85% of the EPI-related research is focused on those representing less than ~1% of the overall population with EPI.

So what should you take away from this research?

If you are a healthcare provider:

Make sure you are screening people who present with gastrointestinal symptoms with a fecal elastase test to check for EPI. Weight loss and malnutrition does not always occur with EPI (which is a good thing, meaning it’s caught earlier) and similarly not everyone has diarrhea as their hallmark symptoms. Messy, smelly stools are often commonly described by people with EPI, among other symptoms such as excess gas and bloating,

Remember that conditions like diabetes have a high prevalence of EPI – it’s not just chronic pancreatitis or cystic fibrosis.

If you do have a patient that you are diagnosing or have diagnosed with EPI, make sure you are aware of the current dosing guidelines (see this systematic review) and 1) prescribe a reasonable minimal starting dose; 2) tell the patient when/how they can adjust their PERT on their own and when to call back for an updated prescription as they figure out what they need, and; 3) tell them they will likely need an updated prescription and you are ready to support them when they need to do so.

If you are a person living with EPI:

Most people with EPI are not taking enough enzymes to eliminate their symptoms. Dose timing matters (take it with/throughout meals), and the quantity of PERT matters.

If you’re still having symptoms, you may still need more enzymes.

Don’t compare what you are doing to what other people are taking: it’s not a moral failing to need a different amount of enzymes (or insulin, for that matter, or any other medication) than another person! It also likely varies by what we are eating, and we all eat differently.

If you’re still experiencing symptoms, you may need to experiment with a higher dose. If you still have symptoms or have new symptoms that start after taking PERT, you may need to try a different brand of PERT. Some people do well on one but not another, and there are different kinds you can try – ask your doctor.

How to cite this systematic review:

Lewis D. An Updated Review of Exocrine Pancreatic Insufficiency Prevalence finds EPI to be More Common in General Population than Rates of Co-Conditions. Journal of Gastrointestinal and Liver Diseases. 2024. DOI: 10.15403/jgld-5005

For other posts related to EPI, see DIYPS.org/EPI for more of my personal experiences with EPI and other plain-language research summaries.

For other research articles, see DIYPS.org/research

A systematic review shows EPI prevalence is more common in the general population than in co-conditions

Systematic Review of PERT Research and Guidelines for Exocrine Pancreatic Insufficiency (EPI or PEI)

New Systematic Review And Evaluation of Pancreatic Enzyme Replacement Therapy (PERT) Dosing Guidelines and Research for Exocrine Pancreatic Insufficiency (EPI or PEI)

I wrote a new paper evaluating the research behind pancreatic enzyme replacement therapy (aka, PERT) dosing for people with exocrine pancreatic insufficiency (known as EPI or PEI). I decided to do this research and write this paper because in my previous papers on EPI, I saw a lot of inconsistencies in when PERT was studied, how it was studied, and how that research was then used to develop guidelines.

(Big thanks to Julia Blanchette, Jordan Rieke, Claudia Lewis (no relation), Khaleal Almusaylim , and Anuhya Kanchibhatla for collaborating on this research and co-authoring the paper with me!)

You can find an author copy of the paper here, or see it on the journal website here. As a reminder, all my research papers have author copies and you can find them at DIYPS.org/research! I also have several other EPI-related articles.

A note on methods – this is a systematic review, meaning I used keywords to search multiple electronic databases to find articles about exocrine pancreatic insufficiency. I screened articles to make sure they were about EPI in humans and focused on English-language articles. We then reviewed the title and abstract of 2,530 remaining articles (!) that mentioned EPI, and excluded those that were not focused on EPI or a co-condition and unlikely to include guidelines or specific dose information related to EPI. That left 820 articles, which we then screened again looking for the full text and reviewing them for relevancy. I ended up reading 257 papers that we used for the basis of the research described below!

We found 7 key findings from this body of research:

  1. PERT Titration Protocols Aren’t Very Specific (or useful as typically written)“Most PERT dosing guidelines do not articulate a specific, defined dose range. Instead, PERT is commonly dosed with a general starting dose, such as 50,000 units of lipase per meal and 25,000 units of lipase per snack. If needed, guidelines then recommend increasing (i.e., titrating) the dosage by a factor of two to three (commonly described as increasing by 2x – 3x), and if symptoms persist, adding a proton pump inhibitor (PPI) before exploring other potential diagnoses. As a result, providers are prompted to focus primarily on the starting dose, rather than the full range of recommended doses.”

    I ended up crafting a table (Table 2) for the paper that shows how this dosing process can result in much bigger doses – such as 150,000 units of lipase per meal – to contrast  how prescriptions are often given at very low doses in comparison and often are not sufficient.

    This is a similar version of the table that I had developed for a previous blog post talking about the ranges of PERT dosing:
    Examples of PERT starting doses of 25,000, 40,000, and 50,000 (plus half that for snacks) and what the dose would be if increased according to guidelines to 2x and 3x, plus the sum of the total daily dose needed at those levels.
    Most guidelines, and the underlying studies, do not do a good job describing what doses people actually took in the studies. This may influence then providers’ understanding of how much PERT is needed.

  1. People are not taking enough PERTLike I found in my own previous research, there have been numerous studies showing that people are not getting prescribed enough PERT. This is both based on people reporting ongoing symptoms and reduced quality of life, but also studies that show a huge gap between the doses recommended to start with in guidelines and the fact that >90% of the time, providers don’t prescribe anywhere near this dose (and therefore are not prescribing enough PERT).
  2. Comparing different PERT studies is challengingWhen PERT studies are done, they are typically for safety and efficacy at a specific dose. Very few studies record what dosing people take when they are allowed to take the amount that they need to effectively reduce symptoms.

    As a result, we don’t know how much PERT people need (on average) in order to reduce symptoms.

  3. PERT Dosing Studies and Guidelines Only Focus on Fat (and we need to talk about protein)If you’ve read my previous blog posts about ratios and PERT dosing, you’ll notice I talk about protein dosing. For some people with EPI, protein dosing makes a huge difference in symptom outcomes.

    However, PERT is described based on units of lipase (for fat digestion) and primarily studied for fat, which means that doctors often prescribe it and only talk about changing PERT doses for different sized meals based on fat.

    This is a huge area of need for future studies to determine what role protein malabsorption plays for people with EPI. I suspect, based on personal experience and talking to others in the EPI community about when they have symptoms, this influences a lot of PERT dosing efficacy in real life.

  4. PERT Dosing Guidelines Are Very Different Around The World – But Should They Be?There are dozens of PERT dosing guidelines by condition, and in different parts of the world. They don’t always agree!

    My hypothesis is that this is not because of a true varying need geographically for PERT dosing (meaning your PERT dosing needs aren’t likely different if you live in South America or Europe), but because of the selection of studies used to determine the guidelines. And because most studies have only looked at basic, minimal doses for safety/efficacy, they haven’t studied how much people need to eliminate symptoms. There’s also no data on what people eat in these studies, so the ‘regional’ differences perceived may be a result of different composition of foods, but we have no evidence for this because the studies are poorly described and/or the studies don’t actually record this.

  5. PERT Dosing Guidelines Are Different By Co-Condition The majority of the studies on EPI and PERT dosing are in chronic pancreatitis (CP). As I’ve written previously, this is likely a small fraction of the number of people with EPI. But because this body of research on CP and EPI is so big, it has a very loud voice in determining what the guidelines say about PERT dosing. (Cystic fibrosis (CF) is the second-most studied and also plays the second-biggest role in influencing guidelines).

    If you want to dig in to the differences between conditions, note that the guidelines are influenced by the volume of studies, and so many conditions (such as diabetes) have very few guidelines and very few studies, so most of the ‘guidance’ on dosing is extrapolated from CF and/or chronic pancreatitis. It’s therefore very possible that people with EPI need more dosing or different dosing than is studied in those co-conditions – but we don’t know more because it hasn’t been studied!

    (I have a lot of details in the paper about what has been studied, and you can look at Table 4 for a summary of some of the less-studied conditions or check out the appendix for a narrative description of all of the co-conditions and their bodies of research.)

  6. PERT Dosing Is Determined By Clinicians And They’re Not Following The GuidelinesMost doctors and clinicians are not following PERT guidelines. This means that many people are prescribed a too-low dose of PERT according to the guidelines. This could be because providers are unaware of the guidelines; or don’t agree with the guidelines; or have not seen evidence showing clear effects of PERT on symptom resolution (in part because this hasn’t been studied!).

    More work needs to be done to understand why patients with EPI are under-prescribed and under-dosed when prescribed, and understanding barriers for clinicians may be a key factor to study moving forward.

So, what next?

Here’s what I want to see studied next for EPI, based on the findings in this paper:

  1. All PERT studies should clearly document the titration protocol in a way that can be understood and reproduced.
  2. PERT studies should record what dose people take throughout or at the end of the trial.
  3. PERT should be studied for symptom resolution. (PS – take the anonymous EPI symptom survey if you haven’t already!) This should be done outside of conditions such as chronic pancreatitis, because there is pain associated with CP that is confounding the results of EPI symptoms. And, CP is a tiny fraction of EPI and should not therefore be used to determine whether PERT is effective at resolving EPI-related symptoms.
  4. We need more awareness of the prevalence of EPI and for clinicians to screen for EPI. When elastase results are low (e.g. less than or equal to 200-ish), providers should initiate a trial of PERT and aid people in increasing their doses to the point that symptoms resolve. We need to study the barriers/factors determining why providers are not screening for EPI and why they are not prescribing PERT.
  5. We need more tools to help doctors and patients increase PERT dosing to achieve symptom resolution.
  6. We need studies on the effect of protein in the diet of people with EPI and PERT dosing to improve protein digestion.

If clinicians are reading this, here is your call to action:

  • Screen for EPI using a fecal elastase test. This includes anyone presenting with GI symptoms, not just in people that you suspect have chronic pancreatitis. You’re probably missing a not-insignificant number of people coming to you with EPI. For example, a previous systematic review shows EPI is likely much more common in people with diabetes than celiac or gastroparesis!
  • If fecal elastase results are around or below 200, prescribe PERT. Yes, even if they’re close to 200 – PERT can help for those with EPI who have symptoms!

    This study was published after our systematic review, so I wasn’t able to cite it in the paper, but includes evidence that PERT also can help reduce symptoms when elastase is 200-500. Don’t get too hung up on the elastase result, it’s not very precise but that doesn’t mean you shouldn’t prescribe a trial of PERT. 
  • Prescribe PERT at a minimum of 40,000-50,000 units PER MEAL and tell patients specifically to increase dosing as needed, such as when they’re eating larger meals. Many people need much larger doses (evidence here). Give guidance on how to adjust based on meals. If you want tools, consider things like PERT Pilot or other calculators to aid in matching dosing to food intake. This matches the recent AGA Clinical Practice Update on the Epidemiology, Evaluation, and Management of Exocrine Pancreatic Insufficiency (EPI) by Whitcomb et al which emphasizes that “PERT treats the meal, not the pancreas” meaning that PERT should match food intake.The level of elastase does NOT determine the dosing need, and the size of your prescriptions shouldn’t be influenced by the elastase result.

    All EPI needs PERT, and PERT needs should be driven by the individual’s symptoms and the dose it takes to reduce or eliminate their symptoms.

Here’s how to cite this paper:

Lewis DM, Rieke, JG, Almusaylim, K, Kanchibhatla, A, Blanchette, JE, Lewis, C. Exocrine Pancreatic Insufficiency Dosing Guidelines For Pancreatic Enzyme Replacement Therapy Vary Widely Across Disease Types. Digestive Diseases and Sciences. 2023. https://doi.org/10.1007/s10620-023-08184-w