Running a Multi-Day Ultramarathon (Aiming for 200 Miles)

I used to make a lot of statements about things I thought I couldn’t do. I thought I couldn’t run overnight, so I couldn’t attempt to run 100 miles. I could never run 200 mile races the way other people did. Etc. Yet last year I found myself training for and attempting 100 miles (I chose to stop at 82, but successfully ran overnight and for 25 hours) and this year I found myself working through the excessive mental logistics and puzzle of determining that I could train for and attempt to run 200 miles, or as many miles as I could across 3-4 days.

Like my 100 mile attempt, I found some useful blog recaps and race reports of people’s official races they did for 200-ish mile races. However, like the 100 attempts, I found myself wanting more information for the mental training and logistical preparation people put into it. While my 200 mile training and prep anchored heavily on what I did before, this post describes more detail on how my training, prep, and ‘race’ experience for a multi-day or 200 mile ultra attempt.

DIY-ing a 200

For context, I have a previous post describing the myriad reasons of why I often choose to run DIY ultras, meaning I’m not signing up for an official race. Most of those reasons hold true for why I chose to DIY my 200. Like my 100 (82) miles, I mapped a route that was based on my home paved trail that takes me out and around the trails I’m familiar with. It has its downsides, but also the upsides: really good trail bathrooms and I feel safe running them. Plus, it’s easy and convenient for my husband to crew me. Since I expected this adventure to take 3-4 days (more on that below), that’s a heavy ask of my husband’s time and energy, so sticking with the easy routes that work for him is optimal, too. So while I also sought to run 200 miles just like any other 200-mile ultra runner, my course happens to have minimal elevation. Not all 200 mile ultramarathon races have a ton of elevation – some like the Cowboy 200 are pretty flat – so my experience is closer to that than the experience of those running mountain based ultras with 30,000 feet (or more) of elevation gain. And I’m ok with that!

Sleep

One of the puzzles I had to figure out to decide I could even attempt a 200 miler is sleep. With a 100 mile race, most people don’t sleep at all (nor did I) and we just run through the night. With 200 miles, that’s impossible, because it takes 3, 4, 5 days to finish and biologically you need sleep. Plus, I need more sleep than the average person. I’m a champion sleeper; I typically sleep much longer than everyone else; and I know I couldn’t function with an hour here or there like many people do at traditional races. So I actually designed my 200 mile ultra with this in mind: how could I cover 200 miles AND get sleep? Because I’m running to/from home, I have access to my kitchen, shower, and bed, so I decided that I would set up my run to run each day and come home and eat dinner, shower, and sleep each night for a short night in my bed.

I then decided that instead of winging it and running until I dropped before eating, showering, and sleeping, I would aim for running 50 miles each day. Then I’d come in, eat, shower, and sleep and get up the next morning and go again. 4 days, 3 nights, 50 miles each day: that would have me finishing around 87-90ish hours total (with the clock running from my initial start), including ~25 hours or more of total downtime between the eating/showering/sleeping/getting ready. That breakdown of 3.67 days is well within the typical finish times of many 200 mile ultras (yes, comparing to those with elevation gain), so it felt like it was both a stretch for me but also doable and in a sensible way that works for me and my needs. I mapped it all out in my spreadsheet, with the number of laps and my routes and pacing to finish 50 miles per day; the two times per day I would need my husband to come out and crew me at ‘aid station stops’ in between laps, and what time I would finish each night. I then factored in time to eat and shower and get ready for bed, sleep, and time to get up in the morning. Given the fact that I expected to run slower each day, the sleep windows go from 8 hours down to less than 6 hours by night 3. That being said, if I managed to sleep 5 hours per night and 15 hours total, that’s probably almost twice as much as most people get during traditional races!

Like sleep, I was also very cognizant of the fact that a 200 probably comes down to mental fortitude and will power to keep going; meticulous fueling; and excellent foot care. Plus reasonable training, of course.

Meticulous fueling

I have previously written about building and using a spreadsheet to track my fuel intake during ultras. This method works really well for me because after each training run I can see how much I consumed and any trends. I started to spot that as I got tired, I would tend to choose certain snacks that happened to be slightly lower calorie. Not by much, but the snack selections went from those that are 150-180 calories to 120-140 calories, in part because I perceived them to be both ‘smaller’ (less volume) and ‘easier to swallow’ when I was tired. Doubled up in the same hour, this meant that I started to have hours of 240 calories instead of more than 250. That doesn’t sound like much, but I need every calorie I can get.

I mapped out my estimated energy expenditure based on the 50 miles per day, and even consuming 250 calories per hour, I would end up with several thousand calories of deficit each day! I spent a lot of time testing food that I think I can eat for dinner on the 3 nights to ensure that I get a good 1000 calories or more in before going to bed, to help address and reduce the growing energy deficit. But I also ended up optimizing my race fuel, too. Because I ran so many long runs in training where I fueled every 30 minutes, and because I had been mapping out my snack list for each lap for 50 miles a day for 4 days, I’ve been aware for months that I would probably get food fatigue if I didn’t expand my fuel list. I worked really hard to test a bunch of new snacks and add them to the rotation. That really helped even in training, across all 12 laps (3 laps a day to get 50 miles, times 4 days), I carefully made sure I wouldn’t have too many repeats and get sick of one food or one group of things I planned to eat. I also recently realized that some of the smaller items (e.g. 120 calorie servings) could be increased. I’m already portioning out servings from a big bag into small baggies; in some cases adding one more pretzel or one more piece of candy (or more) would drive up the calories by 10-20 per serving. Those small tweaks I made to 5 of my ~18 possible snacks means that I added about 200 calories on top of what was already represented in those snacks. If I happen to choose those 5 snacks as part of my list for any one lap, that means I have a bonus 200 calories I’ve convinced myself to consume without it being a big deal, because it’s simply one more pretzel or one more piece of candy in the snack that I’m already use to consuming. (Again, because I’m DIYing my race and have specific needs relative to running with celiac, diabetes, and exocrine pancreatic insufficiency, for me, pre-planning my fuel and having it laid out in advance for every run, or in the race every single lap, is what works for me personally.)

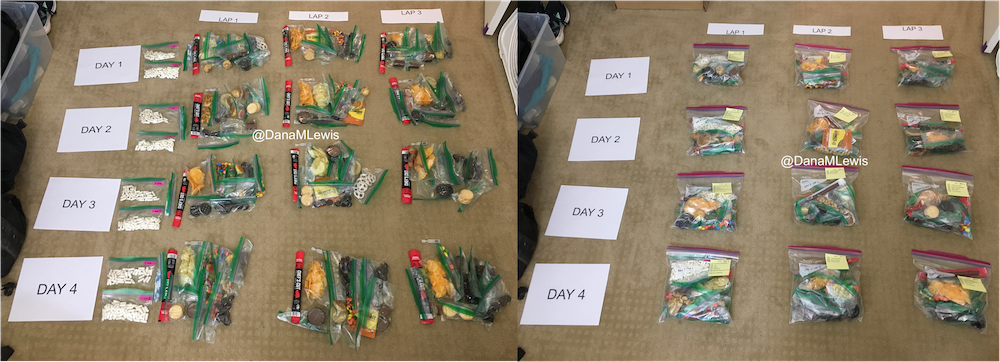
Here’s a view of how I laid out my fuel. I had worked on a list of what I wanted for each lap, checking against repeats across the same day and making sure I wasn’t too heavily relying on any one snack throughout all the days. I then bagged up all snacks individually, then followed my list to lay them out by each lap and day accordingly. I also have a bag per day each for enzymes and electrolytes, which you’ll see on the left. Previously, I’ve done one bag per lap, but to reduce the number of things I’m pulling in and out of my vest each time, I decided I could do one big bag each per day (and that did end up working out well).

Two pictures side by side, with papers on the floor showing left to right laps 1-3 on the top and along the left side days 1-4, to create a grid to lay out my snacks. On the left picture, I have my enzymes, electrolytes per day and then a pile of snacks grouped for each lap. On the right, all the snacks and enzymes and electrolytes have been put into gallon bags, one for each lap.

Contingency planning

Like I did for my 100, I was (clearly) planning for as many possibilities as I could. I knew that during the run – and each evening after the run – I would have limited excess mental capacity for new ideas and brainstorming solutions when problems come up. The more I prepared for things that I knew were likely to happen – fatigue, sore body, blisters, chafing, dropping things, getting tired of eating, etc – the more likely that they would be small things and not big things that can contribute to ending a race attempt. This includes learning from my past 100 attempt and how I dealt with the rain. First of all, I planned to move my race if it looks like we’ll get 6 months of rain in a single 24 hour period! But also, I scheduled my race so that if I do have a few hours of really hard rain, I could choose to take a break and come in and eat/shower/change/rest and go back out later, or extend and finish a lap on the last day or the day after that. I was not running a race that would yank me from the course, but I did have a hard limit after day 5 based on a pre-planned doctor’s appointment that would be a hassle to reschedule, so I needed to finish by the night after day 5. But this gave me the flexibility to take breaks (that I wasn’t really planning to take but was prepared to if I needed to due to weather conditions).

Training for a 200 mile ultramarathon

Like training plans for marathons and 100 milers, the training plans I’ve read about for 200 mile ultramarathons intimidate me. So much mileage! So much time for a slow run/walker like me. I did try to look at sample 200 mile ultra plans and get a sense for what they’re trying to achieve – e.g. when do they peak their mileage before the race, how many back to back runs of what general length in terms of time etc – and then loosely keep that in mind.

But basically, I trained for this 200 mile ultra just like I trained for my marathon, 50k, 100k, and 82 miler. I like to end up doing long runs (which for me are run/walks of 30 seconds run, 60 seconds walk, just like I do shorter runs) of up to around 50k distance. This time, I did two total training runs that were each around 29 miles, just based on the length of the trail I had to run. I could have run longer, but mentally had the confidence that another ~45 minutes per run wasn’t going to change my ability to attempt 50 miles a day for 4 days. If I didn’t have 3 years of this training style under my personal belt, I might feel different about it. That’s longer than many people run, but I find the experience of 7-8 hours of time on my feet fueling, run/walking, and problem solving (including building up my willpower to spend that much time moving) to be what works for me.

The main difference for my 200 is probably also that it’s my 3rd year of ultrarunning. I was able to increase my long runs a little bit more of a time, when historically I used to add 2 miles a time to a long run. I jumped up 4 miles at a time – again, run/walking so very easy on my legs – when building up my long runs, so I was able to end up with 2 different 29 mile runs, two weeks apart, even though I really kicked off training specifically for this 8 weeks prior (10 weeks including taper) to the run. In between I also did a weekend of back to back to back runs (meaning 3 days in a row) where I ran 16 miles, another 16 miles, and 13 miles to practice getting up and running on tired legs. In past cycles I had done a lot more back to back (2-day) with a long and a medium run, but this time I did less of the 2-day and did the one big 3-day since I was targeting a 4-day experience. In future, if I were to do this again, given how well my body held up with all this training, I might have done more back to back, but I took things very cautiously and wanted to not overtrain and cause injury from ramping up too quickly.

As part of that (trying not to over do it), instead of doing several little runs throughout the week I focused on more medium-long runs with my vest and fueling, so I would do something like a long run (starting at 10 miles building up to 29 miles), a medium-long run (8 miles up to 13 miles or 16 miles) and another medium-ish run (usually 8 miles). Three runs a week, and that was it. Earlier in the 8 weeks, I was still doing a lot of hiking off the season, so I had plenty of other time-on-feet experiences. Later in the season I sometimes squeezed in a 4th short run of the week if we wouldn’t be hiking, and ran without my vest and tried to do some ‘speed work’ (aka run a little faster than my easy long run pace). Nothing fancy. Again, this is based on my slow running style (that’s actually a fixed interval of short run and short walk, usually 30 seconds run and 60 seconds walk), my schedule, my personality, and more. If you read this, don’t think my mileage or training style is the answer. But I did want to share what I did and that it generally worked for me.

I did struggle with wondering if I was training “enough”. But I never train “enough” compared to others’ marathon, 50k, 100k, 100 mile plans, either. I’m a low mileage-ish trainer overall, even though I do throw in a few longer runs than most people do. My peak training for marathon, 50k, and 100k is usually around low 50s (miles per week). Surprisingly, this 200 cycle did get me to some mid 60 mile weeks! One thing that also helped me mentally was adding in a rolling 7 day calculation of the miles, not just looking at miles per calendar week. That helped when I shifted some runs around due to scheduling, because I could see that I was still keeping a reasonable 55-low60s mileage over 7 days even though the calendar week total dropped to low 40s because of the way the runs happened to land in the calendar weeks.

Generally, though, looking back at how my training was more than I had accomplished for previous races; I feel better than ever (good fueling really helps!); I didn’t have any accidents or overtraining injuries or niggles; I decided a few weeks before peak that I was training enough and it was the right amount for me.

Another factor that was slightly different was how much hiking I had done this year. I ran my 100k in March then took some time off, promising my husband that we would hike “more” this year. That also coincided with me not really bouncing back from my 100k recovery period: I didn’t feel like doing much running, so we kept planning hiking adventures. Eventually I realized (because I was diagnosed with Graves’ disease last year, I’m having my thyroid and antibody and other related blood work done every 3 months while we work on getting everything into range) that this coincided with my TSH going too high for my body’s happiness; and my disinterest in long runs was actually a symptom (for me) of slightly too-high TSH. I changed my thyroid medication and within two weeks felt HUGELY more interested in long running, which is what coincided with reinvigorating my interest in a fall ultra, training, and ultimately deciding to go for the 200. But in the meantime, we kept hiking a lot – to the tune of over 225 miles hiked and over 53,000 feet of elevation gain! I never tracked elevation gain for hiking before (last year, not sure I retrospectively tracked it all but it was closer to 100 miles – so definitely likely 2x increase), but I can imagine this is definitely >2x above what I’ve done on my previous biggest hiking year, just given the sheer number of hikes that we went out on. So overall, the strengthening of my muscles from hiking helped, as did the time on feet. Before I kicked off my 8 week cycle, we were easily spending 3-4 hours a hike and usually at least two hikes a weekend, so I had a lot of time on feet almost every hike equivalent to 12 or more miles of running at that point. That really helped when I reintroduced long runs and aided my ability to jump my long run in distance by 4 miles at a time instead of more gently progressing it by 2 miles a week as I had done in the past.

How my 200 mile attempt actually went

Spoiler alert: I DNF (did not finish) 200 miles. Instead, I stopped – happily – at 100 miles. But it wasn’t for a lack of training.

Day 1 – 51 miles – All as planned

I set out on lap 1 on Day 1 as planned and on time, starting in the dark with a waist lamp at 6am. It was dark and just faintly cool, but warm enough (51F) that I didn’t bother with long sleeves because I knew I would warm up. (Instead, for all days, I was happy in shorts and a short sleeve shirt when the temps would range from 49F to 76F and back down again.) I only had to run for about an hour in the dark and the sky gradually brightened. It ended up being a cloudy, overcast and nice weather day so it didn’t get super bright first thing, but because it wasn’t wet and cold, it wasn’t annoying at all. I tried to start and stay at an easy pace, and was running slow enough (about ~30s/mile slower than my training paces) that I didn’t have to alter my planned intervals to slow me down any more. All was fairly well and as planned in the first lap. I stopped to use the bathroom at mile 3.5 and as planned at my 8 mile turnaround point, and also stopped to stuff a little more wool in a spot in my shoe a mile later. That added 2 minutes of time, but I didn’t let it bother me and still managed to finish lap 1 at about a 15:08 min/mi average pace, which was definitely faster than I had predicted. I used the bathroom again at the turnaround while my husband re-filled my hydration pack, then I stuffed the next round of snacks in my vest and took off. The bathroom and re-fueling “aid station” stop only took 5 minutes. Not bad! And on I went.

A background-less shot of me in my ultrarunning gear. I'm wearing a grey moisture-wicking visor; sunglasses; a purple ultrarunning vest packed with snacks in front and the blue tube of my hydration pack looped in front; a bright flourescent pink short sleeve shirt; grey shorts with pockets bulging on the side with my phone (left pocket) and skittles and headphones and keys (right pocket), and in this lap I was wearing bright pink shoes. Lap 2 was also pretty reasonable, although I was surprised by how often I wanted a bathroom. My period had started that morning (fun timing), and while I didn’t have a lot of flow, the signals my abdomen was giving my brain was telling me that I needed to go to the bathroom more often than I would have otherwise. That started to stress me out slightly, because I found myself wishing for a bathroom in the longest stretch without trail bathrooms and in a very populated area, the duration of which was about 5.5 miles long. I tried to drink less but was also aware of trying not to under hydrate or imbalance my electrolytes. I always get a little dehydrated during my period; and I was running a multi-day ultra where I needed a lot of hydration and more sodium than usual; this situation didn’t add up well! But I made it without any embarrassing moments on the trail. The second aid station again only took 5 minutes. (It really makes a world of difference to not have to dry off my feet, Desitin them up, and re-do socks and shoes every single aid station like I did last year!) I could have moved faster, but I was trying to not let small minutes of time frazzle me, and I was succeeding with being efficient but not rushed and continuing on my way. I had slowed down some during lap 2, however – dropping from a 15:08 to 15:20ish min/mi pace. Not much, but noticeable.

At sunset, with light blue sky fading to yellow at the horizon behind the row of tall, skinny bush like trees with gaps and a hot air balloon a hundred or so feet off the ground seen between the trees.
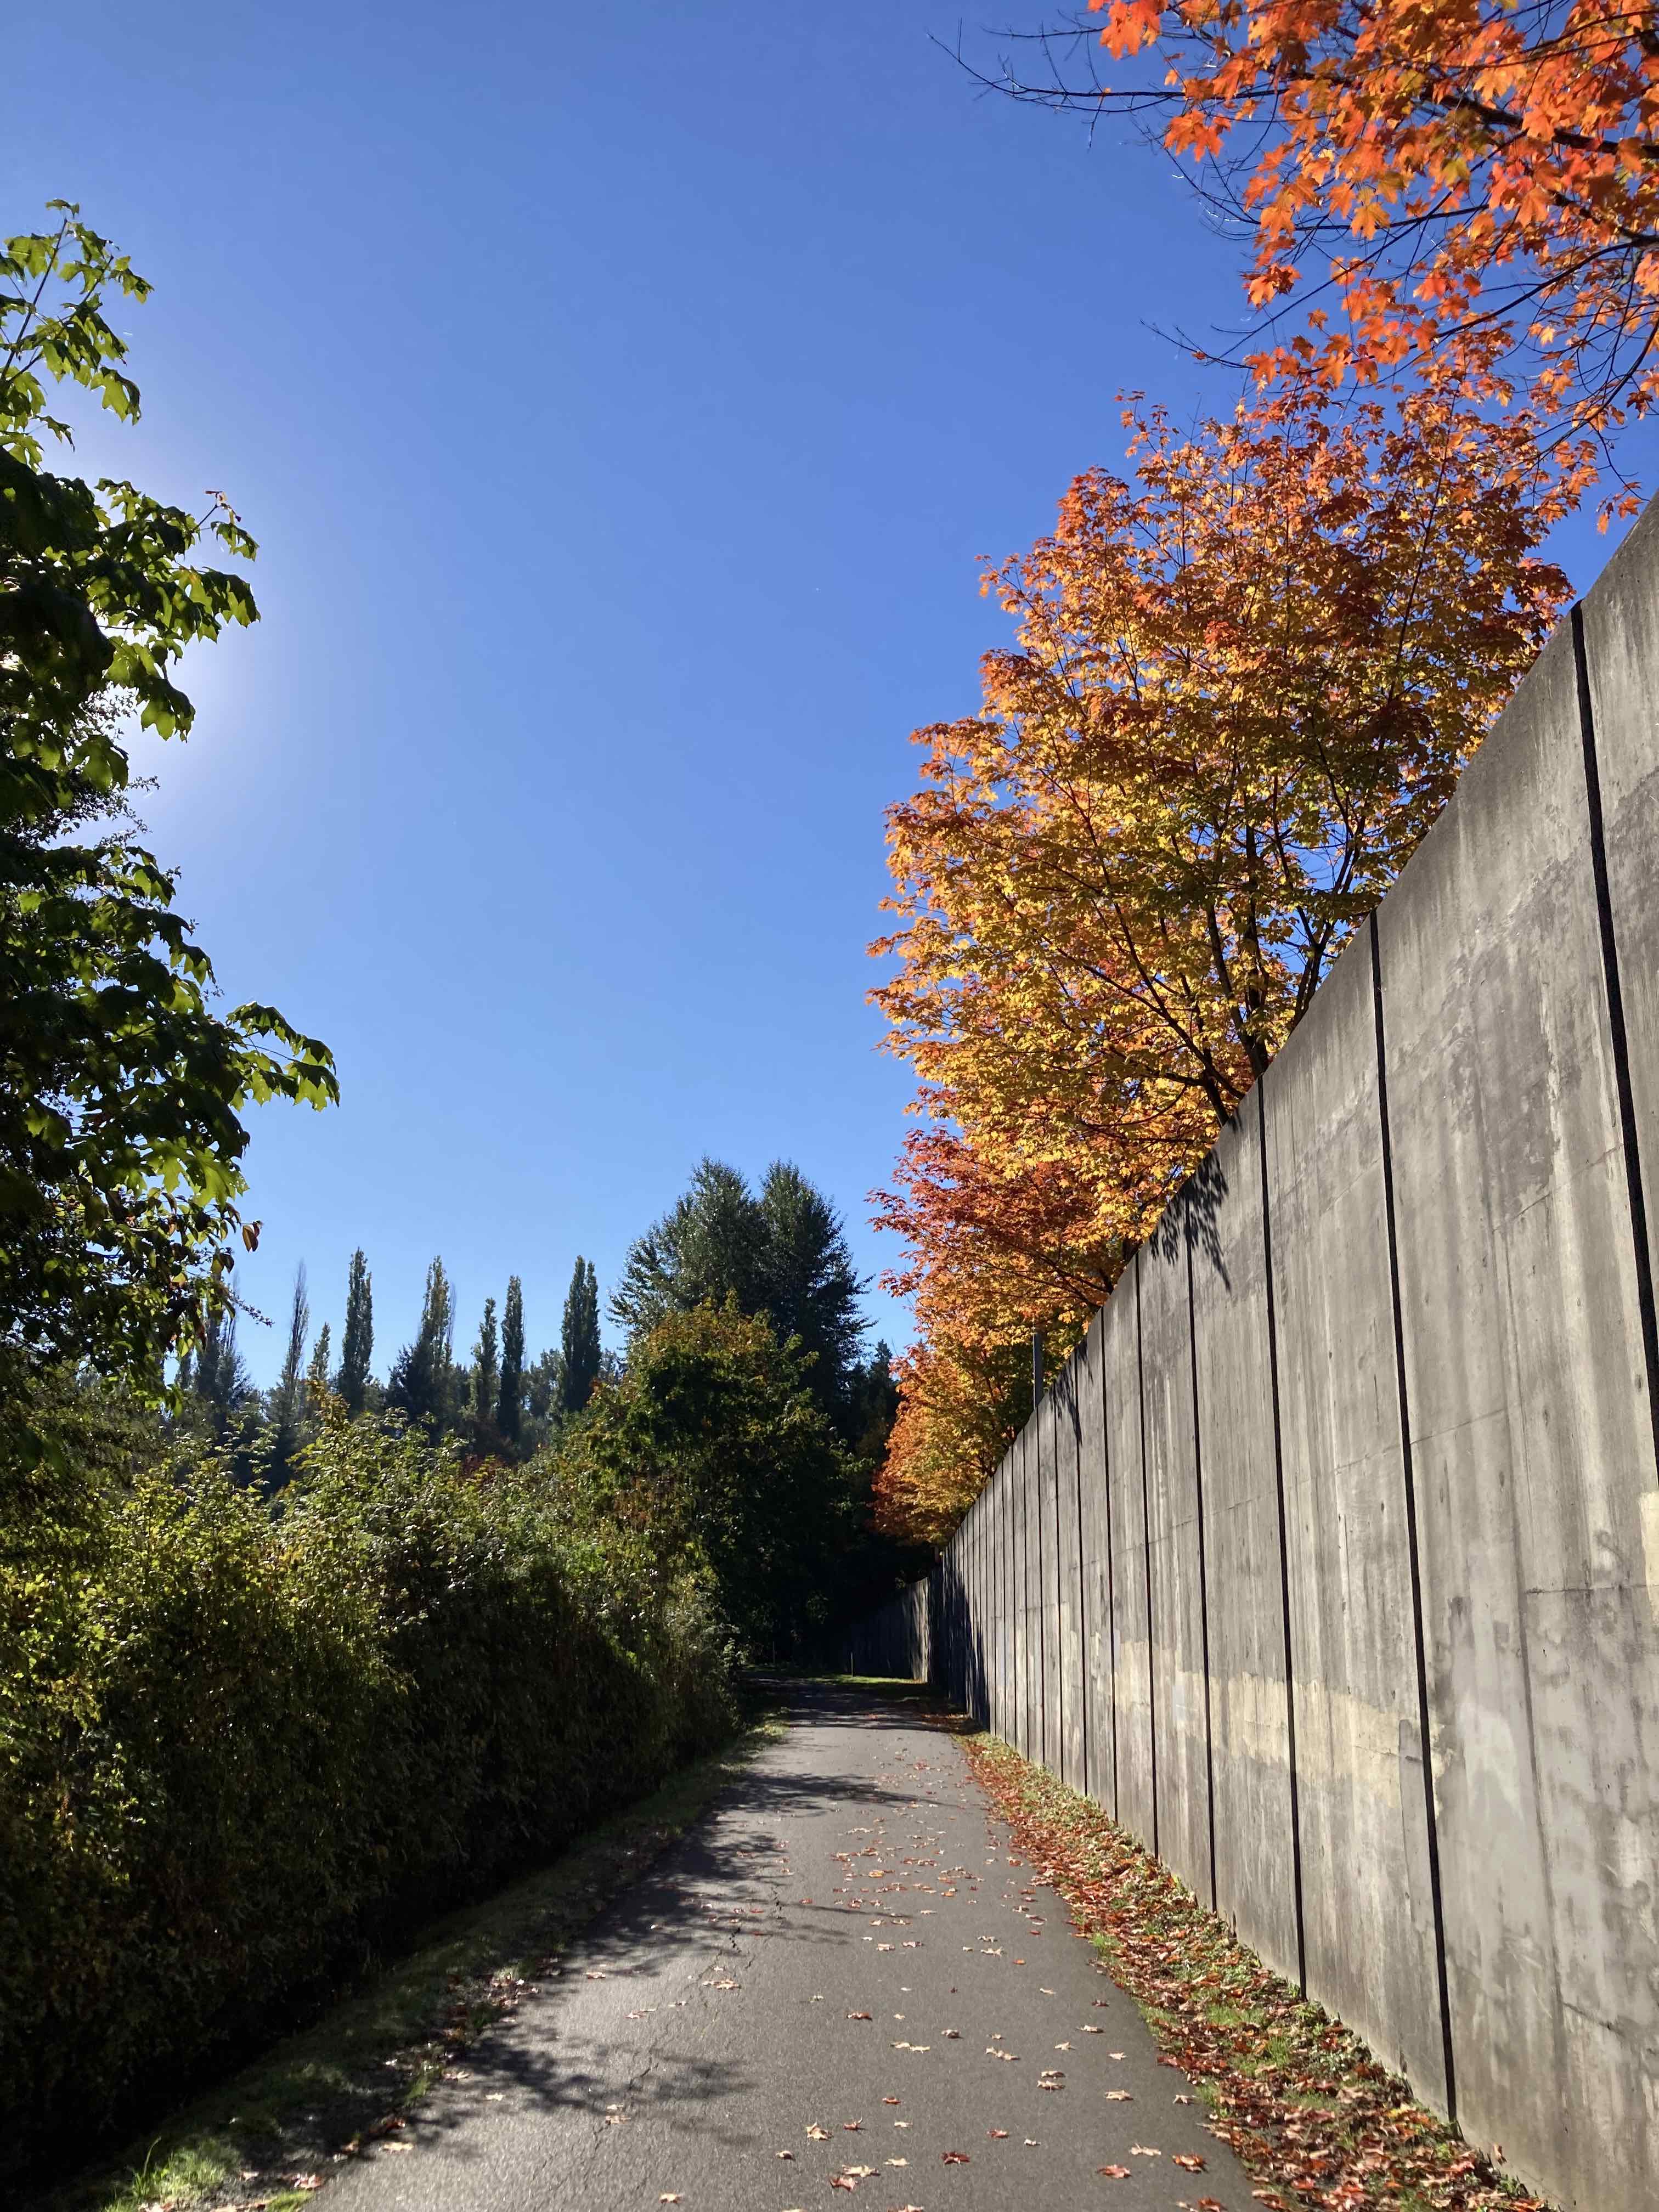
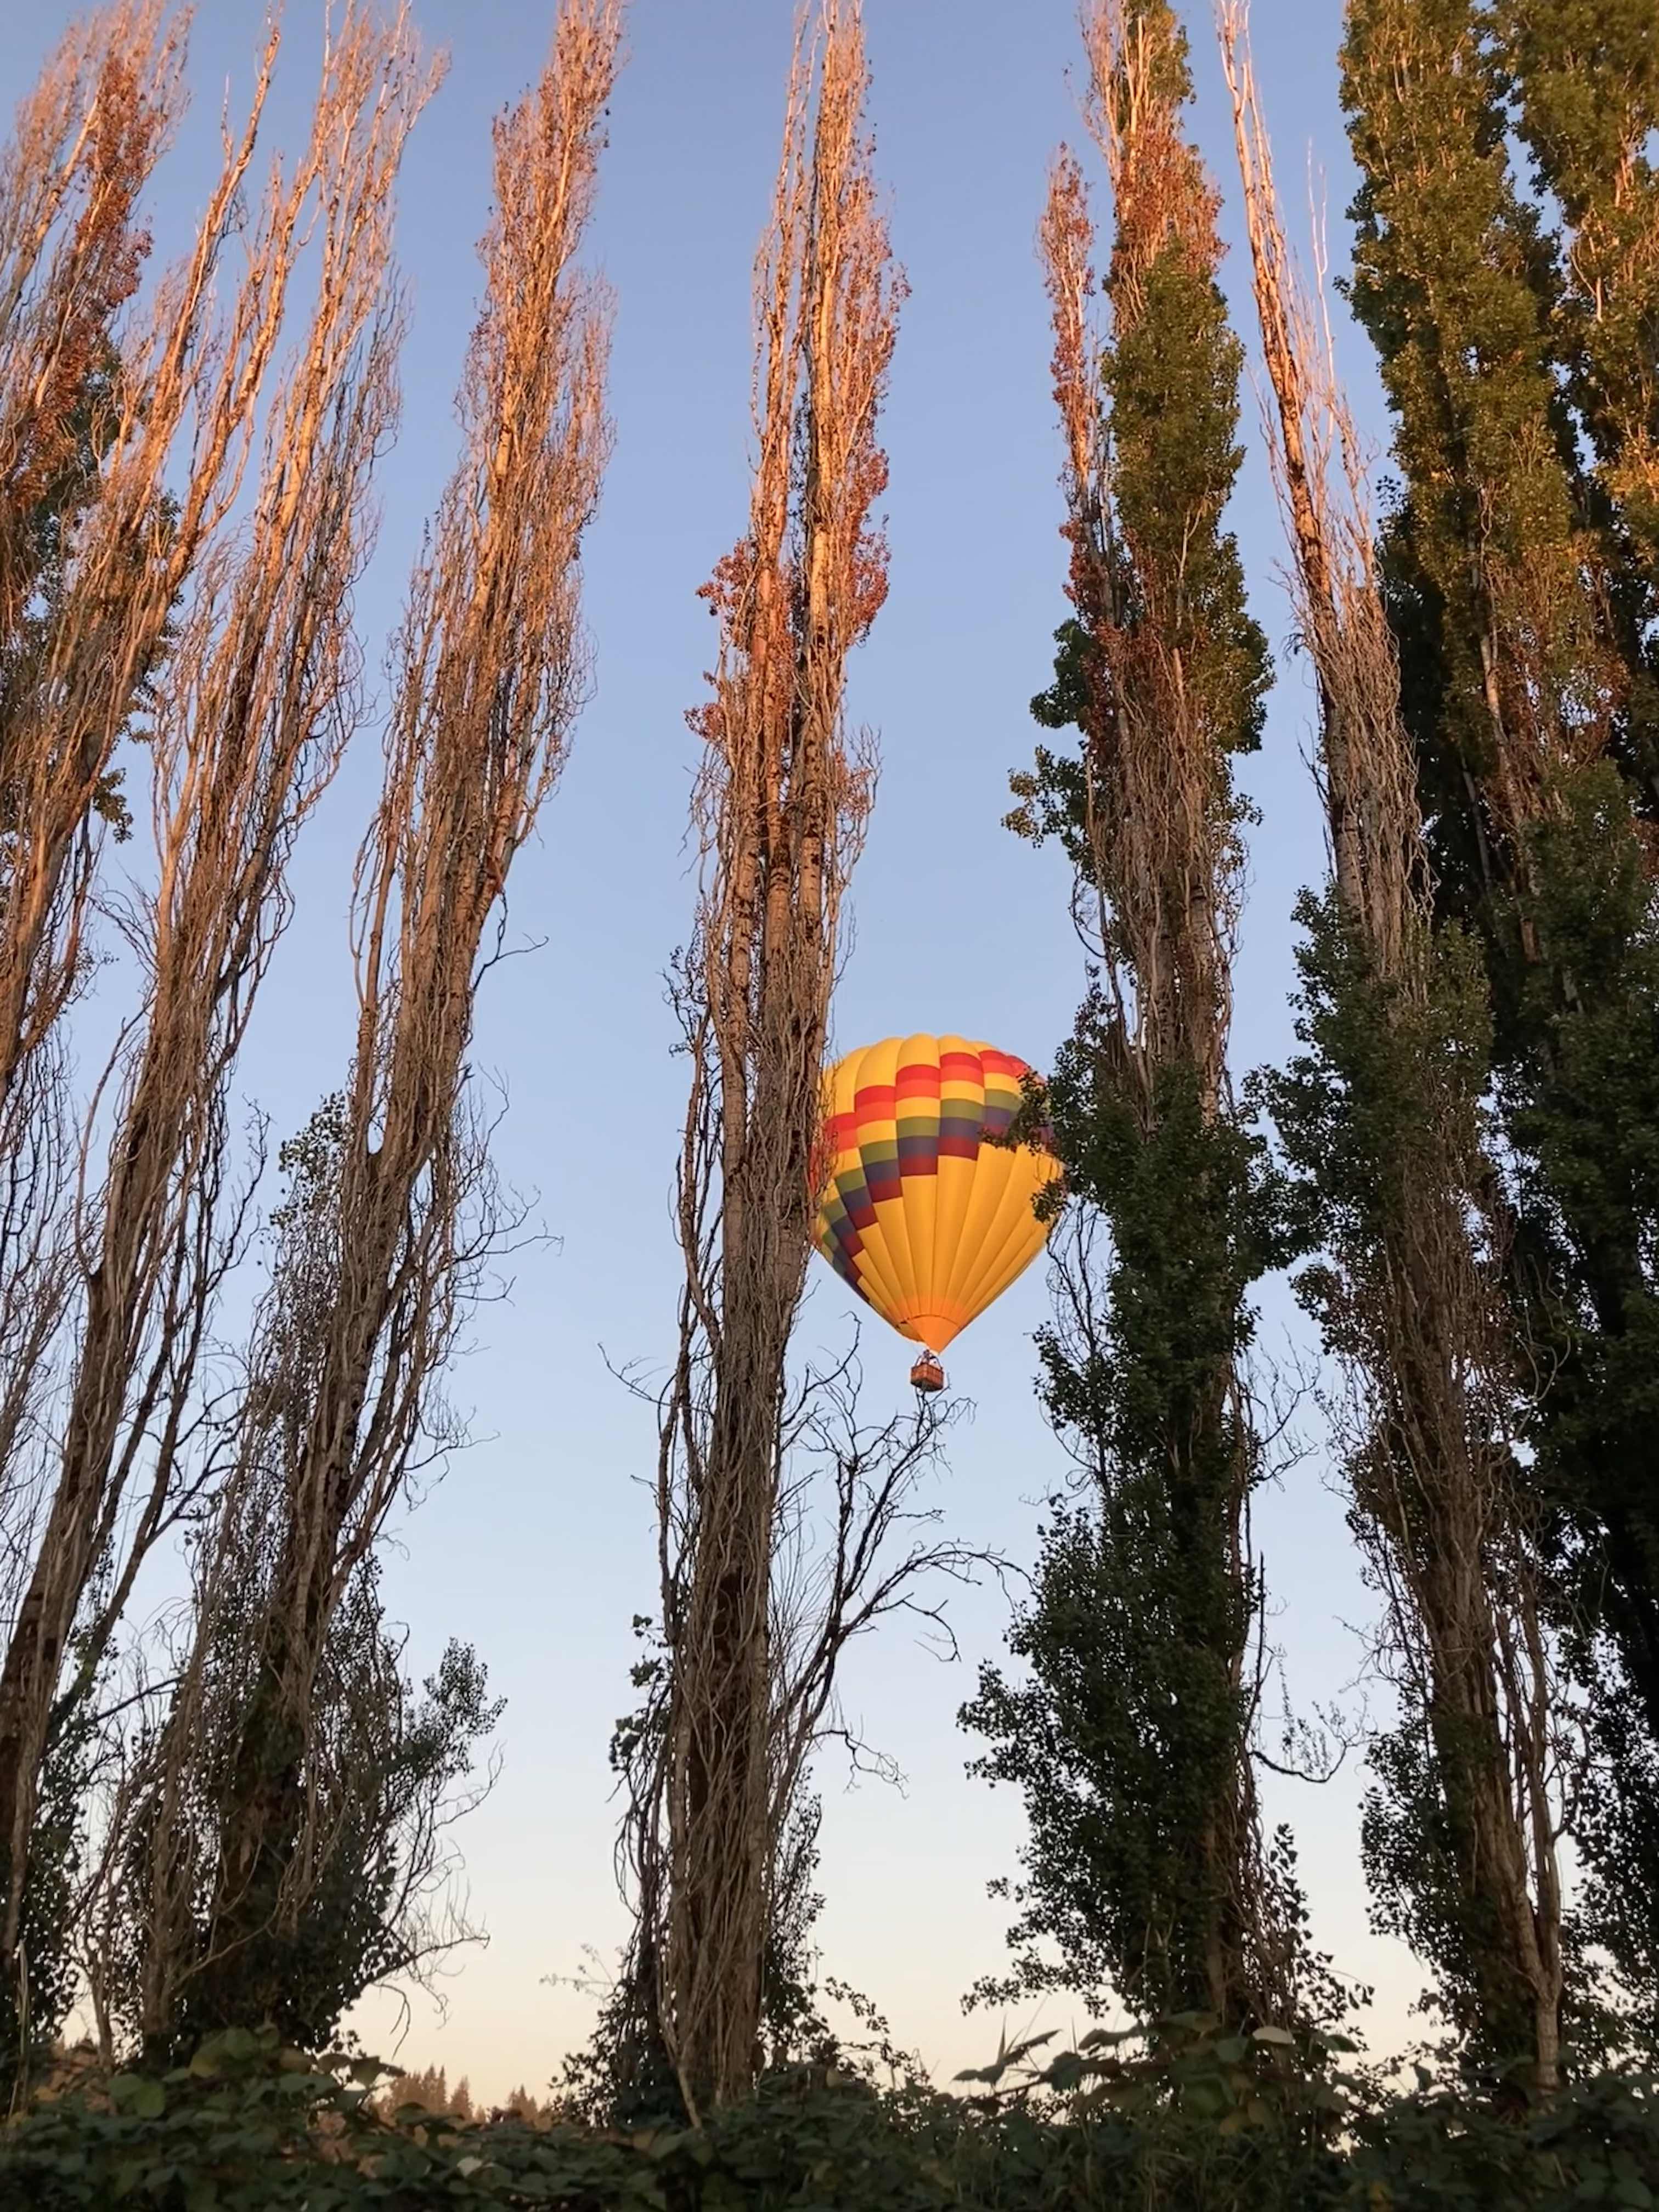
Lap 3 I did feel more tired. I talked my husband into bringing me my headlamp toward the end of the last lap, instead of me having to carry it for 4+ hours before the sun went down. (Originally, I thought I would need it 2-3 hours into this last lap, but because I was moving so well it was now looking like 4 hours, and it would be a 2-3 mile e-bike ride for him to bring me the lamp when I wanted it. That was a mental win to not have to run with the lamp when I wasn’t using it!) I was still run/walking the same duration of intervals, but slowed down to about 16:01 pace for this lap. Overall, I would be at 15:40 average for the whole day, but the fatigue and my tired feet started to kick in on the third lap between miles 34-51. Plus, I stopped to take a LOT more pictures, because there was a hot air balloon growing in the distance as it was flying right toward me – and then by me next to the trail! It ended up landing next to the soccer fields a mile behind me after it passed me in this picture. I actually made it home right as the sun set and didn’t have to wear my lamp at all that evening.

Day 1 recovery was better and worse than I expected. I sat down and used my foot massager on my still-socked feet, which felt very good. I took a shower after I peeled my socks off and took a look at my feet for the first time. I had one blister that I didn’t know was growing at all pop about an hour before I finished, but it was under some of my pre-taped area. I decided to leave the tape and see how it looked and felt in the morning. I had 2-3 other tiny, not a big deal blisters that I would tape in the morning but didn’t need any attention that night.

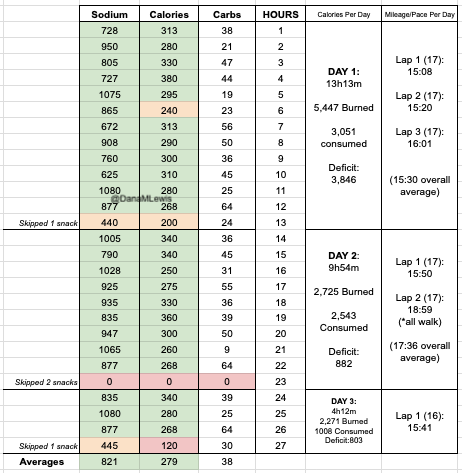
I had planned to eat a reasonably sized dinner – preferably around 1000 calories – each night, to help me address my calorie deficit. And I had a big deficit: I had burned 5,447 calories and consumed 3,051 calories in my 13 hours and 13 minutes of running. But I could only eat ¼ of the pizza I planned for dinner, and that took a lot of work to force myself to eat. So I gave up, and went to bed with a 3,846 calorie deficit, which was bigger than I wanted.

And going to bed hurt. I was stiff, which I could deal with, but my feet that didn’t hurt much while running started SCREAMING at me. All over. They hurt so bad. Not blisters, just intense aches. Ouch! I started to doubt my ability to run the next day, but this is where my pre-planning kicked in (aided by my husband who had agreed to the rules we had decided upon): no matter what, I would get up in the morning, get dressed, and go out and start my first lap. If I decided to quit, I could, but I could not quit at night in bed or in the morning in the bed or in the house. I had to get up and go. So I went to sleep, less optimistic about my ability to finish 50 miles again on day 2, but willing to see what would happen.

Day 2: 34 instead of 50 miles, and walking my first ever lap

I actually woke up before my alarm went off on day 2. Because I had finished so efficiently the day before, I was able to again get a good night’s sleep, even with the early alarm and waking up again at 4:30am with plans to be going by 6am. The extra time was helpful, because I didn’t feel rushed as I got ready to go. I spent some extra time taping my new blisters. Because they hadn’t popped, I put small torn pieces of Kleenex against them and used cut strips of kinesio tape to protect the area. (Read “Fixing Your Feet” for other great ultra-related foot care tips; I learned about Kleenex from that book.) I also use lambs’ wool for areas that rub or might be getting hot spots, so I put wool back in my usual places (between big and second toes, and on the side of the foot) plus another toe that was rubbing but not blistered and could use some cushion. I also this year have been trying Tom’s blister powder in my socks, which seems to help since my feet are extra sweat prone, and I had pre-powdered a stack of socks so I could simply slip them on and get going once I had done the Kleenex/tape and wool setup. The one blister that had popped under my tape wasn’t hurting when I pressed on it, so I left it alone and just added loose wool for a little padding.

A pretty view of the trail with bright blue sky after the sun rose with green bushes (and the river out of sight) to the left, with the trail parallel to a high concrete wall of a road with cheery red and yellow leaved trees leaning over the trail.And off I went. I managed to run/walk from the start, and faster than I had projected on my spreadsheets originally and definitely faster than I thought was possible the night before or even before I started that morning. Sure, I was slower than the day before, but 15:40 min/mi pace was nothing to sneeze at, and I was feeling good. I was really surprised that my legs, hips and body did not hurt at all! My multi-day or back-to-back training seemed to pay off here. All was well for most of the first lap (17 miles again), but then the last 2 or so miles, my pace started dipping unexpectedly so I was doing 16+ min/mi without changing my easy effort. I was disappointed, and tired, when I came into my aid station turnaround. I again didn’t need foot care and spent less than 5 minutes here, but I told Scott as I left that I was going to walk for a while, because my feet had been hurting and they were getting worse. Not blisters: but the balls of my feet were feeling excruciating.

A close up of a yellow shelled snail against the paved trail that I saw while walking the world's slowest 17-mile lap on day 2.I headed out, and within a few minutes he had re-packed up and biked up to ride alongside me for a few minutes and chat. I told him I was probably going to need to walk this entire lap. We agreed this was fine and to be expected, and was in fact built into my schedule that I would slow down. I’ve never walked a full lap in an ultra before, so this would be novel to me. But then my feet got louder and louder and I told him I didn’t think I could even walk the full lap. We decided that I should take some Tylenol, because I wasn’t limping and this wouldn’t mask any pain that would be important cues for my body that I would be overriding, but simply muting the “ow this is a lot” screams that the bones in the balls of my feet were feeling. He biked home, grabbed some, and came back out. I took the Tylenol and sent him home again, walking on. Luckily, the Tylenol did kick in and it went from almost unbearable to manageable super-discomfort, so I continued walking. And walking. And walking. It took FOREVER, it felt like, having gone from 15-16 min/mi pace with 30 seconds of running, 60 seconds of walking, to doing 19-20 minute miles of pure walking. It was boring. I had podcasts, music, audiobooks galore, and I was still bored and uncomfortable and not loving this experience. I also was thinking about it on the way back about how I did not want to do a 3rd lap that day (to get me to my planned 50 miles) walking again.

Scott biked out early to meet me and bring me extra ice, because it was getting hot and I was an hour slower than the day before and risking running out of water that lap if he didn’t. After he refilled my hydration pack and brought it back to me while I walked on, I told him I wanted to be done for the day. He pointed out that when I finished this lap, I would be at 34 miles for the day, and combined with the day before (51), that put me at 85 miles, which would be a new distance PR for me since last year I had stopped at 82. That was true, and that would be a nice place to stop for the day. He reminded me of our ‘rules’ that I could go out the next day and do another lap to get me to 100, and decide during that lap what else I wanted to do. I was pretty sure I didn’t want to do more, but agreed I would decide the next day. So I walked home, completing lap 2 and 34 miles for the day, bringing me to 85 miles overall across 2 days.

Day 2 recovery went a little better, in part because I didn’t do 51 miles (only 34) and I had walked rather than ran the second lap, and also stopped earlier in the day (4pm instead of 7pm). I had more time to shower and bring myself to finally eat an entire 1000 calories before going to bed, again with my feet screaming at me. I had more blisters this time, mostly again on my right foot, but the balls of my feet and the bones of my feet ached in a way they never had before. This time, though, instead of setting my alarm to get up and go by 6am, I decided to sleep for longer, and go out a little later to start my first lap. This was a deviation from my plan, but another deviation I felt was the right one: I needed the sleep to help my body recover to be able to even attempt another lap.

Day 3: Only 16 miles, but hitting 100 for the first time ever

Instead of 6am, I set out on Day 3 around 8:30am. I would have taken even longer to go, but the forecast was for a warm day (we ended up hitting 81F) and I wanted to be done with the lap before the worst of the heat. I thought there was a 10% chance I’d keep going after this lap, but it was a pretty small chance. However, I set out for the planned 16 mile lap and was pleasantly surprised that I was run/walking at about a 15:40 pace! Again, better than I had projected (although yes, I had deviated from my mileage plan the day before), and it felt like a good affirmation that stopping the day before instead of slogging out another walking lap was the right thing to do.

After a first few miles, I toyed with the idea of continuing on. But I knew with the heat I probably wouldn’t stand more than one more lap, which would get me to 116. Even if I went out again the fourth day, and did 1-2 laps, that would MAYBE get me to 150, but I doubted I could do that without starting to cause some serious damage. And it honestly wasn’t feeling fun. I had enjoyed the first day, running in the dark, the fog, the daylight, and the twilight, seeing changing fall leaves and running through piles of them. The second day was also fun for the first lap, but the second lap walking was probably what a lot of ultra marathoners call the “death march” and just not fun. I didn’t want to keep going if it wasn’t fun, and I didn’t want to run myself into the ground (meaning to be so worn down that it would take weeks to months to recover) or into injury, especially when the specific milestones didn’t really mean anything. Sure, I wanted to be a 200 mile ultramarathoner, something that only a few thousand people have ever done – but I didn’t want to do it at the expense of my well-being. I spent a lot of time thinking about it, especially miles 4-8, and was thinking about the fact that the day before I had started, I had gone to a doctor’s appointment and had an official diagnosis confirming my fifth autoimmune disease, then proceeded to run (was running) 100 miles. Despite all the fun challenges of running with autoimmune conditions, I’m in really good health and fitness. My training this year went so well and I really enjoyed it. Most of this ultra had gone so well physically, and my legs and body weren’t hurting at all: the weakness was my feet. I didn’t think I could have trained any differently to address that, nor do I think I could change it moving forward. It’s honestly just hard to run that many hours or that many miles, as most ultramarathoners know, and your feet take a beating. Given that I was running on pavement for all of those hours, it can be even harder – or a different kind of hard – than kicking roots and rocks on a dirt trail. I figured I would metaphorically kick myself if I tried for 116 or 134 and injured myself in a way that would take 6-8 weeks to recover, whereas I felt pretty confident that if I stopped after this lap (at 100), I would have a relatively short and easy recovery, no major issues, and bounce back better than I ever have, despite it being my longest ever ultramarathon. Yes, I was doing it as a multi-day with sleep in between, but both in time on feet and in mileage, it was still the most I’d ever done in 2 or 3 days.

And, I was tired of eating. I was fueling SO well. Per my plans, I set out to do >500 mg of sodium per hour and >250 calories per hour. I had been nailing it every lap and every day! Day 1 I averaged 809 mg of sodium per hour and 290 calories per hour. Day 2 was even increased from that, averaging 934 mg of sodium per hour and 303 calories per hour! Given the decreased caloric burn of day 2 because I walked the second lap, my caloric deficit for day 2 was a mere ~882 calories (given that I also managed to eat a full dinner that night), even though I skipped the last hour as I finished the walking lap. Day 3 I was also fueling above my goals, but I was tired of it. Sooooo tired of it. Remember, I have to take a pill every time I eat, because I have exocrine pancreatic insufficiency (EPI or PEI). I was eating every 30 minutes as I ran or walked, so that meant swallowing at least one pill every 30 minutes. I had swallowed 57 pills on Day 1 and 48 pills on Day 2, between my enzymes and electrolyte pills. SO MANY PILLS. The idea of continuing to eat constantly every 30 minutes for another lap of ~5 or more hours was also not appealing. I knew if I didn’t eat, I couldn’t continue.

A chart with an hourly break down of sodium, calories, and carbs consumed per hour, plus totals of caloric consumption, burn, and calculated deficit across ~27 hours of move time to accomplish 100 miles run.

And so, I decided to stop after one more lap on day 3, even though I was holding up a respectable 15:41 min/mi pace throughout. I hit 100 miles and finished the lap at home, happy with my decision.

Two pictures of me leaning over after my run holding a sign (one reading 50 miles, one reading 100 miles) for each of my cats to sniff.
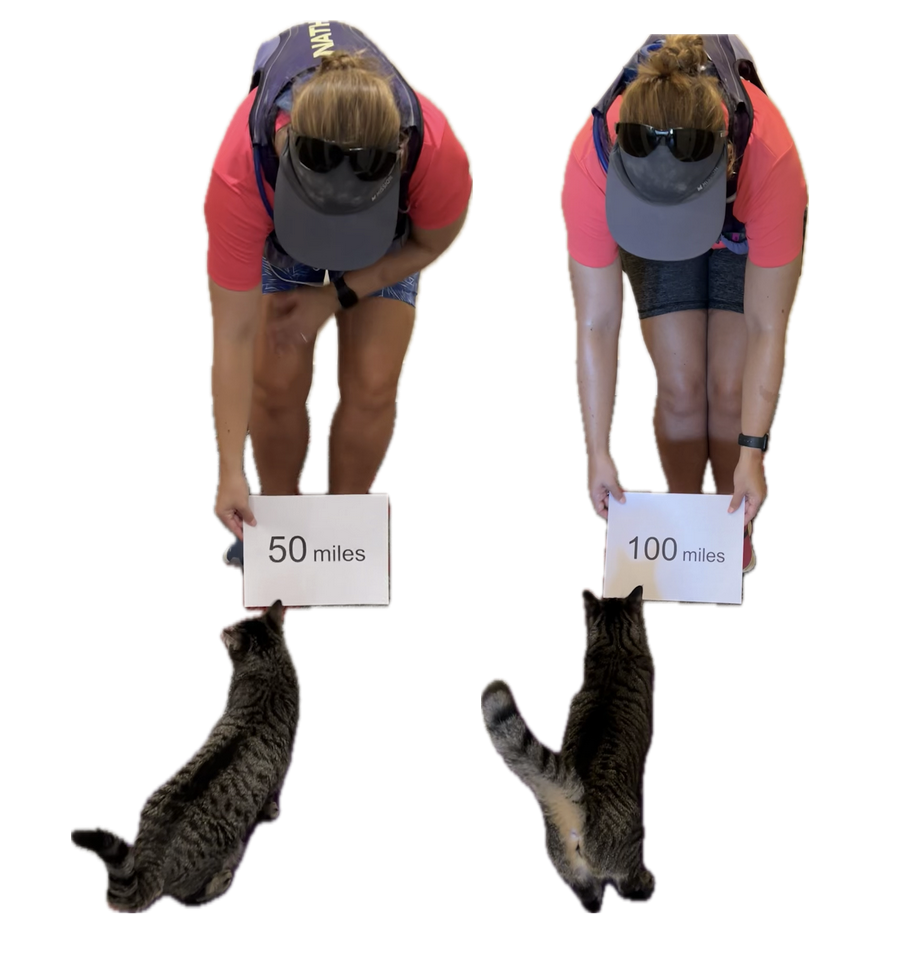
(You can see from these two pictures that I smelled VERY interesting, sweaty and salty and exhausted at the end of day 1 and day 3, when I hit 50 miles and 100 miles, respectively. We have two twin kittens (now 3 years old) and one came out to sniff me first on the first day, and the other came out as I came home on the third day!)

Because I had only run one final lap (16 miles) on day 3, and had so many bonus hours in the rest of the day afterward when I was done and home, I was able to eat more and end up with only a 803 calorie deficit for the day. So overall, day 1 had the biggest deficit and probably influenced my fatigue and perception of pain on day 2, but because I had shortened day 2 and then day 3, my very high calorie intake every hour did a pretty good job matching my calorie expenditure, which is probably why I felt very little muscle fatigue in my body and had no significant sore areas other than the bottoms of my feet. I ended up averaging 821 mg/hr of sodium and 279 calories per hour (taking into account the fact that I skipped two final snacks at the end of day 2 when I was walking it out; ignoring that completely skipped hour would mean the average caloric intake on hours I ate anything at all was closer to 290 calories/hr!)

In total, I ended up consuming 124 pills in approximately 27 hours of move time across my 100 miles. (This doesn’t include enzyme pills for my breakfast or dinners each of those days, either – just the electrolyte and enzyme pills consumed while running!)

AFTERMATH

Recovery after day 3 was pretty similar to day 2, with me being able to eat more and limit my calorie deficit. I’ve had long ~30 mile training runs where I wasn’t very hungry afterward, but it surprised me that even two days after my ultra, I still haven’t really regained my appetite. I would have figured my almost 4000 calorie deficit from day 1 would drive a lot of hunger, so this surprised me.

So too has my physical state: 48 hours following the completion of my 100 miles, I am in *fantastic* shape compared to other multi-day back to back series of runs I’ve done, ultramarathons or not. The few blisters I got, mainly on my right foot, have already flattened themselves up and mostly vanished. I think I get more blisters on my right foot because of breaking my toe last year: my right foot now splays wider in my shoe, so it tends to get more blisters and cause more trouble than my left foot. I got only one blister on my left foot, which is still fluid filled but not painful and starting to visibly deflate now that I’m not rubbing it onto a shoe constantly any more. And my legs don’t feel like I ran at all, let alone running 51+34+16 miles!

I am tired, though. I don’t have brain fog, probably because of my excellent fueling, but I am fatigued in terms of overall energy and lack of motivation to get a lot done yesterday and today (other than writing this blog post!). So that’s probably pretty on par with my effort expended and matches what I expected, but it’s nice to be able to move around without hurting (other than my feet).

My feet in terms of general aches and ows are what came out the worst from my run. Day 2, what hurt was the bottom of the balls of my feet. Starting each night though, I was getting aches all over in all of the bones of my feet. After day 3, that night the foot aches were particularly strong, and I took some Tylenol to help with that. Yesterday evening and today though, the ache has settled down to very minor and only occasionally noticeable. The tendon from the top of my left foot up my ankle is sore and gets cranky when I wear my sneakers (although it didn’t bother me at all while running any of the days), so after tying and re-tying my shoelaces 18 times yesterday to try to find the perfect fit for my left foot, today I went on my recovery walk in flip flops and was much happier.

What I’m taking away from this 200 mile attempt that was only 100 miles:

I feel a little disappointed that I didn’t get anywhere near 200 miles, but obviously, I was not willing to hurt long enough or hard enough to get there. My husband called it a stretch goal. Rationally, I am very happy with my choices to stop at 100 and end up in the fantastic physical shape that I am in, and I recognize that I made a very rational choice and tradeoff between ending in good shape (and health) and the mainly ego-driven benefits of possibly achieving 200 miles (for me).

Would I do anything different? I can’t think of anything. If I somehow had an alternate do-over, I can’t think of anything I would think to change. I’d like to reduce my risk of blisters but I’m already doing all I can there, and dealing with changes in my right foot shape post-broken toe that I have no control over. And I’m not sure how to train more/better for reducing the bottom ball of foot pain that I got: I already trained multiple days, back to back, long hours of feet on pavement. It’s possible that having my doctor’s appointment the day before I started influenced my mental calculation of my future risk/benefit tradeoff of continuing more miles, and so not having had that then may have changed my calculations to do another lap or two, or go out on the 4th day (which I did not). But, I don’t have a do over, and I’ll never know, and I’m not too upset about that because I was able to control what I could control and am again pretty happy with the outcomes. 100 or 150 miles felt about the same to me, psychologically, in terms of satisfaction.

What I would tell other people about attempting multiple day ultramarathons or 200 mile ultramarathons:

Training back to back days is one option, as is long spurts of time on feet walking/hiking/running. I don’t think “just running” has to be the only way to train for these things. I’m also a big proponent of short intervals: If you hear people recommend taking walk breaks, it doesn’t have to be 1 minute every 10 minutes or every mile. It can be as short as every 30 seconds of running, take a walk break! There’s no wrong way to do it, whatever makes your body and brain happy. I get bored running longer (and don’t like it); other people get bored running the short intervals that I do – so find what works for you and what you’re actually willing to do.

Having plans for how you’ll rest X hours and go out and try to make it another lap or to the next aid station works really well, especially if you have crew/pacers/support (for me, my husband) who will stick to those rules and help you get back out there to try the next lap/section. Speaking of sleep/rest, laying down for a while helps as much as sleeping, so even if you can’t sleep, committing to the rest of X hours is also good for resting your feet and everything. I found that the hour laying down before I fell asleep helped my body process the noise of the “ouch” from my feet and it was a lot easier to sleep after that. Plan that you’ll have some down/up time before and after your sleep/rest time, and figure that into your time plans accordingly.

The cheesy “know your why” and “know what you want” recommendations do help. I didn’t want 200 miles badly enough to hurt more for longer and risk months of recovery (or the inability to recover). Maybe you’d be lucky enough to achieve 200 without hurting that bad, that long, or risking injury – or maybe you’ll have to make that choice, and you might make it differently than I did. (Maybe you’re lucky enough to not have 5 autoimmune things to juggle! I hope you don’t have to!) I kind of knew going in that I was only going to hit 200 if all went perfect.

Diabetes and this 200 mile ultramarathon that was a 100 mile ultra:

I just realized that I managed to write an ENTIRE race report without talking about diabetes and glucose management…because I had zero diabetes-related thoughts or issues during these several days of my run! Sweet! (Pun fully intended.)

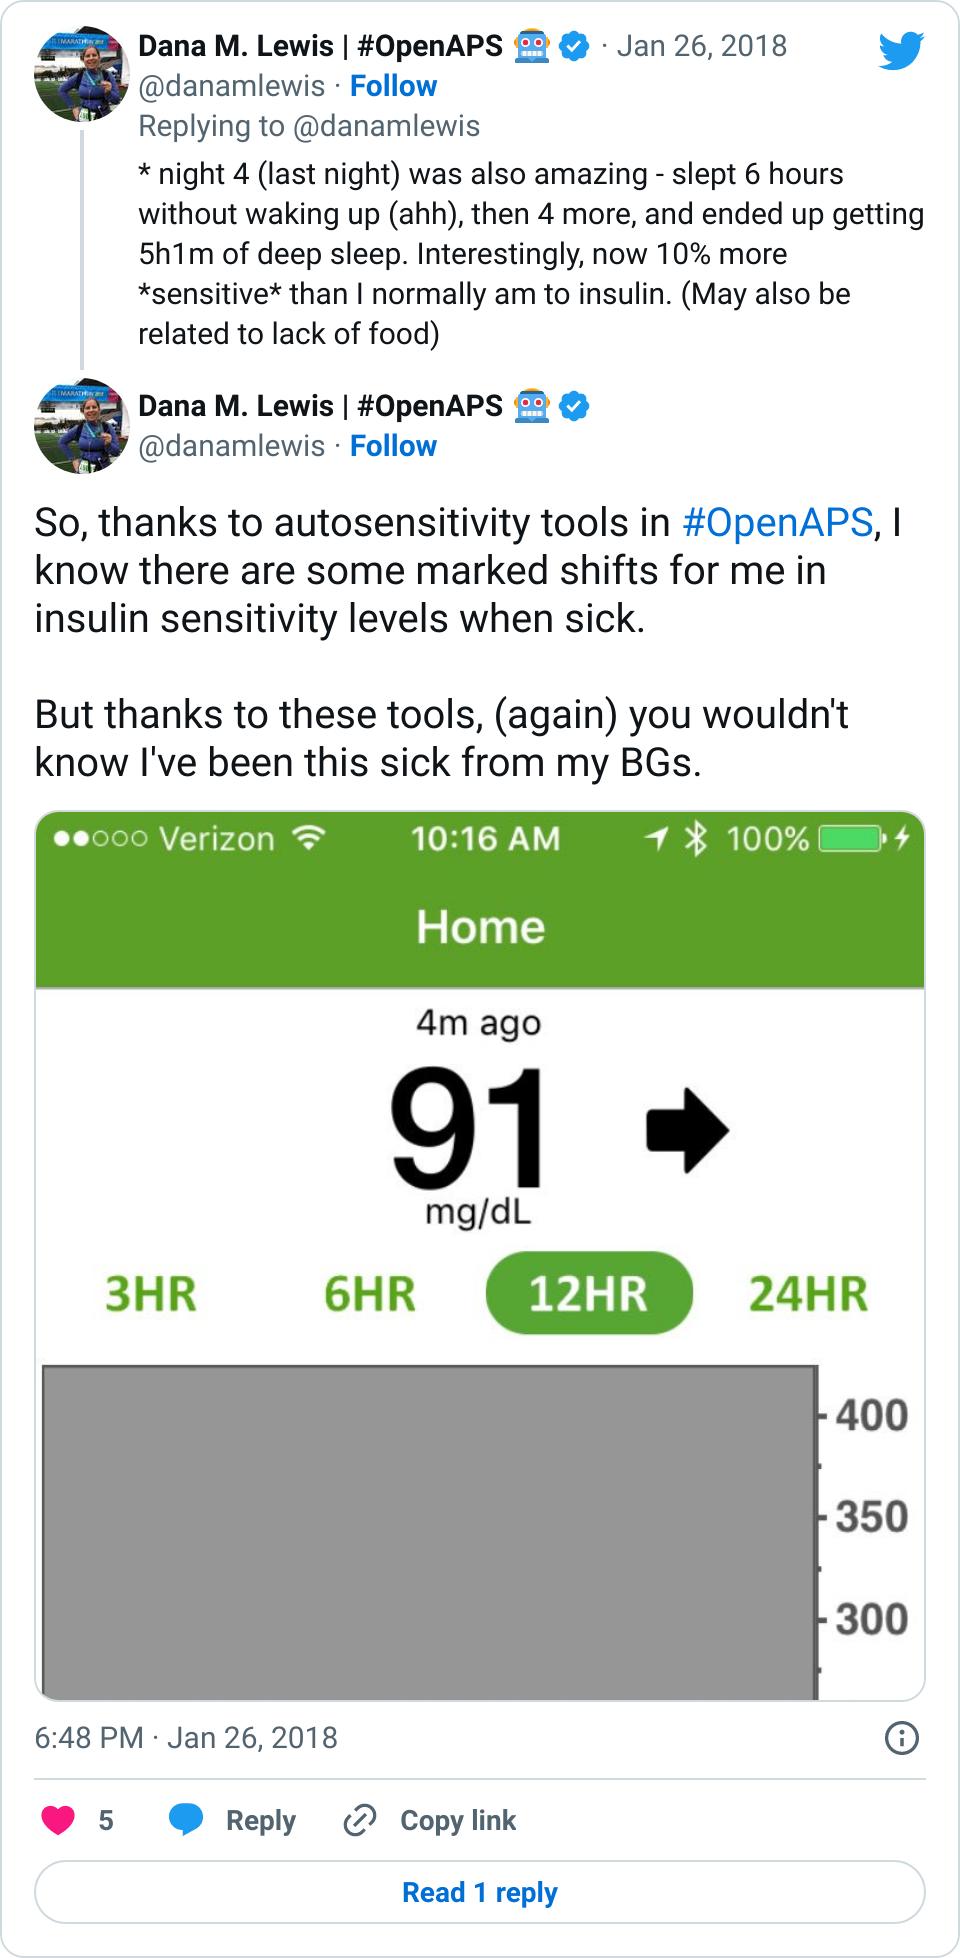
Remember, I have type 1 diabetes and use an open source automated insulin delivery (AID) system (in my case, still using OpenAPS after alllllll these years), and I’ve talked previously about how I fuel while ultrarunning and juggling blood glucose management. Unlike previous ultras, I had zero pump site malfunctions (phew) and my glucose stayed nicely in range throughout. I think I had one small drift above range for 2 hours due to an hour of higher carb activity right when I shifted to walking the second lap on day 2, but otherwise was nicely in range all days and all nights without any extra thought or energy expended. I didn’t have to take a single “low carb”/hypoglycemia treatment! I think there was one snack I took a few minutes early when I saw I was drifting down slightly, but that was mostly a convenience thing and I probably would not have gone low (below target) even if I had waited for my planned fuel interval. But out of 46 snacks, only one 5-10 minutes early is impressive to me.

I had no issues after each day’s run, either: OpenAPS seamlessly adjusted to the increasing insulin sensitivity (using “autosensitivity” or “autosens”) so I didn’t have to do manual profile shifts or overrides or any manual interference. I did decide each night whether I wanted to let it SMB (supermicrobolus) as usual or stick to temp basal only to reduce the risk of hypoglycemia, but I had no post-dinner or overnight lows at all.

The most “work” I had to do was deciding to wear a second CGM sensor (staggered, 5 days after my other one started) so that I had a CGM sensor session going with good quality data that I could fall back to if my other sensor started to get jumpy, because the sensor session was supposed to end the night of day 4 of my planned run. I obviously didn’t run day 4, but even so I was glad to have another sensor going (worth the cost of overlapping my sensors) in order to have the reassurance of constant data if the first one died or fell out and I could seamlessly switch to an already-warmed up sensor with good data. I didn’t need it, but I was glad to have done that in prep.

(Because I didn’t talk about diabetes a lot in this post, because it was not very relevant to my experiences here, you might want to check out my previous race recaps and posts about utlrarunning like this one where I talk in more detail about balancing fueling, insulin, and glucose management while running for zillions of hours.)

TLDR: I ran 100 miles, and I did it my DIY way: my own course, my own (slow pace), with sleep breaks, a lot of fueling, and a lot of satisfaction of setting big goals and attempting to achieve them. I think for me, the process goals of figuring out how to even safely attempt ultramarathons are even more rewarding than the mileage milestones of ultrarunning.

Running a multi-day ultramarathon by Dana M. Lewis from DIYPS.org

Why DIY AID in 2023? #ADA2023 Debate

I was asked to participate in a ‘debate’ about AID at #ADA2023 (ADA Scientific Sessions), representing the perspective that DIY systems should be an option for people living with diabetes.

I present this perspective as a person with type 1 diabetes who has been using DIY AID for almost a decade (and as a developer/contributor to the open source AID systems used in DIY) – please note my constant reminder that I am not a medical doctor.

Dr. Gregory P. Forlenza, an Associate Professor from Barbara Davis Center, presented a viewpoint as a medical doctor practicing in the US.

FYI: here are my disclosures and Dr. Forlenza’s disclosures:

On the left is my slide (Dana M. Lewis) showing I have no commercial support or conflicts of interest. My research in the last 3 years has previously been funded by the New Zealand Health Research Council (for the CREATE Trial); JDRF; and DiabetesMine. Dr. Forlenza lists research support from NIH, JDRF, NSF, Helmsley Charitable Trust, Medtronic, Dexcom, Abbott, Insulet, Tandem, Beta Bionics, and Lilly. He also lists Consulting/Speaking/AdBoard: Medtronic, Dexcom, Abbott, Insulet, Tandem, Beta Bionics, and Lilly.

I opened the debate with my initial presentation. I talk about the history of DIY in diabetes going back to the 1970s, when people with diabetes had to “DIY” with blood glucose meters because initially healthcare providers did not want people to fingerstick at home because they might do something with the information. Similarly, even insulin pumps and CGMs have been used in different “DIY” ways over the years – notably, people with diabetes began dosing insulin using CGM data for years prior to them being approved for that purpose. It’s therefore less of a surprise in that context to think about DIY being done for AID. (If you’re reading this you probably also know that DIY AID was done years before commercial AID was even available; and that there are multiple DIY systems with multiple pump and CGM options, algorithms, and phone options).

And, for people with diabetes, using DIY is very similar to how a lot of doctors recommend or prescribe doing things off label. Diabetes has a LOT of these types of recommendations, whether it’s different types of insulins used in pumps that weren’t approved for that type of insulin; medications for Type 2 being used for Type 1 (and vice versa); and other things that aren’t regulatory approved at all but often recommended anyway. For example, GLP-1’s that are approved for weight management and not glycemic control, but are often prescribed for glycemic control reasons. Or things like Vitamin D, which are widely prescribed or recommended as a supplement even though it is not regulatory-approved as a pharmaceutical agent.

I always like to emphasize that although open source AID is not necessarily regulated (but can be: one open source system has received regulatory clearance recently), that’s not a synonym for ‘no evidence’. There’s plenty of high quality scientific evidence on DIY use and non-DIY use of open source AID. There’s even a recent RCT in the New England Journal of Medicine, not to mention several other RCTs (see here and here, plus another pending publication forthcoming). In addition to those gold-standard RCTs, there are also reviews of large-scale big data datasets from people with diabetes using AID, such as this one where we reviewed 122 people’s glucose data representing 46,070 days’ worth of data; or another forthcoming publication where we analyzed the n=75 unique (distinct from the previous dataset) DIY AID users with 36,827 days’ of data (average of 491 days per participant) and also found above goal TIR outcomes (e.g. mean TIR 70-180 mg/dL of 82.08%).

Yet, people often choose to DIY with AID not just for the glucose outcomes. Yes, commercial AID systems (especially now second-generation) can similarly reach the goal of 70+% TIR on average. DIY helps provide more choices about the type and amount of work that people with diabetes have to put IN to these systems in order to get these above-goal OUTcomes. They can choose, overall or situationally, whether to bolus, count carbs precisely, announce meals at all, or only announce relative meal size while still achieving >80% TIR, no or little hypoglycemia, and less hyperglycemia. Many people using DIY AID for years have been doing no-bolus and/or no meal announcements at all, bringing this closer to a full closed loop, or at least, an AID system with very, very little user input required on a daily basis if they so choose. I presented data back in 2018(!) showing how this was being done in DIY AID, and it was recently confirmed in a randomized control trial (hello, gold standard!) showing that between traditional use (with meal announcements and meal boluses); meal announcement only (no boluses); and no announcement nor bolusing, that they all got similar outcomes in terms of TIR (all above-goal). There was also no difference in those modes of total daily insulin dose (TDD) or amount of carb intake. There was a small difference in time below range being slightly higher in the first mode (where people were counting carbs and bolusing) as compared to the other two modes – which suggests that MORE user input may actually be limiting the capabilities of the system!

The TLDR here is that people with diabetes can do less work/provide less input into AID and still achieve the same level of ideal, above-goal outcomes – and ongoing studies are showing the increased QOL and other patient-reported outcomes that also improve as a result.

Again, people may be predisposed to think that the main difference between commercial and DIY is whether or not it is regulatory approved (and therefore prescribable by doctors and able to be supported by a company under warranty); the bigger differences are instead around interoperability across devices, data access, and transparency of how the system works.

There’s even an international consensus statement on open source AID, created by an international group of 48 medical and legal experts, endorsed by 9 national and international diabetes organizations, supporting that open source AID used in DIY AID is a safe and effective treatment option, confirming that the scientific evidence exists and it has the potential to help people with diabetes and reduce the burden of diabetes. They emphasize that doctors should support patient (and caregiver) autonomy and choice of DIY AID, and state that doctors have a responsibility to learn about all options that exist including DIY. The consensus statement is focused on open source AID but also, in my opinion, applies to all AID: they say that AID systems should fully disclose how they operate to enable informed decisions and that all users should have real-time and open access to their own data. Yes, please! (This is true of DIY but not true of all commercial systems.)

The elephant in the room that I always bring up is cost, insurance coverage, and therefore access and accessibility of AID. Many places have government or insurance that won’t cover AID. For example, the proposed NICE guidelines in the UK wouldn’t provide AID to everyone who wants one. In other places, some people can get their pump covered but not CGM, or vice versa, and must pay out of pocket. Therefore in some cases, DIY has out of pocket costs (because it’s not covered by insurance), but is still cheaper than AID with insurance coverage (if it’s even covered).

I also want to remind everyone that choosing to DIY – or not – is not a once-in-a-lifetime decision. People who use DIY choose every day to use it and continue to use it; at any time, they could and some do choose to switch to a commercial system. Others try commercial, switch back to DIY, and switch back and forth over time for various reasons. It’s not a single or permanent decision to DIY!

The key point is: DIY AID provides safety and efficacy *and* user choice for people with diabetes.

Dr. Forlenza followed my presentation, talking about commercial AID systems and how they’ve moved through development more quickly recently. He points to the RCTs for each approved commercial system that exist, saying commercial AID systems work, and describing different feature sets and variety across commercial systems. He shared his thoughts on advantages of commercial systems including integration between components by the companies; regulatory approval meaning these systems can be prescribed by healthcare providers; company-provided warranties; and company provided training and support of healthcare providers and patients.

He makes a big point about a perceived reporting bias in social media, which is a valid point, and talks about people who cherry pick (my words) data to share online about their TIR.

He puts an observational study and the CREATE Trial RCT data up next to the commercial AID systems RCT data, showing how the second generation commercial AID reach similar TIR outcomes.

He then says “what are you #notwaiting for?”, pointing out in the US that there are 4 commercial systems FDA approved for type 1 diabetes. He says “Data from the DIY trials themselves demonstrate that DIY users, even with extreme selection bias, do not achieve better glycemic control than is seen with commercial systems.” He concludes that commercial AID has a wide variety of options; commercial systems achieve target-level outcomes; a perception that both glucose outcomes and QOL are being addressed by the commercial market, and that “we do not need Unapproved DIY solutions in this space”.

After Dr. Forlenza’s presentation, I began my rebuttal, starting with pointing out that he is incorrectly conflating perceived biases/self-reporting of social media posts with gold-standard, rigorously performed scientific trials evaluating DIY. Data from DIY AID trials do not suffer from ‘selection bias’ any more than commercial AID trials do. (In fact, all clinical trials have their own aspects of selection bias, although that isn’t the point here.) I reminded the audience of the not one but multiple RCTs available as well as dozens of other prospective and retrospective clinical trials. Plus, we have 82,000+ data points analyzed showing above-goal outcomes, and many studies that evaluate this data and adjust for starting outcomes still show that people with diabetes who use DIY AID benefit from doing so, regardless of their starting A1c/TIR or demographics. This isn’t cherry-picked social media anecdata.

When studies are done rigorously, as they have been done in DIY, we agree that now second-generation commercial AID systems reach (or exceed, depending on the system) ADA standard of care outcomes. For example, Dr. Forlenza cited the OP5 study with 73.9% TIR which is similar to the CREATE Trial 74.5% TIR.

My point is not that commercial systems don’t work; my point is that DIY systems *do* work and that the fact that commercial systems work doesn’t then override the fact that DIY systems have been shown to work, also! It’s a “yes, and”! Yes, commercial AID systems work; and yes, DIY AID systems work.

The bigger point, which Dr. Forlenza does not address, is that the person with diabetes should get to CHOOSE what is best for them, which is not ONLY about glucose outcomes. Yes, a commercial system- like DIY AID – may help someone get to goal TIR (or above goal), but DIY provides more choice in terms of the input behaviors required to achieve those outcomes! There’s also possible choice of systems with different pumps or CGMs, different (often lower) cost, increased data access and interoperability of data displays, different mobile device options, and more.

Also, supporting user choice of DIY is in fact A STANDARD OF CARE!

It’s in the ADA’s Standards of Care, in fact, as I wrote about here when observing that it’s in the 2023 Standards of Care…as well as in 2022, 2021, 2020, and 2019!

I wouldn’t be surprised if there are people attending the debate who think they don’t have any – or many – patients using DIY AID. For those who think that (or are reading this thinking the same), I ask a question: how many patients have you asked if they are using DIY AID?

There’s a bunch of reasons why it may not come up, if you haven’t asked:

  • They may use the same consumables (sites, reservoirs) with a different or previous pump in a DIY AID system.
  • Their prescribed pump (particularly in Europe and non-US places that have Bluetooth-enabled pumps) may be usable in a DIY AID.
  • They may not be getting their supplies through insurance, so their prescription doesn’t match what they are currently using.
  • Or, they have more urgent priorities to discuss at appointments, so it doesn’t come up.
  • Or, it’s also possible that it hasn’t come up because they don’t need any assistance or support from their healthcare provider.

Speaking of learning and support, it’s worth noting that in DIY AID, because it is open source and the documentation is freely available, users typically begin learning more about the system prior to initiating their start of closed loop (automated insulin delivery). As a result, the process of understanding and developing trust in the system begins prior to closed loop start as well. In contrast, much of the time there is limited available education prior to receiving the prescription for a commercial AID; it often aligns more closely with the timeline of starting the device. Additionally, because it is a “black box” with fewer available details about exactly how it works (and why), the process of developing trust can be a slower process that occurs only after a user begins to use a commercial device.

With DIY AID, because it is open source and the documentation is freely available, users typically begin learning more about the system prior to initiating their start of closed loop (automated insulin delivery). As a result, the process of understanding and developing trust in the system begins prior to closed loop start as well. In contrast, much of the time there is limited available education prior to receiving the prescription for a commercial AID; it often aligns more closely with the timeline of starting the device. Additionally, because it is a black box with less available details about exactly how it works (and why), the process of developing trust can be a slower process that occurs only after a user begins to use a commercial device. The learning & trust in AID timelines is something that needs more attention in commercial AID moving forward.

I closed my rebuttal section by asking a few questions out loud:

I wonder how healthcare providers feel when patients learn something before they do – which is often what happens with DIY AID. Does it make you uncomfortable, excited, curious, or some other feeling? Why?

I encouraged healthcare providers to consider when they are comfortable with off-label prescriptions (or recommending things that aren’t approved, such as Vitamin D), and reflect on how that differs from understanding patients’ choices to DIY.

I also prompted everyone to consider whether they’ve actually evaluated (all of) the safety and efficacy data, of which many studies exist. And to consider who benefits from each type of system, not only commercial/DIY but individual systems within those buckets. And to consider who gets offered/prescribed AID systems (of any sort) and whether subconscious biases around tech literacy, previous glucose outcomes, and other factors (race, gender, other demographic variables) result in particular groups of people being excluded from accessing AID. I also remind everyone to think about what financial incentives influence access and available of AID education, and where the education comes from.

Although Dr. Forlenza’s  rebuttal followed mine, I’ll summarize it here before finishing a recap of my rebuttal: he talks about individual selection bias/cherry picked data, acknowledging it can occur in anecdotes with commercial systems as well; talks about the distinction of regulatory approval vs. off label and unapproved; legal concerns for healthcare providers; and closes pointing out that many PWD see primary care providers, he doesn’t believe it is reasonable to expect PCPs to become familiar with DIY since there are no paid device representatives to support their learning, and that growth of AID requires industry support.

People probably wanted to walk out of this debate with a black and white, clear answer on what is the ‘right’ type of AID system: DIY or commercial. The answer to that question isn’t straightforward, because it depends.

It depends on whether a system is even AVAILABLE. Not all countries have regulatory-approved systems available, meaning commercial AID is not available everywhere. Some places and people are also limited by ACCESSIBILITY, because their healthcare providers won’t prescribe an AID system to them; or insurance won’t cover it. AFFORDABILITY, even with insurance coverage, also plays a role: commercial AID systems (and even pump and CGM components without AID) are expensive and not everyone can afford them. Finally, ADAPTABILITY matters for some people, and not all systems work well for everyone.

When these factors align – they are available, accessible, affordable, and adaptable – that means for some people in some places in some situations, there are commercial systems that meet those needs. But for other people in other places in other situations, DIY systems instead or also can meet that need.

The point is, though, that we need a bigger overlap of these criteria! We need MORE AID systems to be available, accessible, affordable, and adaptable. Those can either be commercial or DIY AID systems.

The point that Dr. Forlenza and I readily agree on is that we need MORE AID – not less.

This is why I support user choice for people with diabetes and for people who want – for any variety of reasons – to use a DIY system to be able to do so.

People probably want a black and white, clear answer on what is the ‘right’ type of AID system: DIY or commercial. It depends on whether a system is even AVAILABLE. Not all countries have regulatory-approved systems available, meaning commercial AID is not available everywhere. Some places and people are also limited by ACCESSIBILITY, because their healthcare providers won’t prescribe an AID system to them; or insurance won’t cover it. AFFORDABILITY, even if insurance coverage, also plays a role: commercial AID systems (and even pump and CGM components without AID) are expensive and not everyone can afford them. Finally, ADAPTABILITY matters for some people, and not all systems work well for everyone. The point is that we need a bigger overlap of these criteria! We need more alignment of these factors - more AID (DIY and commercial) available, accessible, affordable, and adaptable for people with diabetes. I support user choice for people with diabetes, which includes DIY AID systems

PS – I also presented a poster at #ADA2023 about the high prevalence rates of exocrine pancreatic insufficiency (EPI / PEI / PI) in Type 1 and Type 2 diabetes – you can find the poster and a summary of it here.

More Tools To Help Diabetes Researchers and Other Researchers

A few years ago I made a big deal about a tool I had created, converting someone’s web tool into a command line tool to be able to take complex json data and convert it to csv. Years later, I (and thousands of others, it’s been downloaded 1600+ times!) am still using this tool because there’s nothing better that I’ve found when you have data that you don’t know the data structure for or the data structure varies across files.

I ended up creating a repository on Github to store it with details on running it, and have expanded it over the last (almost) six years as I and others have added additional tools. For example, it’s where Arsalan, one of my frequent collaborators, and I store open source code from some of our recent papers.

Recently, I added two more small scripts. This was motivated to help researchers who have been successfully using the OpenAPS Data Commons and want to update their dataset with a later version of the data. Chances are, they have cleaned and worked with a previous version of the dataset, and instead of having to re-clean all of the data all over again, this set of scripts should help narrow down what the “new” data is that needs to be pulled out, cleaned, and appended to a previously cleaned dataset.

You can check out the full tool repository here (it has several other scripts in addition to the ones mentioned above). The latest are two python scripts that checks the content of an existing folder and lists out the memberID and filenames for each. This is useful to run on an existing, already-cleaned dataset to see what you currently have. It can also be run on the latest/newest/bigger dataset available. Then, the second script can be run to compare the memberIDs and file names in the newer/biggest/larger dataset against the previously cleaned/smaller/older dataset. Those that “match” already exist in the version of the dataset they have; they don’t need to be pulled again. The others don’t exist in the current dataset, and can be popped into a script to pull out just those data files to then be cleaned and appended to the existing dataset.

As a heads up specifically for those working with the OpenAPS Data Commons, it is best practice to name/describe the version of the dataset via the size. For example, you might be working with the n=88 or n=122 version of the dataset. If you used the above method, you would then describe it along the lines of taking and cleaning the n=122 version; selecting new files available from the n=183 version and appending them to the n=122 version; and the resulting dataset is n=(122+number of new files used).

Folks who access the n=183 version of the dataset and haven’t previously used a smaller version of the dataset can reference using the n=183 and clarifying how many files they ended up using, e.g. describing that they followed X method to clean the data starting from the n=183 version and their resulting dataset is n=166, for example.

It is important to clarify which version and size of the dataset is being used.

PS – this method works on other data file types, too! You’d change the variable/column header names in the script to update this for other cases.

Dealing With And Avoiding Chronic Disease Management Burnout

I’ve been thinking about juggling lately, especially as this year I’ve had to add a series of new habits and behaviors and medications to manage not one but two new chronic diseases. Getting one new chronic disease is hard; getting another is hard; and the challenges aren’t necessarily linear or exponential, and they’re not necessarily obvious up front.

But sometimes the challenges do compound over time.

In January when I started taking pancreatic enzyme replacement therapy (PERT) for exocrine pancreatic insufficiency (EPI or PEI), I had to teach myself to remember to take enzymes at every meal. Not just some time around the meal, but 100% every time before (by only a few minutes) or right at the start of the meal. With PERT, the timing matters for efficacy. I have a fast/short feedback loop – if I mis-time my enzymes or don’t take them, I get varying symptoms within a few hours that then bother me for the rest of the day, overnight, and into the next morning. So I’m very incentivized to take the enzymes and time them effectively when I eat. However, as I started to travel (my first trip out of the country since the pandemic started), I was nervous about trying to adapt to travel and being out of my routine at home where I’ve placed enzymes in visible eye sight of every location where I might consume food. Thankfully, that all went well and I managed not to forget taking enzymes when I ate and all was well. But I know I’m still building the habit of taking enzymes and eating, and that involves both always having enzymes with me and remembering to get them out and take them. It sounds like a trivial amount of things to remember, but this is added on top of everything else I’m doing for managing my health and well-being.

This includes other “simple” things like taking my allergy medications – because I’m allergic to cats (and we have them!), trees, dust, etc. And vitamins (I’m vitamin D deficient when I don’t take vitamin D).

And brushing my teeth and flossing.

You do that too, right? Or maybe you’re one of those people who struggle to remember to floss. It’s normal.

The list of well-being management gets kind of long when you think about all the every day activities and habits you have to help you stay at your best possible health.

Eat healthy! (You do that, right? 😉 )

Hydrate!

Exercise!

Etc.

I’ve also got the background habits of 20 years of living with diabetes: keeping my pump sites on my body; refilling the reservoir and changing the pump site every few days; making sure the insulin doesn’t get too hot or cold; making sure my CGM data isn’t too noisy; changing my CGM sensor when needed; estimating ballpark carbs and entering them and/or temporary targets to indicate exercise into my open source AID; keeping my AID powered; keeping my pump powered; keeping my phone – which has my CGM visibility on it – powered and nearby. Ordering supplies – batteries and pump sites and reservoirs and CGM transmitters and CGM sensors and insulin and glucagon.

Some of these are daily or every few days tasks; others are once or twice a month or every three months.

Those stack up sometimes where I need to refill a reservoir and oops, get another bottle of insulin out of the fridge which reminds me to make a note to check on my shipment of insulin which hasn’t arrived yet. I also need to change my pump site and my CGM sensor is expiring at bedtime so I need to also go ahead and change it so the CGM warmup period will be done by the time I go to sleep. I want to refill my reservoir and change the pump site after dinner since the dinner insulin is more effective on the existing site; I think of this as I pull my enzymes out to swallow as I start eating. I’ll do the CGM insertion when I do my pump site change. But the CGM warmup period is then in the after-dinner timeframe so I then have to keep an eye on things manually because my AID can’t function without CGM data so 2 hours (or more) of warmup means extra manual diabetes attention. While I’m doing that, I also need to remember to take my allergy medication and vitamin D, plus remembering to take my new thyroid medication at bedtime.

Any given day, that set of overlapping scenarios may be totally fine, and I don’t think anything of them.

On other days, where I might be stressed or overwhelmed by something else – even if it’s not health-related – that can make the above scenario feel overwhelmingly difficult.

One of the strategies I discussed in a previous post relative to planning travel or busy periods like holidays is trying to separate tasks in advance (like pre-filling a reservoir), so the action tasks (inserting a pump site and hooking it up to a new reservoir) don’t take as long. That works well, if you know the busy period is coming.

But sometimes you don’t have awareness of a forthcoming busy period and life happens. Or it’s not necessarily busy, per se, but you start to get overwhelmed and stressed and that leaks over into the necessary care and feeding of medical stuff, like managing pump sites and reservoirs and sensors and medication.

You might start negotiating with yourself: “do I really need to change that pump site today? It can wait until tomorrow”. Or you might wait until your reservoir actually hits the ‘0’ level (which isn’t fully 0; there’s a few units plus or minus some bubbles left) to refill it. Or other things like that, whether it’s not entering carbs into your pump or AID or not bolusing. Depending on your system/setup, those things may not be a big deal. And for a day or two, they’re likely not a big deal overall.

But falling into the rut of these becoming the new normal is not optimal – that’s burnout, and I try to avoid getting there.

When I start to have some of those thought patterns and recognize that I have begun negotiating with myself, I try to voice how I’m feeling to myself and my spouse or family or friends. I tell them I’m starting to feel “crispy” (around the edges) – indicating I’m not fully burnt out, but I could get all the way to burnout if I don’t temporarily change some things. (Or permanently, but often for me temporary shifts are effective.)

One of the first things I do is think through what is the bare minimum necessary care I need to take. I go above and beyond and optimize a LOT of things to get above-target outcomes in most areas. While I like to do those things, they’re not necessary. So I think through the list of necessary things, like: keeping a working pump site on my body; keeping insulin in a reservoir attached to my pump; keeping my CGM sensor working; and keeping my AID powered and nearby.

That then leaves a pile of tasks to consider:

  1. Not doing at all for ___ period of time
  2. Not doing myself but asking someone else to do for ____ period of time

And then I either ask or accept the offers of help I get to do some of those things.

When I was in high school and college, I would have weekends where I would ask my parents to help. They would take on the task of carb counting (or estimating) so I didn’t have to. (They also did HEAPS of work for years while I was on their insurance to order and keep supplies in the house and wrangle with insurance so I didn’t have to – that was huge background help that I greatly appreciated.)

Nowadays, there are still things I can and do get other people to help with. Sometimes it’s listening to me vent (with a clear warning that I’m just venting and don’t need suggestions); my parents often still fill that role for me! Since I’m now married and no longer living alone, Scott offers a lot of support especially during those times. Sometimes he fills reservoirs for me, or more often will bring me supplies from the cabinet or fridge to wherever I’m sitting (or even in bed so I don’t have to get up to go change my site). Or he’ll help evaluate and determine that something can wait until a later time to do (e.g. change pump site at another time). Sometimes I get him to open boxes for me and we re-organize how my supplies are to make them easier to grab and go.

Those are diabetes-specific examples, but I’ve also written about how helpful additional help can be sometimes for EPI too, especially with weighing and estimating macronutrient counts so I can figure out my PERT dosing. Or making food once I’ve decided what I want to eat, again so I can separate deciding what to eat and what the counts/dosing is from the action tasks of preparing or cooking the food.

For celiac, one of the biggest changes that has helped was Scott asking family members to load the “Find Me Gluten Free” app on their phone. That way, if we were going out to eat or finding a takeout option, instead of everyone ALWAYS turning to me and saying “what are the gluten free options?”, they could occasionally also skim the app to see what some of the obvious choices were, so I wasn’t always having to drive the family decision making on where to eat.

If you don’t have a chronic illness (or multiple chronic illnesses), these might not sound like a big deal. If you do (even if you have a different set of chronic disease(s)), maybe you recognize some of this.

There are estimates that people with diabetes make hundreds of decisions and actions a day for managing living with diabetes. Multiply that times 20 years. Ditto for celiac, for identifying and preparing and guarding against cross-contamination of said gluten-free food – multiply that work every day times 14 years. And now a year’s worth of *every* time I consider eating anything to estimate (with reading nutrition labels or calculating combinations based on food labels or weighing and googling and estimating compared to other nutrition labels) how much enzymes to take and remembering to swallow the right number of pills at the optimal times. Plus the moral and financial weight of deciding how to balance efficacy with cost of these enzymes. Plus several months now of an additional life-critical medication.

It’s so much work.

It’s easy to get outright burnt out, and common to start to feel a little “crispy” around the edges at times.

If you find yourself in this position, know that it’s normal.

You’re doing a lot, and you’re doing a great job to keep yourself alive.

You can’t do 110% all the time, though, so it is ok to figure out what is the bare minimum and some days throughout the year, just do that, so you can go back to 110%-ing it (or 100%-ing) the other days.

With practice, you will increasingly be able to spot patterns of scenarios or times of the year when you typically get crispy, and maybe you can eventually figure out strategies to adapt in advance (see me over here pre-filling reservoirs ahead of Thanksgiving last week and planning when I’d change my pump site and planning exactly what I would eat for 3 days).

TLDR:

  • Living with chronic disease is hard. And the more diseases you have, the harder it can be.
  • If you live with or love someone with chronic disease(s), ask them if you can help. If they’re venting, ask if they want you to listen (valuable!) or to let you know if at any point they want help brainstorming or for you to provide suggestions (helpful *if* desired and requested).
  • If you’re the one living with chronic disease(s), consider asking for help, even with small things. Don’t let your own judgment (“I should be able to do this!”) get in your way of asking for help. Try it for a day or for a weekend.
Dealing with and avoiding chronic disease burnout by Dana M. Lewis

Looking back at work and accomplishments in 2021

I decided to do a look back at the last year’s worth of work, in part because it was a(nother) weird year in the world and also because, if you’re interested in my work, unless you read every single Tweet, there may have been a few things you missed that are of interest!

In general, I set goals every year that stretch across personal and professional efforts. This includes a daily physical activity streak that coincides with my walking and running lots of miles this year in pursuit of my second marathon and first (50k) ultramarathon. It’s good for my mental and physical health, which is why I post almost daily updates to help keep myself accountable. I also set goals like “do something creative” which could be personal (last year, knitting a new niece a purple baby blanket ticked the box on this goal!) or professional. This year, it was primarily professional creativity that accomplished this goal (more on that below).

Here’s some specifics about goals I accomplished:

RUNNING

  • My initial goal was training ‘consistently and better’ than I did for my first marathon, with 400 miles as my stretch goal if I was successfully training for the marathon. (Otherwise, 200 miles for the year would be the goal without a marathon.) My biggest-ever running year in 2013 with my first marathon was 356 miles, so that was a good big goal for me. I achieved it in June!
  • I completed my second marathon in July, and PR’d by over half an hour.
  • I completed my first-ever ultramarathon, a 50k!
  • I re-set my mileage goal after achieving 400 miles..to 500..600…etc. I ultimately achieved the biggest-ever mileage goal I’ve ever hit and think I ever will hit: I ran 1,000 miles in a single year!
  • I wrote lots of details about my methods of running (primarily, run/walking) and running with diabetes here. If you’re looking for someone to cheer you on as you set a goal for daily activity, like walking, or learning to run, or returning to running…DM or @ me on Twitter (@DanaMLewis). I love to cheer people on as they work toward their activity goals! It helps keep me inspired, too, to keep aiming at my own goals.

CREATIVITY

  • My efforts to be creative were primarily on the professional side this year. The “Convening The Center” project ended up having 2 out of 3 of my things that I categorized as being creative. The first was the design of the digital activities and the experience of CTC overall (more about that here). The second were the items in the physical “kit” we mailed out to participants: we brainstormed and created custom playing cards and physical custom keychains. They were really fun to make, especially in partnership with our excellent project artist, Rebeka Ryvola, who did the actual design work!
  • My third “creative” endeavor was a presentation, but it was unlike the presentations I usually give. I was tasked to create a presentation that was “visually engaging” and would not involve showing my face in the presentation. I’ve linked to the video below in the presentation section, but it was a lot of work to think about how to create a visually and auditory focused presentation and try to make it engaging, and I’m proud of how it turned out!

RESEARCH AND PUBLICATIONS

  • This is where the bulk of my professional work sits right now. I continue to be a PI on the CREATE trial, the world’s first randomized control trial assessing open-source automated insulin delivery technology, including the algorithm Scott and I dreamed up and that I have been using every day for the past 7 years. The first data from the trial itself is forthcoming in 2022. 
  • Convening The Center also was a grant-funded project that we turned into research with a publication that we submitted, assessing more of what patients “do”, which is typically not assessed by researchers and those looking at patient engagement in research or innovation. Hopefully, the publication of the research article we just submitted will become a 2022 milestone! In the meantime, you can read our report from the project here (https://bit.ly/305iQ1W ), as this grant-funded project is now completed.
  • Goal-wise, I aim to generate a few publications every year. I do not work for any organization and I am not an academic. However, I come from a communications background and see the benefit of reaching different audiences where they are, which is why I write blog posts for the patient community and also seek to disseminate knowledge to the research and clinical communities through traditional peer-reviewed literature. You can see past years’ research articulated on my research page (DIYPS.org/research), but here’s a highlight of some of the 2021 publications:
  • Also, although I’m not a traditional academic researcher, I also participate in the peer review process and frequently get asked to peer-review submitted articles to a variety of journals. I skimmed my email and it looks like I completed (at least) 13 peer reviews, most of which included also reviewing subsequent revisions of those submitted articles. So it looks like my rate of peer reviewing (currently) is matching my rate of publishing. I typically get asked to review articles related to open-source or DIY diabetes technology (OpenAPS, AndroidAPS, Loop, Nightscout, and other efforts), citizen science in healthcare, patient-led research or patient engagement in research, digital health, and diabetes data science. If you’re submitting articles on that topic, you’re welcome to recommend me as a potential reviewer.

PRESENTATIONS

  • I continued to give a lot of virtual presentations this year, such as at conferences like the “Insulin100” celebration conference (you can see the copy I recorded of my conference presentation here). I keynoted at the European Patients Forum Congress as well as at ADA’s Precision Diabetes Medicine 2021; an invited talk ADA Scientific Sessions (session coverage here); the 2021 Federal Wearables Summit: (video here); and the BIH Clinician Scientist Symposium (video here), to name a few (but not all).
  • Additionally, as I mentioned, one of the presentations I’m most proud of was created for the Fall 2021 #DData Exchange event:

OTHER STUFF

I did quite a few other small projects that don’t fit neatly into the above categories.

One final thing I’m excited to share is that also in 2021, Amazon came out with a beta program for producing hardcover/hardback books, alongside the ability to print paperback books on demand (and of course Kindle). So, you can now buy a copy of my book about Automated Insulin Delivery: How artificial pancreas “closed loop” systems can aid you in living with diabetes in paperback, hardback, or on Kindle. (You can also, still, read it 100% for free online via your phone or desktop at ArtificialPancreasBook.com, or download a PDF for free to read on your device of choice. Thousands of people have downloaded the PDF!)

Now available in hardcover, the book about Automated Insulin Delivery by Dana M. Lewis

Poster and presentation content from @DanaMLewis at #ADA2020 and #DData20

In previous years (see 2019 and 2018), I mentioned sharing content from ADA Scientific Sessions (this year it’s #ADA2020) with those not physically present at the conference. This year, NO ONE is present at the event, and we’re all virtual! Even more reason to share content from the conference. :)

I contributed to and co-authored two different posters at Scientific Sessions this year:

  • “Multi-Timescale Interactions of Glucose and Insulin in Type 1 Diabetes Reveal Benefits of Hybrid Closed Loop Systems“ (poster 99-LB) along with Azure Grant and Lance Kriegsfeld, PhD.
  • “Do-It-Yourself Artificial Pancreas Systems for Type 1 Diabetes Reduce Hyperglycemia Without Increasing Hypoglycemia” (poster 988-P in category 12-D Clinical Therapeutics/New Technology—Insulin Delivery Systems), alongside Jennifer Zabinsky, MD MEng, Haley Howell, MSHI, Alireza Ghezavati, MD, Andrew Nguyen, PhD, and Jenise Wong, MD PhD.

And, while not a poster at ADA, I also presented the “AID-IRL” study funded by DiabetesMine at #DData20, held in conjunction with Scientific Sessions. A summary of the study is also included in this post.

First up, the biological rhythms poster, “Multi-Timescale Interactions of Glucose and Insulin in Type 1 Diabetes Reveal Benefits of Hybrid Closed Loop Systems” (poster 99-LB). (Twitter thread summary of this poster here.)

Building off our work as detailed last year, Azure, Lance, and I have been exploring the biological rhythms in individuals living with type 1 diabetes. Why? It’s not been done before, and we now have the capabilities thanks to technology (pumps, CGM, and closed loops) to better understand how glucose and insulin dynamics may be similar or different than those without diabetes.

Background:

Mejean et al., 1988
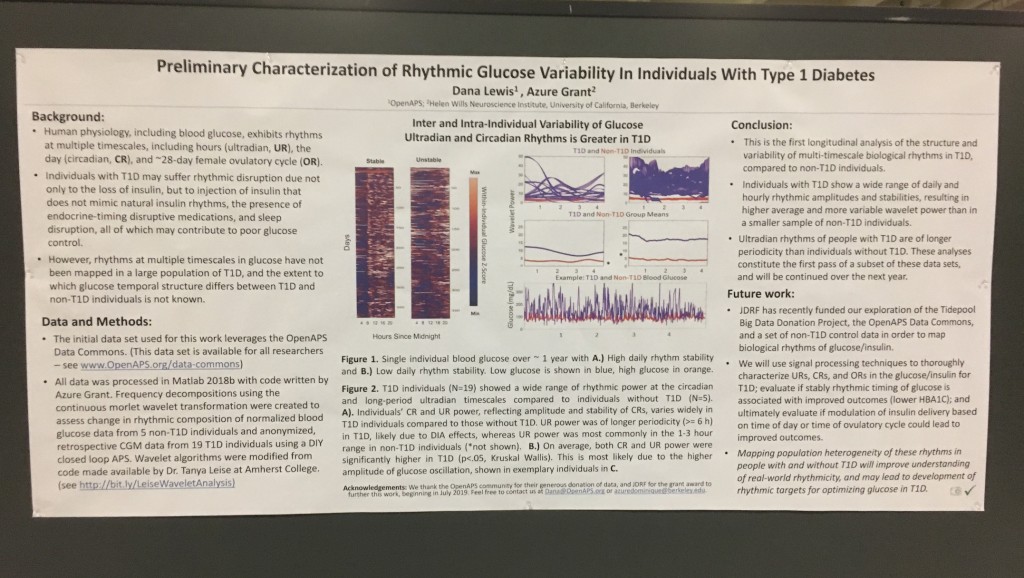
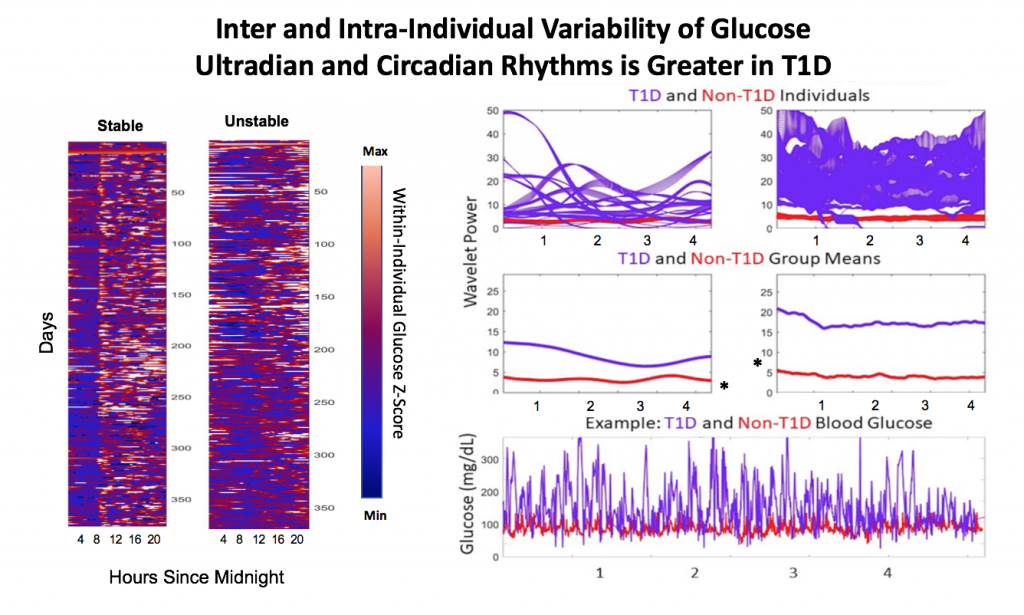
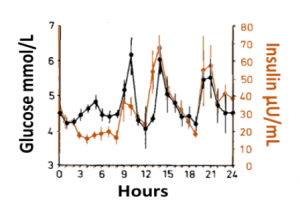
Blood glucose and insulin exhibit coupled biological rhythms at multiple timescales, including hours (ultradian, UR) and the day (circadian, CR) in individuals without diabetes. The presence and stability of these rhythms are associated with healthy glucose control in individuals without diabetes. (See right, adapted from Mejean et al., 1988).

However, biological rhythms in longitudinal (e.g., months to years) data sets of glucose and insulin outputs have not been mapped in a wide population of people with Type 1 Diabetes (PWT1D). It is not known how glucose and insulin rhythms compare between T1D and non-T1D individuals. It is also unknown if rhythms in T1D are affected by type of therapy, such as Sensor Augmented Pump (SAP) vs. Hybrid Closed Loop (HCL). As HCL systems permit feedback from a CGM to automatically adjust insulin delivery, we hypothesized that rhythmicity and glycemia would exhibit improvements in HCL users compared to SAP users. We describe longitudinal temporal structure in glucose and insulin delivery rate of individuals with T1D using SAP or HCL systems in comparison to glucose levels from a subset of individuals without diabetes.

Data collection and analysis:

We assessed stability and amplitude of normalized continuous glucose and insulin rate oscillations using the continuous wavelet transformation and wavelet coherence. Data came from 16 non-T1D individuals (CGM only, >2 weeks per individual) from the Quantified Self CGM dataset and 200 (n = 100 HCL, n = 100 SAP; >3 months per individual) individuals from the Tidepool Big Data Donation Project. Morlet wavelets were used for all analyses. Data were analyzed and plotted using Matlab 2020a and Python 3 in conjunction with in-house code for wavelet decomposition modified from the “Jlab” toolbox, from code developed by Dr. Tanya Leise (Leise 2013), and from the Wavelet Coherence toolkit by Dr. Xu Cui. Linear regression was used to generate correlations, and paired t-tests were used to compare AUC for wavelet and wavelet coherences by group (df=100). Stats used 1 point per individual per day.

Wavelets Assess Glucose and Insulin Rhythms and Interactions

Wavelet Coherence flow for glucose and insulin

Morlet wavelets (A) estimate rhythmic strength in glucose or insulin data at each minute in time (a combination of signal amplitude and oscillation stability) by assessing the fit of a wavelet stretched in window and in the x and y dimensions to a signal (B). The output (C) is a matrix of wavelet power, periodicity, and time (days). Transform of example HCL data illustrate the presence of predominantly circadian power in glucose, and predominantly 1-6 h ultradian power in insulin. Color map indicates wavelet power (synonymous with Y axis height). Wavelet coherence (D) enables assessment of rhythmic interactions between glucose and insulin; here, glucose and insulin rhythms are highly correlated at the 3-6 (ultradian) and 24 (circadian) hour timescales.

Results:

Hybrid Closed Loop Systems Reduce Hyperglycemia

Glucose distribution of SAP, HCL, and nonT1D
  • A) Proportional counts* of glucose distributions of all individuals with T1D using SAP (n=100) and HCL (n=100) systems. SAP system users exhibit a broader, right shifted distribution in comparison to individuals using HCL systems, indicating greater hyperglycemia (>7.8 mmol/L). Hypoglycemic events (<4mmol/L) comprised <5% of all data points for either T1D dataset.
  • B) Proportional counts* of non-T1D glucose distributions. Although limited in number, our dataset from people without diabetes exhibits a tighter blood glucose distribution, with the vast majority of values falling in euglycemic range (n=16 non-T1D individuals).
  • C) Median distributions for each dataset.
  • *Counts are scaled such that each individual contributes the same proportion of total data per bin.

HCL Improves Correlation of Glucose-Insulin Level & Rhythm

Glucose and Insulin rhythms in SAP and HCL

SAP users exhibit uncorrelated glucose and insulin levels (A) (r2 =3.3*10-5; p=0.341) and uncorrelated URs of glucose and insulin (B) (r2 =1.17*10-3; p=0.165). Glucose and its rhythms take a wide spectrum of values for each of the standard doses of insulin rates provided by the pump, leading to the striped appearance (B). By contrast, Hybrid Closed Loop users exhibit correlated glucose and insulin levels (C) (r2 =0.02; p=7.63*10-16), and correlated ultradian rhythms of glucose and insulin (D) (r2 =-0.13; p=5.22*10-38). Overlays (E,F).

HCL Results in Greater Coherence than SAP

Non-T1D individuals have highly coherent glucose and insulin at the circadian and ultradian timescales (see Mejean et al., 1988, Kern et al., 1996, Simon and Brandenberger 2002, Brandenberger et al., 1987), but these relationships had not previously been assessed long-term in T1D.

coherence between glucose and insulin in HCL and SAP, and glucose swings between SAP, HCL, and non-T1D
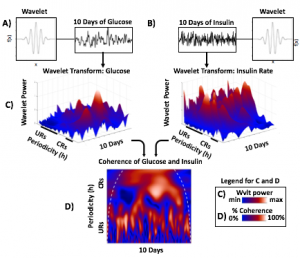
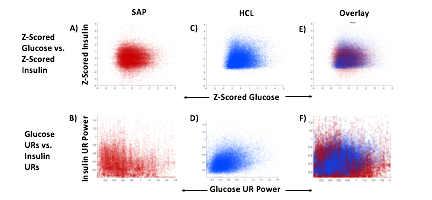
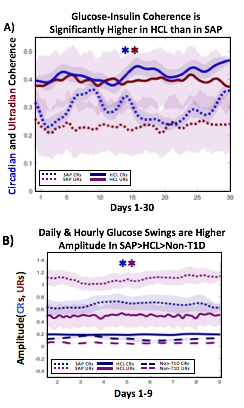
A) Circadian (blue) and 3-6 hour ultradian (maroon) coherence of glucose and insulin in HCL (solid) and SAP (dotted) users. Transparent shading indicates standard deviation. Although both HCL and SAP individuals have lower coherence than would be expected in a non-T1D individual,  HCL CR and UR coherence are significantly greater than SAP CR and UR coherence (paired t-test p= 1.51*10-7 t=-5.77 and p= 5.01*10-14 t=-9.19, respectively). This brings HCL users’ glucose and insulin closer to the canonical non-T1D phenotype than SAP users’.

B) Additionally, the amplitude of HCL users’ glucose CRs and URs (solid) is closer (smaller) to that of non-T1D (dashed) individuals than are SAP glucose rhythms (dotted). SAP CR and UR amplitude is significantly higher than that of HCL or non-T1D (T-test,1,98, p= 47*10-17 and p= 5.95*10-20, respectively), but HCL CR amplitude is not significantly different from non-T1D CR amplitude (p=0.61).

Together, HCL users are more similar than SAP users to the canonical Non-T1D phenotype in A) rhythmic interaction between glucose and insulin and B) glucose rhythmic amplitude.

Conclusions and Future Directions

T1D and non-T1D individuals exhibit different relative stabilities of within-a-day rhythms and daily rhythms in blood glucose, and T1D glucose and insulin delivery rhythmic patterns differ by insulin delivery system.

Hybrid Closed Looping is Associated With:

  • Lower incidence of hyperglycemia
  • Greater correlation between glucose level and insulin delivery rate
  • Greater correlation between ultradian glucose and ultradian insulin delivery rhythms
  • Greater degree of circadian and ultradian coherence between glucose and insulin delivery rate than in SAP system use
  • Lower amplitude swings at the circadian and ultradian timescale

These preliminary results suggest that HCL recapitulates non-diabetes glucose-insulin dynamics to a greater degree than SAP. However, pump model, bolusing data, looping algorithms and insulin type likely all affect rhythmic structure and will need to be further differentiated. Future work will determine if stability of rhythmic structure is associated with greater time in range, which will help determine if bolstering of within-a-day and daily rhythmic structure is truly beneficial to PWT1D.
Acknowledgements:

Thanks to all of the individuals who donated their data as part of the Tidepool Big Data Donation Project, as well as the OpenAPS Data Commons, from which data is also being used in other areas of this study. This study is supported by JDRF (1-SRA-2019-821-S-B).

(You can download a full PDF copy of the poster here.)

Next is “Do-It-Yourself Artificial Pancreas Systems for Type 1 Diabetes Reduce Hyperglycemia Without Increasing Hypoglycemia” (poster 988-P in category 12-D Clinical Therapeutics/New Technology—Insulin Delivery Systems), which I co-authored alongside Jennifer Zabinsky, MD MEng, Haley Howell, MSHI, Alireza Ghezavati, MD, Andrew Nguyen, PhD, and Jenise Wong, MD PhD. There is a Twitter thread summarizing this poster here.

This was a retrospective double cohort study that evaluated data from the OpenAPS Data Commons (data ranged from 2017-2019) and compared it to conventional sensor-augmented pump (SAP) therapy from the Tidepool Big Data Donation Project.

Methods:

  • From the OpenAPS Data Commons, one month of CGM data (with more than 70% of the month spent using CGM), as long as they were >1 year of living with T1D, was used. People could be using any type of DIYAPS (OpenAPS, Loop, or AndroidAPS) and there were no age restrictions.
  • A random age-matched sample from the Tidepool Big Data Donation Project of people with type 1 diabetes with SAP was selected.
  • The primary outcome assessed was percent of CGM data <70 mg/dL.
  • The secondary outcomes assessed were # of hypoglycemic events per month (15 minutes or more <70 mg/dL); percent of time in range (70-180mg/dL); percent of time above range (>180mg/dL), mean CGM values, and coefficient of variation.
Methods_DIYAPSvsSAP_ADA2020_DanaMLewis

Demographics:

  • From Table 1, this shows the age of participants was not statistically different between the DIYAPS and SAP cohorts. Similarly, the age at T1D diagnosis or time since T1D diagnosis did not differ.
  • Table 2 shows the additional characteristics of the DIYAPS cohort, which included data shared by a parent/caregiver for their child with T1D. DIYAPS use was an average of 7 months, at the time of the month of CGM used for the study. The self-reported HbA1c in DIYAPS was 6.4%.
Demographics_DIYAPSvsSAP_ADA2020_DanaMLewis DIYAPS_Characteristics_DIYAPSvsSAP_ADA2020_DanaMLewis

Results:

  • Figure 1 shows the comparison in outcomes based on CGM data between the two groups. Asterisks (*) indicate statistical significance.
  • There was no statistically significant difference in % of CGM values below 70mg/dL between the groups in this data set sampled.
  • DIYAPS users had higher percent in target range and lower percent in hyperglycemic range, compared to the SAP users.
  • Table 3 shows the secondary outcomes.
  • There was no statistically significant difference in the average number of hypoglycemic events per month between the 2 groups.
  • The mean CGM glucose value was lower for the DIYAPS group, but the coefficient of variation did not differ between groups.
CGM_Comparison_DIYAPSvsSAP_ADA2020_DanaMLewis SecondaryOutcomes_DIYAPSvsSAP_ADA2020_DanaMLewis

Conclusions:

    • Users of DIYAPS (from this month of sampled data) had a comparable amount of hypoglycemia to those using SAP.
    • Mean CGM glucose and frequency of hyperglycemia were lower in the DIYAPS group.
    • Percent of CGM values in target range (70-180mg/dL) was significantly greater for DIYAPS users.
    • This shows a benefit in DIYAPS in reducing hyperglycemia without compromising a low occurrence of hypoglycemia. 
Conclusions_DIYAPSvsSAP_ADA2020_DanaMLewis

(You can download a PDF of the e-poster here.)

Finally, my presentation at this year’s D-Data conference (#DData20). The study I presented, called AID-IRL, was funded by Diabetes Mine. You can see a Twitter thread summarizing my AID-IRL presentation here.

AID-IRL-Aim-Methods_DanaMLewis

I did semi-structured phone interviews with 7 users of commercial AID systems in the last few months. The study was funded by DiabetesMine – both for my time in conducting the study, as well as funding for study participants. Study participants received $50 for their participation. I sought a mix of longer-time and newer AID users, using a mix of systems. Control-IQ (4) and 670G (2) users were interviewed; as well as (1) a CamAPS FX user since it was approved in the UK during the time of the study.

Based on the interviews, I coded their feedback for each of the different themes of the study depending on whether they saw improvements (or did not have issues); had no changes but were satisfied, or neutral experiences; or saw negative impact/experience. For each participant, I reviewed their experience and what they were happy with or frustrated by.

Here are some of the details for each participant.

AID-IRL-Participant1-DanaMLewisAID-IRL-Participant1-cont_DanaMLewis
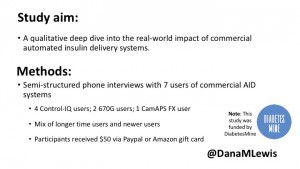
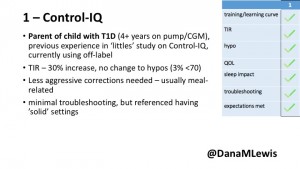
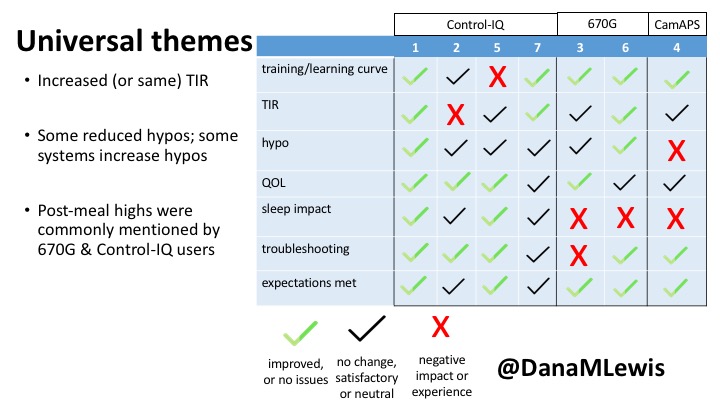
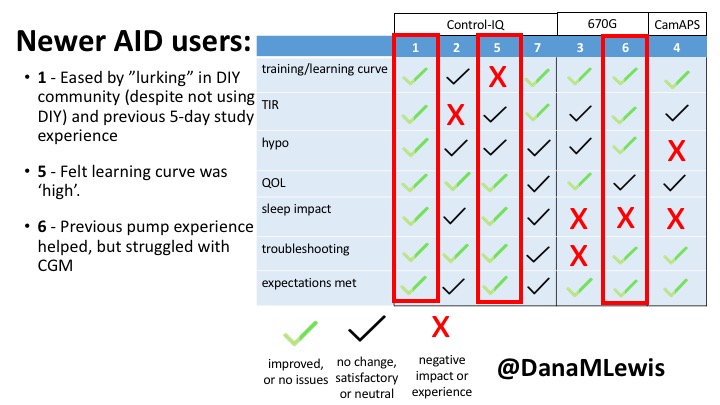
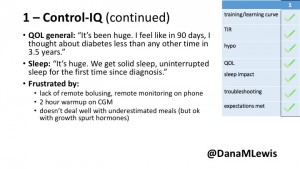
1 – A parent of a child using Control-IQ (off-label), with 30% increase in TIR with no increased hypoglycemia. They spend less time correcting than before; less time thinking about diabetes; and “get solid uninterrupted sleep for the first time since diagnosis”. They wish they had remote bolusing, more system information available in remote monitoring on phones. They miss using the system during the 2 hour CGM warmup, and found the system dealt well with growth spurt hormones but not as well with underestimated meals.

AID-IRL-Participant2-DanaMLewis AID-IRL-Participant2-cont-DanaMLewis
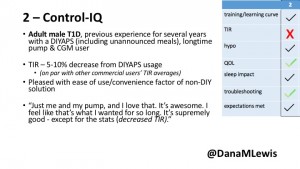
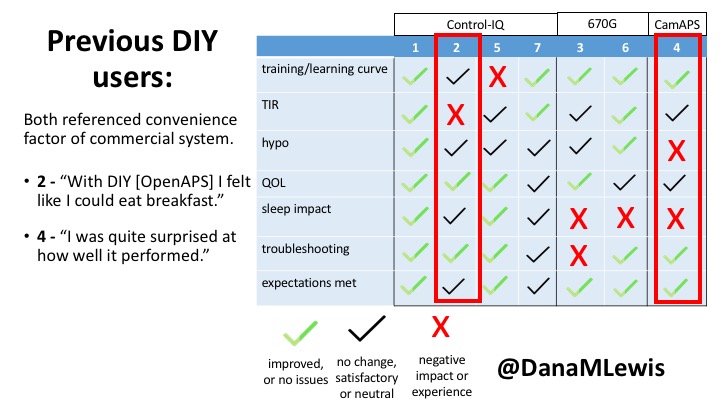
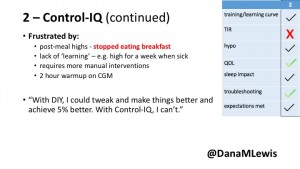
2 – An adult male with T1D who previously used DIYAPS saw 5-10% decrease in TIR (but it’s on par with other participants’ TIR) with Control-IQ, and is very pleased by the all-in-one convenience of his commercial system.He misses autosensitivity (a short-term learning feature of how insulin needs may very from base settings) from DIYAPS and has stopped eating breakfast, since he found it couldn’t manage that well. He is doing more manual corrections than he was before.

AID-IRL-Participant5-DanaMLewis AID-IRL-Participant5-cont_DanaMLewis
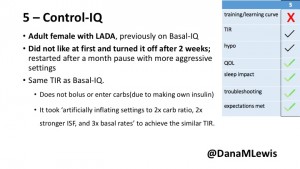
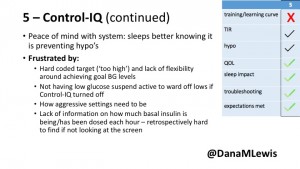
5 – An adult female with LADA started, stopped, and started using Control-IQ, getting the same TIR that she had before on Basal-IQ. It took artificially inflating settings to achieve these similar results. She likes peace of mind to sleep while the system prevents hypoglycemia. She is frustrated by ‘too high’ target; not having low prevention if she disables Control-IQ; and how much she had to inflate settings to achieve her outcomes. It’s hard to know how much insulin the system gives each hour (she still produces some of own insulin).

AID-IRL-Participant7-DanaMLewis AID-IRL-Participant7-cont-DanaMLewis
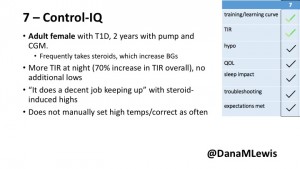
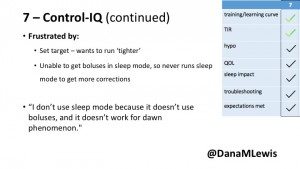
7 – An adult female with T1D who frequently has to take steroids for other reasons, causing increased BGs. With Control-IQ, she sees 70% increase in TIR overall and increased TIR overnight, and found it does a ‘decent job keeping up’ with steroid-induced highs. She also wants to run ‘tighter’ and have an adjustable target, and does not ever run in sleep mode so that she can always get the bolus corrections that are more likely to bring her closer to target.

AID-IRL-Participant3-DanaMLewis AID-IRL-Participant3-cont-DanaMLewis
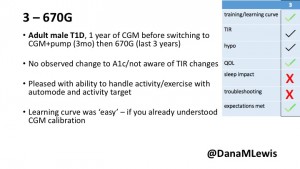
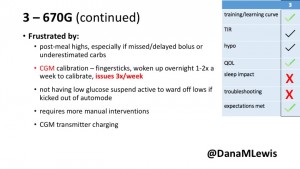
3 – An adult male with T1D using 670G for 3 years didn’t observe any changes to A1c or TIR, but is pleased with his outcomes, especially with the ability to handle his activity levels by using the higher activity target.  He is frustrated by the CGM and is woken up 1-2x a week to calibrate overnight. He wishes he could still have low glucose suspend even if he’s kicked out of automode due to calibration issues. He also commented on post-meal highs and more manual interventions.

AID-IRL-Participant6-DanaMLewis AID-IRL-Participant6-contDanaMLewis
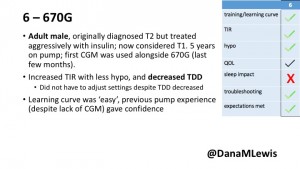
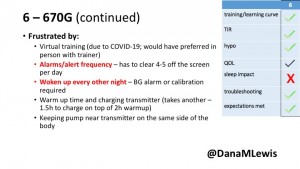
6 – Another adult male user with 670G was originally diagnosed with T2 (now considered T1) with a very high total daily insulin use that was able to decrease significantly when switching to AID. He’s happy with increased TIR and less hypo, plus decreased TDD. Due to #COVID19, he did virtually training but would have preferred in-person. He has 4-5 alerts/day and is woken up every other night due to BG alarms or calibration. He does not like the time it takes to charge CGM transmitter, in addition to sensor warmup.

AID-IRL-Participant4-DanaMLewis AID-IRL-Participant4-contDanaMLewis
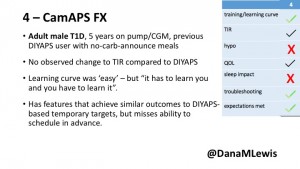
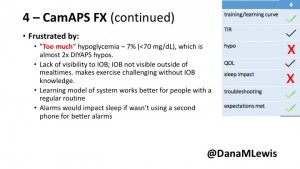
4 – The last participant is an adult male with T1 who previously used DIYAPS but was able to test-drive the CamAPS FX. He saw no TIR change to DIYAPS (which pleased him) and thought the learning curve was easy – but he had to learn the system and let it learn him. He experienced ‘too much’ hypoglycemia (~7% <70mg/dL, 2x his previous), and found it challenging to not have visibility of IOB. He also found the in-app CGM alarms annoying. He noted the system may work better for people with regular routines.

You can see a summary of the participants’ experiences via this chart. Overall, most cited increased or same TIR. Some individuals saw reduced hypos, but a few saw increases. Post-meal highs were commonly mentioned.

AID-IRL-UniversalThemes2-DanaMLewis AID-IRL-UniversalThemes-DanaMLewis

Those newer to CGM have a noticeable learning curve and were more likely to comment on number of alarms and system alerts they saw. The 670G users were more likely to describe connection/troubleshooting issues and CGM calibration issues, both of which impacted sleep.

This view highlights those who more recently adopted AID systems. One noted their learning experience was ‘eased’ by “lurking” in the DIY community, and previously participating in an AID study. One felt the learning curve was high. Another struggled with CGM.

AID-IRL-NewAIDUsers-DanaMLewis

Both previous DIYAPS users who were using commercial AID systems referenced the convenience factor of commercial systems. One DIYAPS saw decreased TIR, and has also altered his behaviors accordingly, while the other saw no change to TIR but had increased hypo’s.

AID-IRL-PreviousDIYUsers-DanaMLewis

Companies building AID systems for PWDs should consider that the onboarding and learning curve may vary for individuals, especially those newer to CGM. Many want better displays of IOB and the ability to adjust targets. Remote bolusing and remote monitoring is highly desired by all, regardless of age. Post-prandial was frequently mentioned as the weak point in glycemic control of commercial AID systems. Even with ‘ideal’ TIR, many commercial users still are doing frequent manual corrections outside of mealtimes. This is an area of improvement for commercial AID to further reduce the burden of managing diabetes.

AID-IRL-FeedbackForCompanies-DanaMLewis

Note – all studies have their limitations. This was a small deep-dive study that is not necessarily representative, due to the design and small sample size. Timing of system availability influenced the ability to have new/longer time users.

AID-IRL-Limitations-DanaMLewis

Thank you to all of the participants of the study for sharing their feedback about their experiences with AID-IRL!

(You can download a PDF of my slides from the AID-IRL study here.)

Have questions about any of my posters or presentations? You can always reach me via email at Dana@OpenAPS.org.

Presentations and poster content from @DanaMLewis at #ADA2019

Like I did last year, I want to share the work being presented at #ADA2019 with those who are not physically there! (And if you’re presenting at #ADA2019 or another conference and would like suggestions on how to share your content in addition to your poster or presentation, check out these tips.) This year, I’m co-author on three posters and an oral presentation.

  • 1056-P in category 12-D Clinical Therapeutics/New Technology–Insulin Delivery Systems, Preliminary Characterization of Rhythmic Glucose Variability In Individuals With Type 1 Diabetes, co-authored by Dana Lewis and Azure Grant.
    • Come see us at the poster session, 12-1pm on Sunday! Dana & Azure will be presenting this poster.
  • 76-OR, In-Depth Review of Glycemic Control and Glycemic Variability in People with Type 1 Diabetes Using Open Source Artificial Pancreas Systems, co-authored by Andreas Melmer, Thomas Züger, Dana Lewis, Scott Leibrand, Christoph Stettler, and Markus Laimer.
    • Come hear our presentation in room S-157 (South, Upper Mezzanine Level), 2:15-2:30 pm on Saturday!
  • 117-LB, DIWHY: Factors Influencing Motivation, Barriers and Duration of DIY Artificial Pancreas System Use Among Real-World Users, co-authored by Katarina Braune, Shane O’Donnell, Bryan Cleal, Ingrid Willaing, Adrian Tappe, Dana Lewis, Bastian Hauck, Renza Scibilia, Elizabeth Rowley, Winne Ko, Geraldine Doyle, Tahar Kechadi, Timothy C. Skinner, Klemens Raille, and the OPEN consortium.
    • Come see us at the poster session, 12-1pm on Sunday! Scott will be presenting this poster.
  • 78-LB, Detailing the Lived Experiences of People with Diabetes Using Do-it-Yourself Artificial Pancreas Systems – Qualitative Analysis of Responses to Open-Ended Items in an International Survey, co-authored by Bryan Cleal, Shane O’Donnell, Katarina Braune, Dana Lewis, Timothy C. Skinner, Bastian Hauck, Klemens Raille, and the OPEN consortium.
    • Come see us at the poster session, 12-1pm on Sunday! Bryan Cleal will be presenting this poster.

See below for full written summaries and pictures from each poster and the oral presentation.

First up: the biological rhythms poster, formally known as 1056-P in category 12-D Clinical Therapeutics/New Technology–Insulin Delivery Systems, Preliminary Characterization of Rhythmic Glucose Variability In Individuals With Type 1 Diabetes!

Lewis_Grant_BiologicalRhythmsT1D_ADA2019

As mentioned in this DiabetesMine interview, Azure Grant & I were thrilled to find out that we have been awarded a JDRF grant to further this research and undertake the first longitudinal study to characterize biological rhythms in T1D, which could also be used to inform improvements and personalize closed loop systems. This poster is part of the preliminary research we did in order to submit for this grant.

There is also a Twitter thread for this poster:

Poster from #ADA2019

Background:

  • Human physiology, including blood glucose, exhibits rhythms at multiple timescales, including hours (ultradian, UR), the day (circadian, CR), and the ~28-day female ovulatory cycle (OR).
  • Individuals with T1D may suffer rhythmic disruption due not only to the loss of insulin, but to injection of insulin that does not mimic natural insulin rhythms, the presence of endocrine-timing disruptive medications, and sleep disruption.
  • However, rhythms at multiple timescales in glucose have not been mapped in a large population of T1D, and the extent to which glucose rhythms differ in temporal structure between T1D and non-T1D individuals is not known.

Data & Methods:

  • The initial data set used for this work leverages the OpenAPS Data Commons. (This data set is available for all researchers  – see www.OpenAPS.org/data-commons)
  • All data was processed in Matlab 2018b with code written by Azure Grant. Frequency decompositions using the continuous morlet wavelet transformation were created to assess change in rhythmic composition of normalized blood glucose data from 5 non-T1D individuals and anonymized, retrospective CGM data from 19 T1D individuals using a DIY closed loop APS. Wavelet algorithms were modified from code made available by Dr. Tanya Leise at Amherst College (see http://bit.ly/LeiseWaveletAnalysis)

Results:

  • Inter and Intra-Individual Variability of Glucose Ultradian and Circadian Rhythms is Greater in T1D
Figure_BiologicalRhythms_Lewis_Grant_ADA2019

Figure 1. Single individual blood glucose over ~ 1 year with A.) High daily rhythm stability and B.) Low daily rhythm stability. Low glucose is shown in blue, high glucose in orange.

Figure 2. T1D individuals (N=19) showed a wide range of rhythmic power at the circadian and long-period ultradian timescales compared to individuals without T1D (N=5).

A). Individuals’ CR and UR power, reflecting amplitude and stability of CRs, varies widely in T1D individuals compared to those without T1D. UR power was of longer periodicity (>= 6 h) in T1D, likely due to DIA effects, whereas UR power was most commonly in the 1-3 hour range in non-T1D individuals (*not shown).  B.) On average, both CR and UR power were significantly higher in T1D (p<.05, Kruskal Wallis). This is most likely due to the higher amplitude of glucose oscillation, shown in two individuals in C.

Conclusions:

  • This is the first longitudinal analysis of the structure and variability of multi-timescale biological rhythms in T1D, compared to non-T1D individuals.
  • Individuals with T1D show a wide range of circadian and ultradian rhythmic amplitudes and stabilities, resulting in higher average and more variable wavelet power than in a smaller sample of non-T1D individuals.
  • Ultradian rhythms of people with T1D are of longer periodicity than individuals without T1D. These analyses constitute the first pass of a subset of these data sets, and will be continued over the next year.

Future work:

  • JDRF has recently funded our exploration of the Tidepool Big Data Donation Project, the OpenAPS Data Commons, and a set of non-T1D control data in order to map biological rhythms of glucose/insulin.
  • We will use signal processing techniques to thoroughly characterize URs, CRs, and ORs in the glucose/insulin for T1D; evaluate if stably rhythmic timing of glucose is associated with improved outcomes (lower HBA1C); and ultimately evaluate if modulation of insulin delivery based on time of day or time of ovulatory cycle could lead to improved outcomes.
  • Mapping population heterogeneity of these rhythms in people with and without T1D will improve understanding of real-world rhythmicity, and may lead to non-linear algorithms for optimizing glucose in T1D.

Acknowledgements:

We thank the OpenAPS community for their generous donation of data, and JDRF for the grant award to further this work, beginning in July 2019.

Contact:

Feel free to contact us at Dana@OpenAPS.org or azuredominique@berkeley.edu.

Next up, 78-LB, Detailing the Lived Experiences of People with Diabetes Using Do-it-Yourself Artificial Pancreas Systems – Qualitative Analysis of Responses to Open-Ended Items in an International Survey, co-authored by Bryan Cleal, Shane O’Donnell, Katarina Braune, Dana Lewis, Timothy C. Skinner, Bastian Hauck, Klemens Raille, and the OPEN consortium.

78-LB_LivedExperiencesDIYAPS_OPEN_ADA2019

There is also a Twitter thread for this poster:

Poster from OPEN survey on lived experiences

Introduction

There is currently a wave of interest in Do-it-Yourself Artificial Pancreas Systems (DIYAPS), but knowledge about how the use of these systems impacts on the lives of those that build and use them remains limited. Until now, only a select few have been able to give voice to their experiences in a research context. In this study we present data that addresses this shortcoming, detailing the lived experiences of people using DIYAPS in an extensive and diverse way.

Methods

An online survey with 34 items was distributed to DIYAPS users recruited through the Facebook groups “Looped” (and regional sub-groups) and Twitter pages of the Diabetes Online Community (DOC). Participants were posed two open-ended questions in the survey, where personal DIYAPS stories were garnered; including knowledge acquisition, decision-making, support and emotional aspects in the initiation of DIYAPS, perceived changes in clinical and quality of life (QoL) outcomes after initiation and difficulties encountered in the process. All answers were analyzed using thematic content analysis.

Results

In total, 886 adults responded to the survey and there were a combined 656 responses to the two open-ended items. Knowledge of DIYAPS was primarily obtained via exposure to the communication fora that constitute the DOC. The DOC was also a primary source of practical and emotional support (QUOTES A). Dramatic improvements in clinical and QoL outcomes were consistently reported (QUOTES B). The emotional impact was overwhelmingly positive, with participants emphasizing that the persistent presence of diabetes in everyday life was markedly reduced (QUOTES C). Acquisition of the requisite devices to initiate DIYAPS was sometimes problematic and some people did find building the systems to be technically challenging (QUOTE D). Overcoming these challenges did, however, leave people with a sense of accomplishment and, in some cases, improved levels of understanding and engagement with diabetes management (QUOTE E).

QuotesA_OPEN_ADA2019 QuotesB_OPEN_ADA2019 QuotesC_OPEN_ADA2019 QuotesD_OPEN_ADA2019 QuotesE_OPEN_ADA2019

Conclusion

The extensive testimony from users of DIYAPS acquired in this study provides new insights regarding the contours of this evolving phenomenon, highlighting factors inspiring people to adopt such solutions and underlining the transformative impact effective closed-loop systems bring to bear on the everyday lives of people with diabetes. Although DIYAPS is not a viable solution for everyone with type 1 diabetes, there is much to learn from those who have taken this route, and the life-changing results they have achieved should inspire all with an interest in artificial pancreas technology to pursue and dream of a future where all people with type 1 diabetes can reap the benefits that it potentially provides.

Also, see this word cloud generated from 665 responses in the two open-ended questions in the survey:

Wordle_OPEN_ADA2019

Next up is 117-LB, DIWHY: Factors Influencing Motivation, Barriers and Duration of DIY Artificial Pancreas System Use Among Real-World Users, co-authored by Katarina Braune, Shane O’Donnell, Bryan Cleal, Ingrid Willaing, Adrian Tappe, Dana Lewis, Bastian Hauck, Renza Scibilia, Elizabeth Rowley, Winne Ko, Geraldine Doyle, Tahar Kechadi, Timothy C. Skinner, Klemens Raille, and the OPEN consortium.

DIWHY_117-LB_OPEN_ADA2019

There is also a Twitter thread for this poster:

DIWHY Poster at ADA2019

Background

Until recently, digital innovations in healthcare have typically followed a ‘top-down’ pathway, with manufacturers leading the design and production of technology-enabled solutions and patients involved only as users of the end-product. However, this is now being disrupted by the increasing influence and popularity of more ‘bottom-up’ and patient-led open source initiatives. A primary example is the growing movement of people with diabetes (PwD) who create their own “Do-it-Yourself” Artificial Pancreas Systems (DIY APS) through remote-control of medical devices employing an open source algorithm.

Objective

Little is known about why PwD leave traditional care pathways and turn to DIY technology. This study aims to examine the motivations of current DIYAPS users and their caregivers.

Research Design and Methods

An online survey with 34 items was distributed to DIYAPS users recruited through the Facebook groups “Looped” (and regional sub-groups) and Twitter pages of the “DOC” (Diabetes Online Community). Self-reported data was collected, managed and analyzed using the secure REDCap electronic data capture tools hosted at Charité – Universitaetsmedizin Berlin.

Results

1058 participants from 34 countries (81.3 % Europe, 14.7 % North America, 6.0 % Australia/WP, 3.1 % Asia, 0.1 % Africa), responded to the survey, of which the majority were adults (80.2 %) with type 1 diabetes (98.9 %) using a DIY APS themselves (43.0 % female, 56.8 % male, 0.3 % other) with a median age of 41 y and an average diabetes duration of 25.2y ±13.3. 19.8 % of the participants were parents and/or caregivers of children with type 1 diabetes (99.4 %) using a DIY APS (47.4 % female, 52.6 % male) with a median age of 10 y and an average diabetes duration of 5.1y ± 3.8. People used various DIYAPS (58.2 % AndroidAPS, 28.5 % Loop, 18.8 % OpenAPS, 5.7 % other) on average for a duration of 10.1 months ±17.6 and reported an overall HbA1c-improvement of -0.83 % (from 7.07 % ±1.07 to 6.24 % ±0.68 %) and an overall Time in Range improvement of +19.86 % (from 63.21 % ±16.27 to 83.07 % ±10.11). Participants indicated that DIY APS use required them to pay out-of-pocket costs in addition to their standard healthcare expenses with an average amount of 712 USD spent per year.

Primary motivations for building a DIYAPS were to improve the overall glycaemic control, reduce acute and long-term complication risk, increase life expectancy and to put diabetes on ‘auto-pilot’ and interact less frequently with the system. Lack of commercially available closed loop systems and improvement of sleep quality was a motivation for some. For caregivers, improvement of their own sleep quality was the leading motivation. For adults, curiosity (medical or technical interest) had a higher impact on their motivation compared to caregivers. Some people feel that commercial systems do not suit their individual needs and prefer to use a customizable system, which is only available to them as a DIY solution. Other reasons, like costs of commercially available systems and unachieved therapy goals played a subordinate role. Lack of medical or psychosocial support was less likely to be motivating factors for both groups.

Figure_OPEN_DIWHY_ADA2019

Conclusions

Our findings suggest that people using Do-it-Yourself Artificial Pancreas systems and their caregivers are highly motivated to improve their/their children’s diabetes management through the use of this novel technology. They are also able to access and afford the tools needed to use these systems. Currently approved and available commercial therapy options may not be sufficiently flexible or customizable enough to fulfill their individual needs. As part of the project “OPEN”, the results of the DIWHY survey may contribute to a better understanding of the unmet needs of PwD and current challenges to uptake, which will, in turn, facilitate dialogue and collaboration to strengthen the involvement of open source approaches in healthcare.

This is a written version of the oral presentation, In-Depth Review of Glycemic Control and Glycemic Variability in People with Type 1 Diabetes Using Open Source Artificial Pancreas Systems, co-authored by Andreas Melmer, Thomas Züger, Dana Lewis, Scott Leibrand, Christoph Stettler, and Markus Laimer.

APSComponents_Melmer_ADA2019

Artificial Pancreas Systems (APS) now exist, leveraging a CGM sensor, pump, and control algorithm. Faster insulin can play a role, too.  Traditionally, APS is developed by commercial industry, tested by clinicians, regulated, and then patients can access it. However, DIYAPS is designed by patients for individual use.

There are now multiple different kinds of DIYAPS systems in use: #OpenAPS, Loop, and AndroidAPS. There are differences in hardware, pump, and software configurations. The main algorithm for OpenAPS is also used in AndroidAPS.  DIYAPS can work offline; and also leverage the cloud for accessing or displaying data, including for remote monitoring.OnlineOffline_Melmer_ADA2019

This study analyzed data from the OpenAPS Data Commons (see more here). At the time this data set was used, there were n=80 anonymized data donors from the #OpenAPS community, with a combined 53+ years worth of CGM data.

TIR_PostLooping_Melmer_ADA2019
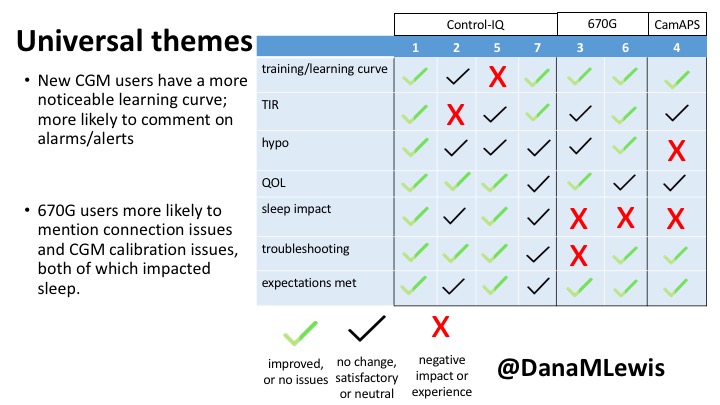
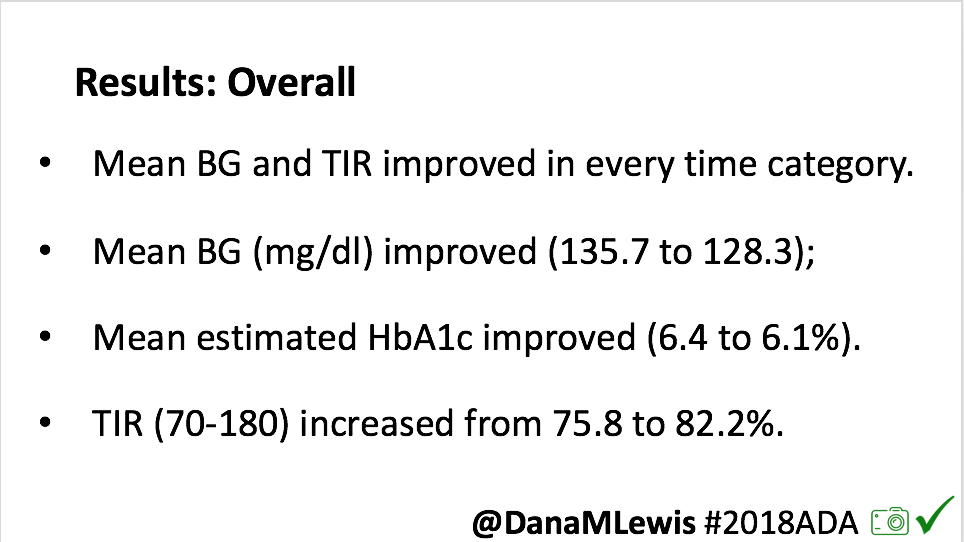
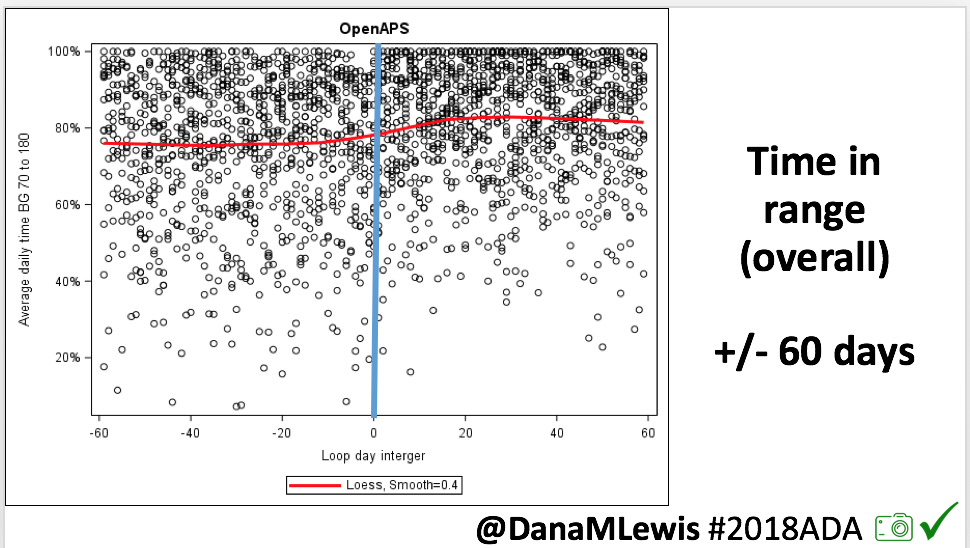
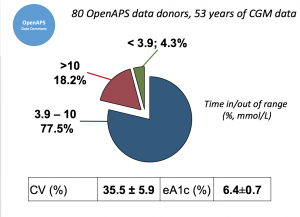
Looking at results for #OpenAPS data donors post-looping initiation, CV was 35.5±5.9, while eA1c was 6.4±0.7. TIR (3.9-10mmol/L) was 77.5%. Time spent >10 was 18.2%; time <3.9 was 4.3%.

SubcohortData_Melmer_ADA2019
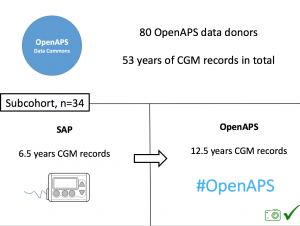
We selected a subcohort of n=34 who had data available from before DIY closed looping initiation (6.5 years combined of CGM records), as well as data from after (12.5 years of CGM records).

For these next set of graphs, blue is BEFORE initiation (when just on a traditional pump); red is AFTER, when they were using DIYAPS.

TIR_PrePost_Melmer_ADA2019
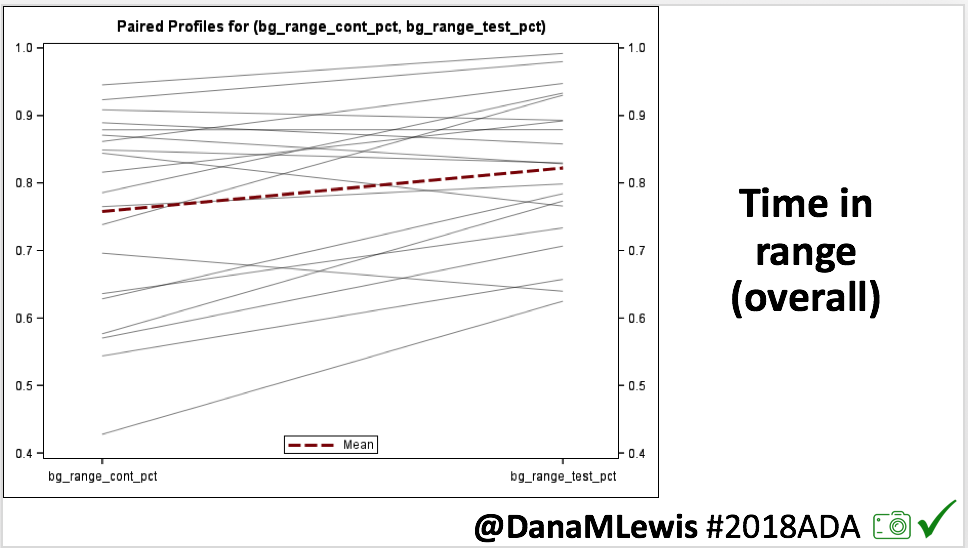
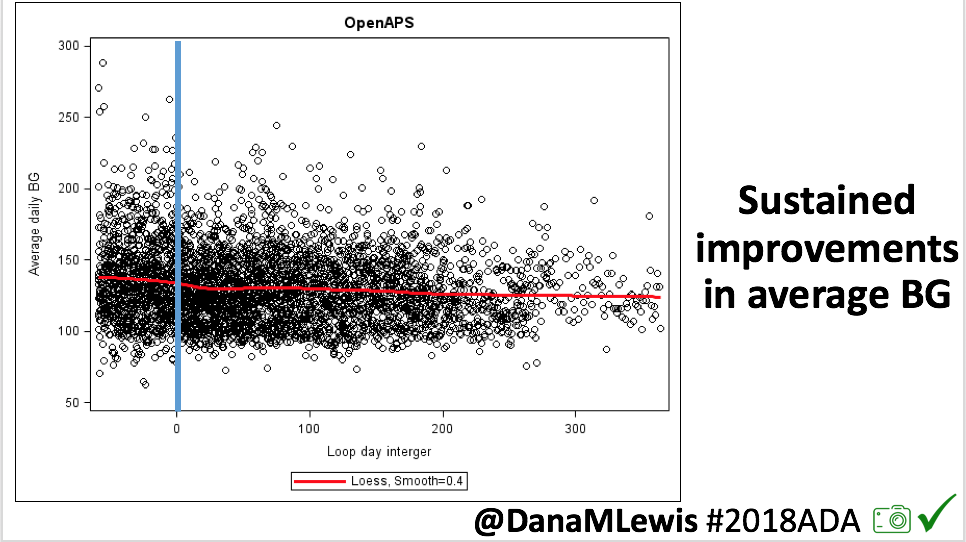
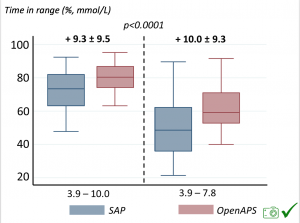
Time in a range significantly increased for both wider (3.9-10 mmol/L) and tighter (3.9-7.8 mmol/L) ranges.

TOR_PrePost_Melmer_ADA2019
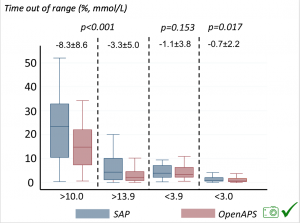
Time spent out of range decreased. % time spent >10 mmol/L decreased -8.3±8.6 (p<0.001); >13 mmol/L decreased -3.3±5.0 (p<0.001). Change in % time spent <3.9 mmol/L (-1.1±3.8 (p=0.153)), and <3.0 mmol/L (-0.7±2.2 (p=0.017)) was not significant.

We also analyzed daytime and nightime (the above was reflecting all 24hr combined; these graphs shows the increase in TIR and decrease in time out of range for both day and night).

TIR_TOR_DayAndNight_Melmer_ADA2019

Hypoglemic_event_reduction_Melmer_ADA2019
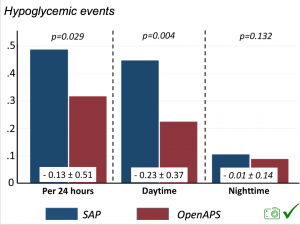
There were less CGM records in the hypoglycemic range after initiating DIYAPS.

Conclusion: this was a descriptive study analyzing available CGM data from  #OpenAPS Data Commons. This study shows OpenAPS has potential to support glycemic control. However, DIYAPS are currently not regulated/approved technology. Further research is recommended.

Conclusion_Melmer_ADA2019

(Note: a version of this study has been submitted and accepted for publication in the Journal of Diabetes. Obesity, and Metabolism.)

Presentations and poster content from @DanaMLewis at #2018ADA

DanaMLewis_ADA2018As I mentioned, I am honored to have two presentations and a co-authored poster being presented at #2018ADA. As per my usual, I plan to post all content and make it fully available online as the embargo lifts. There will be three sets of content:

  • Poster 79-LB in Category 12-A Detecting Insulin Sensitivity Changes for Individuals with Type 1 Diabetes using “Autosensitivity” from OpenAPS’ poster, co-authored by Dana Lewis, Tim Street, Scott Leibrand, and Sayali Phatak.
  • Content from my presentation Saturday, The Data behind DIY Diabetes—Opportunities for Collaboration and Ongoing Research’, which is part of the “The Diabetes Do-It-Yourself (DIY) Revolution” Symposium!
  • Content from my presentation Monday, Improvements in A1c and Time-in-Range in DIY Closed-Loop (OpenAPS) Users’, co-authored by Dana Lewis, Scott Swain, and Tom Donner.

First up: the autosensitivity poster!

Dana_Scott_ADA2018_autosens_posterYou can find the full write up and content of the autosensitivity poster in a post over on OpenAPS.org. There’s also a twitter thread if you’d like to share this poster with others on Twitter or elsewhere.

Summary: we ran autosensitivity retrospectively on the command line to assess patterns of sensitivity changes for 16 individuals who had donated data in the OpenAPS Data Commons. Many had normal distributions of sensitivity, but we found a few people who trended sensitive or resistant, indicating underlying pump settings could likely benefit from a change.
2018 ADA poster on Autosensitivity from OpenAPS by DanaMLewis


Presentation:
The Data behind DIY Diabetes—Opportunities for Collaboration and Ongoing Research’

This presentation was a big deal to me, as it was flanked by 3 other excellent presentations on the topic of DIY and diabetes. Jason Wittmer gave a great overview and context setting of DIY diabetes, ranging from DIY remote monitoring and CGM tools all the way to DIY closed loops like OpenAPS. Jason is a dad who created OpenAPS rigs for his son with T1D. Lorenzo Sandini spoke about the clinician’s perspective for when patients come into the office with DIY tools. He knows it from both sides – he’s using OpenAPS rigs, and also has patients who use OpenAPS. And after my presentation, Joyce Lee also spoke about the overarching landscape of diabetes and the role DIY plays in this emerging technology space.

Why did I present as part of this group today? One of the roles I’ve taken on in the last few years in the OpenAPS community (among others) is a collaborator and facilitator of research with and about the community. I put together the first outcomes study (see here in JDST or here in a blog post form on OpenAPS.org) in 2016. We presented a poster on Autotune last year at ADA (see here in a blog post form on OpenAPS.org). I’ve also worked to create and manage the OpenAPS Data Commons, as well as build tools for researchers to use this data, so individuals can easily and anonymously donate their DIY closed loop data for other research projects, lowering the friction and barriers for both patients and researchers. And, I’ve co-led or led several research projects with the community’s data as a result.

My presentation was therefore about setting the stage with background on OpenAPS & how we ended up creating the OpenAPS Data Commons; presenting a selection of research projects that have utilized data from the community; highlighting other research projects working with the OpenAPS community; announcing a new international collaboration (OPEN – more coming on that in the future!) for research with the DIY community; and hopefully encouraging other diabetes researchers to think about sharing their work, data, methods, tools, and insights as openly possible to help us all move forward with improving the lives of people with diabetes.

That is, of course, quite an abbreviated summary! I’ve shared a thread on Twitter that goes into detail on each of the key points as part of the presentation, or there’s a version of this Twitter/presentation content also written below.

If you’re someone who wants to do research with retrospective data from the OpenAPS Data Commons, you can find out more about it here (including instructions on how to request data). And if you’re interested in prospective research, please do reach out as well!

Full content for those who don’t want to read Twitter:

Patients are often seen as passive recipients of care, but many of us PWDs have discovered that problems are opportunities to change things. My journey to DIY began after I was frustrated by my inability to hear CGM alarms at night. 4 years ago, there was no way for me to access my own device data in real time OR retrospectively. Thanks to John Costik for sharing his code, I was able to get my CGM data & send it to the cloud and down to my phone, creating a louder alarm. Scott and I created an algorithm to push notifications to me to take action. This was an ‘open loop’ system we called #DIYPS. With Ben West’s help, we realized could combine our algorithm with small, off-the-shelf hardware & a radio stick to automate insulin delivery. #OpenAPS was thus created, open sourcing all components of DIY closed loop system so others could close the loop, too. An #OpenAPS rig consists of a small computer, radio chip, & battery. The hardware is constantly evolving. Many of us also use Nightscout to visualize our closed loop data, and share with loved ones.

2018ADA_slide12018ADA_slide 42018ADA_slide 32018ADA_Slide 2


I closed the loop in December of 2015. As people learned about it, I got pushback: “It works for you, but how do you know it’s going to work for others?” I didn’t, and I said so. But that didn’t mean I shouldn’t share what was working for me.

Once we had dozens of users of #OpenAPS, we presented a research study at #2016ADA, with 18 individuals sharing outcomes data on A1c, TIR, and QOL improvements. (See that publication here: https://twitter.com/danamlewis/status/763782789070192640 ). I was often asked to share my data for people to analyze, but I’m not representative of entire #OpenAPS community. Plus, the community has kept growing: we estimate there are more than (n=1)*710+ (as of June 2018) people worldwide using different kinds of DIY APs. (Note: if you’d like to keep track of the growing #OpenAPS community, the count of loopers worldwide is updated periodically at  https://openaps.org/outcomes ).  I began to work with Open Humans to build the #OpenAPS Data Commons, enabling individuals to anonymously upload their data and consent to share it with the Data Commons.

2018ADA_Slide 52018ADA_Slide 62018ADA_Slide 72018ADA_Slide 8


Criteria for using the #OpenAPS Data Commons:

  • 1) share insights back with the community, especially if you find something about an individual’s data set where we should notify them
  • 2) publish in an accessible (and preferably open) manner

I’ve learned that not many are prepared to take advantage of the rich (and complex) data available from #OpenAPS users; and many researchers have varying background and skillsets.  To aid researchers, I created a series of open source tools (described here: http://bit.ly/2l5ypxq, and tools available at https://github.com/danamlewis/OpenHumansDataTools ) to help researchers & patients working with data.

2018ADA_Slide 10 2018ADA_Slide 9


We have a variety of research projects that have leveraged the anonymously donated, DIY closed loop data from the #OpenAPS Data Commons.

  • 2018ADA_Slide 112018ADA_Slide 12One research project, in collaboration with a Stanford team, evaluated published machine learning model predictions & #OpenAPS predictions. Some models (particularly linear regression) = accurate predictions in short term, but less so longer term when insulin peaks. This study is pending publication, but I’d like to note the challenge of more traditional research keeping pace with DIY innovation: the code (and data) studied was from January 2017. #OpenAPS prediction code has been updated 2x since then.
  • In response to the feedback from the #2016ADA #OpenAPS Outcomes study we presented, a follow up study on #OpenAPS outcomes was created in partnership with a team at Johns Hopkins. That study will be presented on Monday, 6-6:15pm (352-OR).
  • 2018ADA_Slide 13Many people share publicly online their outcomes with DIY closed loops. Sulka Haro has shared his script to evaluate the reduction in daily manual diabetes interventions after they began using #OpenAPS. Before: 4.5/day manual corrections; now they treat <1/day.
  • #OpenAPS features such as autosensitivity automatically detect sensitivity changes and insulin needs, improving outcomes. (See above at the top of this post for the full poster content).
  • If you missed it at #2017ADA (see here: http://bit.ly/2rMBFmn) , Autotune is a tool for assessing changes to basal rates, ISF, and carb ratio. Developed for #OpenAPS users but can also be used by traditional pumpers (and some MDI users also utilize it).

I’m also thrilled to share a new tool we’ve created: an #OpenAPS simulator to allow us to more easily back-test and compare settings changes & feature changes in #OpenAPS code.
2018ADA_Slide 14

  • Screen Shot 2018-06-22 at 4.48.06 PM2018ADA_Slide 16  We pulled a recent week of data for n=1 adult PWD who does no-bolus, rough carb entry meal announcements, and ran the simulator to predict what the outcomes would be for no-bolus and no meal-announcement.


  • 2018ADA_Slide 172018ADA_Slide 18 We also ran the simulator on n=1 teen PWD who does no-bolus and no-meal-announcement in real life. The simulator tracked closely to his actual outcomes (validated this week with a lab-A1c of 6.1)


The new #OpenAPS simulator will allow us to better test future algorithm changes and features across a diverse data set donated by DIY closed loop users.

There are many other studies & collaborations ongoing with the DIY community.

  • Michelle Litchman, Perry Gee, Lesly Kelly, and myself have a paper pending review analyzing social-media-reported outcomes & themes from DIY community.
  • 2018ADA_Slide 19There are also multiple other posters about DIY outcomes here at #2018ADA:
  • 2018ADA_Slide 20 There are many topics of interest in DIY community we’d like to see studies on, and have data for. These include: “eating soon” (optimal insulin dosing for lesser post-prandial spikes); and variability in sensitivity for various ages, pregnancy, and menstrual cycle.
  • 2018ADA_Slide 21I’m also thrilled to announce funding will be awarded to OPEN (a new collaboration on Outcomes of Patients’ Evidence, with Novel, DIY-AP tech), a 36-month international collaboration assessing outcomes, QOL, further development, access of real-world AP tech, etc. (More to come on this soon!)

In summary: we don’t have a choice in living with diabetes. We *do* have a choice to DIY, and also to research to learn more and improve knowledge and availability of tools for us PWDs, more quickly. We would love to partner and collaborate with anyone interested in working with the DIY community, whether that is utilizing the #OpenAPS Data Commons for retrospective studies or designing prospective studies. If you take away one thing today: let it be the request for us to all openly share our tools, data, and insights so we can all make life with type 1 diabetes better, faster.

2018ADA_Slide 222018ADA_Slide 23


A huge thank you as always to the community: those who have donated and shared data; those who have helped develop, test, troubleshoot, and otherwise help power the #OpenAPS and other DIY diabetes communities.

2018ADA_Slide 24

Presentation:
Improvements in A1c and Time-in-Range in DIY Closed-Loop (OpenAPS) Users

(full tweet thread available here; or a description of this presentation below)

#OpenAPS is an open and transparent effort to make safe and effective Artificial Pancreas System (APS) technology widely available to reduce the burden of Type 1 diabetes. #OpenAPS evolved from my first DIY closed loop system and our desire to openly share what we’ve learned living with DIY closed loops. It takes a small, off-the-shelf computer; a radio; and a battery to communicate with existing insulin pumps and CGMs. As a PWD, I care a lot about safety: the safety reference design is the first thing in #OpenAPS that was shared, in order to help set expectations around what a DIY closed loop can (and cannot) do.

ADA2018_Slide 23ADA2018_Slide 24As I shared about my own DIY experience, people questioned whether it would work for others, or just me. At #2016ADA, we presented an outcomes study with data from 18 of the first 40 DIY closed loop users. Feedback on that study included requests to evaluate CGM data, given concerns around accuracy of self-reported outcomes.

This 2018 #OpenAPS outcomes study was the result. We performed a retrospective cross-over analysis of continuous BG readings recorded during 2-week segments 4-6 weeks before and after initiation of OpenAPS.

ADA2018_Slide 26For this study, n=20 based on the availability of data that met the stringent protocol requirements (and the limited number of people who had both recorded that data and donated it to the #OpenAPS Data Commons in early 2017).  Demographics show that, like the 2016 study, the people choosing to #OpenAPS typically have lower A1C than the average T1D population; have had diabetes for over a decade; and are long-time pump and CGM users. Like the 2016 study, this 2018 study found mean BG and TIR improved across all time categories (overall, day, and nighttime).

ADA2018_Slide 28ADA2018_Slide 29ADA2018_Slide 30ADA2018_Slide 31ADA2018_Slide 32

Overall, mean BG (mg/dl) improved (135.7 to 128.3); mean estimated HbA1c improved (6.4 to 6.1%). TIR (70-180) increased from 75.8 to 82.2%. Overall, time spent high and low were all reduced, in addition to eAG and A1c reduction. Overnight (11pm-7am) had smaller improvement in all categories compared to daytime improvements in these categories.

Notably: although this study primarily focused on a 4-6 week time frame pre-looping vs. 4-6 weeks post-looping, the improvements in all categories are sustained over time by #OpenAPS users.

ADA2018_Slide 33 ADA2018_Slide 34

ADA2018_Slide 35Conclusion: Even with tight initial control, persons with T1D saw meaningful improvements in estimated A1c, TIR, and a reduction in time spent high and low, during the day and at night, after initiating #OpenAPS. Although this study focused on BG data from CGM, do not overlook additional QOL benefits when analyzing benefits of hybrid closed loop therapy or designing future studies! See these examples shared from Sulka Haro and Jason Wittmer as example of quality of life impacts of #OpenAPS.

A huge thank you to the community: those who have donated and shared data; those who have helped develop, test, troubleshoot, and otherwise help power the #OpenAPS and other DIY diabetes communities.

And, special thank you to my co-authors, Scott Swain & Tom Donner, for the collaboration on this study. Lewis_Donner_Swain_ADA2018

Getting ready for #2018ADA (@DanaMLewis) & preparing to encourage photography

We’re a few weeks away from the 78th American Diabetes Scientific Sessions (aka, #2018ADA), and I’m getting excited. Partially because of the research I have the honor of presenting; but also because ADA has made strides to (finally) update their photography policy and allow individual presenters to authorize photography & sharing of their content. Yay!

As a result of preparing to encourage people to take pictures & share any and all content from my presentations, I started putting together my slides for each presentation, including the slide about allowing photography, which I’ll also verbally say at the start of the presentation. Interestingly to me, though, ADA only provided an icon for discouraging photography, saying that if staff notice that icon on any photos, that’s who will be asked to take down photos. I don’t want any confusion (in past years, despite explicit permission, people have been asked to take down photos of my work), so I wanted to include obvious ‘photography is approved’ icons.

And this is what I landed on for a photography encouraged slide, and the footer of all my other slides:

Encouraging photography in my slides Example encouraging use of photography in content slidesEncouraging photography in the footer of my slides

And, if anyone else plans to encourage (allow) photography and would like to use this slide design, you can find my example slide deck here that you are welcome to use: http://bit.ly/2018ADAexampleslides

I used camera and check mark icons which are licensed to be freely used; and I also licensed this slide deck and all content to be freely used by all! I hope it’s helpful.

Where you’ll find me at #2018ADA

And if you’re wondering where and what I’ll be presenting on with these slides…I’ll be sharing new content in a few different times and places!

On Saturday, I’m thrilled there is a full, 2-hour session on DIY-related content, and to get to share the stage with Jason Wittmer, Lorenzo Sandini, and Joyce Lee. That’s 1:45-3:45pm (Eastern), “The Diabetes Do-It-Yourself (DIY) Revolution”, in W415C (Valencia Ballroom). I’ll be discussing some of the data & research in DIY diabetes! A huge thanks to Joshua Miller for championing and moderating this session.

I’m also thrilled that a poster has been accepted on one of the projects from my RWJF grant work, in partnership with Tim Street (as well as Scott Leibrand, and Sayali Phatak who is heading our data science work for Opening Pathways). The embargo lifts on Saturday morning (content will be shared online then), and the poster will be displayed Saturday, Sunday, and Monday. Scott and I will also be present with the poster on Monday during the poster session from 12-1pm.

And last but not least, there is also an oral presentation on Monday evening with a new study on outcomes data from using OpenAPS. I’ll be presenting during the 4:30-6:30pm session (again in W415C (Valencia Ballroom)), likely during the 6-6:15pm slot. I’m thrilled that Scott Swain & Tom Donner, who partnered on this study & work, will also be there to help answer questions about this study!

As we have done in the past (see last year’s poster, for example), we plan to share all of this content online once the embargo lifts, in addition to the in-person presentations and poster discussions.

A huge thanks, as always, goes to the many dozens of people who have contributed to this DIY community in so many ways: development, testing, support, feedback, documentation, data donation, and more! <3

Quantified sickness when you have #OpenAPS and the flu

Getting “real people sick*” is the worst. And it can be terrifying when you have type 1 diabetes, and know the sickness is both likely to send your blood sugars rocketing sky high, as well as leave you exhausted and weak and that much harder to deal with a plummeting low.

*(Scott hates this term because he doesn’t like the implication that PWD’s aren’t real. We’re real, all right. But I like the phrase because it differentiates between feeling bad from blood sugar-related reasons, and the kind of sickness that anyone can get.)

In February 2014, Scott got home from a conference on Friday, and on Saturday complained about being tired with a headache. By Sunday, I started feeling weary with a sore throat. By Monday morning, I had a raging fever, chills, and the bare minimum of energy required to drag myself into the employee health clinic and get diagnosed with the flu. And since they knew I was single and lived by myself, the conversation went from “here’s your prescription for Tamiflu” to “but you can’t be by yourself, maybe we should find a bed for you in the hospital” because of how sick I was. Luckily, I called Scott and asked him to come pick me up and let me stay at his place. And there I stayed in complete misery for several days, the sickest I’d ever been. I remember at one point on the second day, waking up from a fitful doze and seeing Scott standing across the room with his laptop on a dresser, using it as a standing desk because he was so worried about me that he didn’t want to leave the room at that point. It was that bad.

Luckily, I survived. (And good thing, right, given that we went on to build OpenAPS, yes? ;)) This year’s flu experience was different. This year I was real-people sick, but without the diabetes-related fear that I’d so often experienced in the past. My blood sugars were perfectly managed by OpenAPS. I didn’t go low. It didn’t matter if I didn’t eat, or did eat (potato soup, ice cream, and frozen fruit bars were the foods of choice). My BGs stayed almost entirely in range. And because they were so in range that it was odd, I started watching the sensitivity ratio that is calculated by autosensitivity to see how my insulin sensitivity was changing over the course of the sickness. And by day 5, I finally felt good enough to share some of that data (aka, tweet). Here’s what I found from this year’s flu experience:

  • Night 1 was terrible, because I got hardly any deep sleep (45 minutes, whereas 2+h is my usual average per night) and kept waking up coughing. I also was 40% insulin resistant all night long and into Day 2, meaning it took 40% more insulin than usual to keep my BGs at target.
  • Night 2 was even worse – ZERO deep sleep. Ahhhh! It was terrible. Resistance also nudged up to 50%.
  • Night 3 – hallelujah, deep sleep returned. I ended up getting 4h53m of deep sleep, and also was able to sleep for closer to 2 hour blocks at a time, with less coughing. Also, going into night 3 was pretty much the only “high” I had of being sick – up around 180 for a few hours. Then it fell off a cliff and whooshed down to the bottom of my target, marking the drastic end of insulin resistance. After that, insulin sensitivity was fairly normal.
  • Night 4 yielded more deep sleep (>5 hours), and a tad bit of insulin sensitivity (~10%), but it’s unclear whether that’s totally sickness related or more related to the fact that I wasn’t eating much in day 3 and day 4.
  • Night 5 felt like I was going backward – 1h36m of deep sleep, tons of coughing, and interestingly a tad bit of insulin resistance (~20%) again. Night 6 (last night) I supposedly got plenty of deep sleep again (>4h), but didn’t feel like it at all due to coughing. BGs are still perfectly in range, and insulin sensitivity back to usual.

This was all done still with no-bolus, and just carb announcement when I ate whatever it was I was eating. In several cases there was negative IOB on board, but I didn’t have the usual spikes that I would normally see from that. I had 120 carbs of gluten free biscuits and gravy yesterday, and I didn’t go higher than 130mg/dl.

In-range BGs shown on CGM graph thanks to OpenAPS

It’s a weird feeling to have been this sick, and have perfectly normal blood sugars. But that’s why it’s so interesting to be able to look at other data beyond average, time in range, and A1c – we now have the tools and the data to be able to dive in and really understand more about what our bodies are doing in sick situations, whether it’s norovirus or the flu.

I’m thinking if everyone shared their data from when they had the flu, or norovirus, or strep throat, or whatever – we might be able to start to analyze and detect patterns of resistance and otherwise sensitivity changes over the course of typical illness. This way, when someone gets sick with diabetes, we’d know generally “expect around XX% resistance for Days 1-3, and then expect a drop off that looks like this on Day 4”, etc.

That would be way better than the traditional ways of just bracing yourself for sky-high highs and terrible lows with no understanding or ability to make things better during illness. The peace of mind I had during the flu this year was absolutely priceless. Some people will be able to get that with DIY closed loop technology; but as with so many other things we have learned and are learning from this community, I bet we can find ways to help translate these insights to be of benefit for all people with diabetes, regardless of which therapies they have access to or decide to use.

Want to help? Been sick? Consider donating your data to my diabetes sick-day analysis project. What you should do:

  1. If you’re using a closed loop, donate your data to the OpenAPS Data Commons. You can do all your data (yay!), or just the time frame you’ve been sick. Use the “message the project owner” feature to anonymously message and share what kind of illness you had, and the dates of sickness.
  2. Not using a closed loop, but have Nightscout? Donate your data to the Nightscout Data Commons, and do the same thing: Use the “message the project owner” feature to anonymously message and share what kind of illness you had, and the dates of sickness.

As we have more people who identify batches of sick-day data, I’ll look at what insights we can find around sensitivity changes before, during, and after sickness, plus other insights we can learn from the data.