Getting “real people sick*” is the worst. And it can be terrifying when you have type 1 diabetes, and know the sickness is both likely to send your blood sugars rocketing sky high, as well as leave you exhausted and weak and that much harder to deal with a plummeting low.
*(Scott hates this term because he doesn’t like the implication that PWD’s aren’t real. We’re real, all right. But I like the phrase because it differentiates between feeling bad from blood sugar-related reasons, and the kind of sickness that anyone can get.)
In February 2014, Scott got home from a conference on Friday, and on Saturday complained about being tired with a headache. By Sunday, I started feeling weary with a sore throat. By Monday morning, I had a raging fever, chills, and the bare minimum of energy required to drag myself into the employee health clinic and get diagnosed with the flu. And since they knew I was single and lived by myself, the conversation went from “here’s your prescription for Tamiflu” to “but you can’t be by yourself, maybe we should find a bed for you in the hospital” because of how sick I was. Luckily, I called Scott and asked him to come pick me up and let me stay at his place. And there I stayed in complete misery for several days, the sickest I’d ever been. I remember at one point on the second day, waking up from a fitful doze and seeing Scott standing across the room with his laptop on a dresser, using it as a standing desk because he was so worried about me that he didn’t want to leave the room at that point. It was that bad.
Luckily, I survived. (And good thing, right, given that we went on to build OpenAPS, yes? ;)) This year’s flu experience was different. This year I was real-people sick, but without the diabetes-related fear that I’d so often experienced in the past. My blood sugars were perfectly managed by OpenAPS. I didn’t go low. It didn’t matter if I didn’t eat, or did eat (potato soup, ice cream, and frozen fruit bars were the foods of choice). My BGs stayed almost entirely in range. And because they were so in range that it was odd, I started watching the sensitivity ratio that is calculated by autosensitivity to see how my insulin sensitivity was changing over the course of the sickness. And by day 5, I finally felt good enough to share some of that data (aka, tweet). Here’s what I found from this year’s flu experience:
- Night 1 was terrible, because I got hardly any deep sleep (45 minutes, whereas 2+h is my usual average per night) and kept waking up coughing. I also was 40% insulin resistant all night long and into Day 2, meaning it took 40% more insulin than usual to keep my BGs at target.
- Night 2 was even worse – ZERO deep sleep. Ahhhh! It was terrible. Resistance also nudged up to 50%.
- Night 3 – hallelujah, deep sleep returned. I ended up getting 4h53m of deep sleep, and also was able to sleep for closer to 2 hour blocks at a time, with less coughing. Also, going into night 3 was pretty much the only “high” I had of being sick – up around 180 for a few hours. Then it fell off a cliff and whooshed down to the bottom of my target, marking the drastic end of insulin resistance. After that, insulin sensitivity was fairly normal.
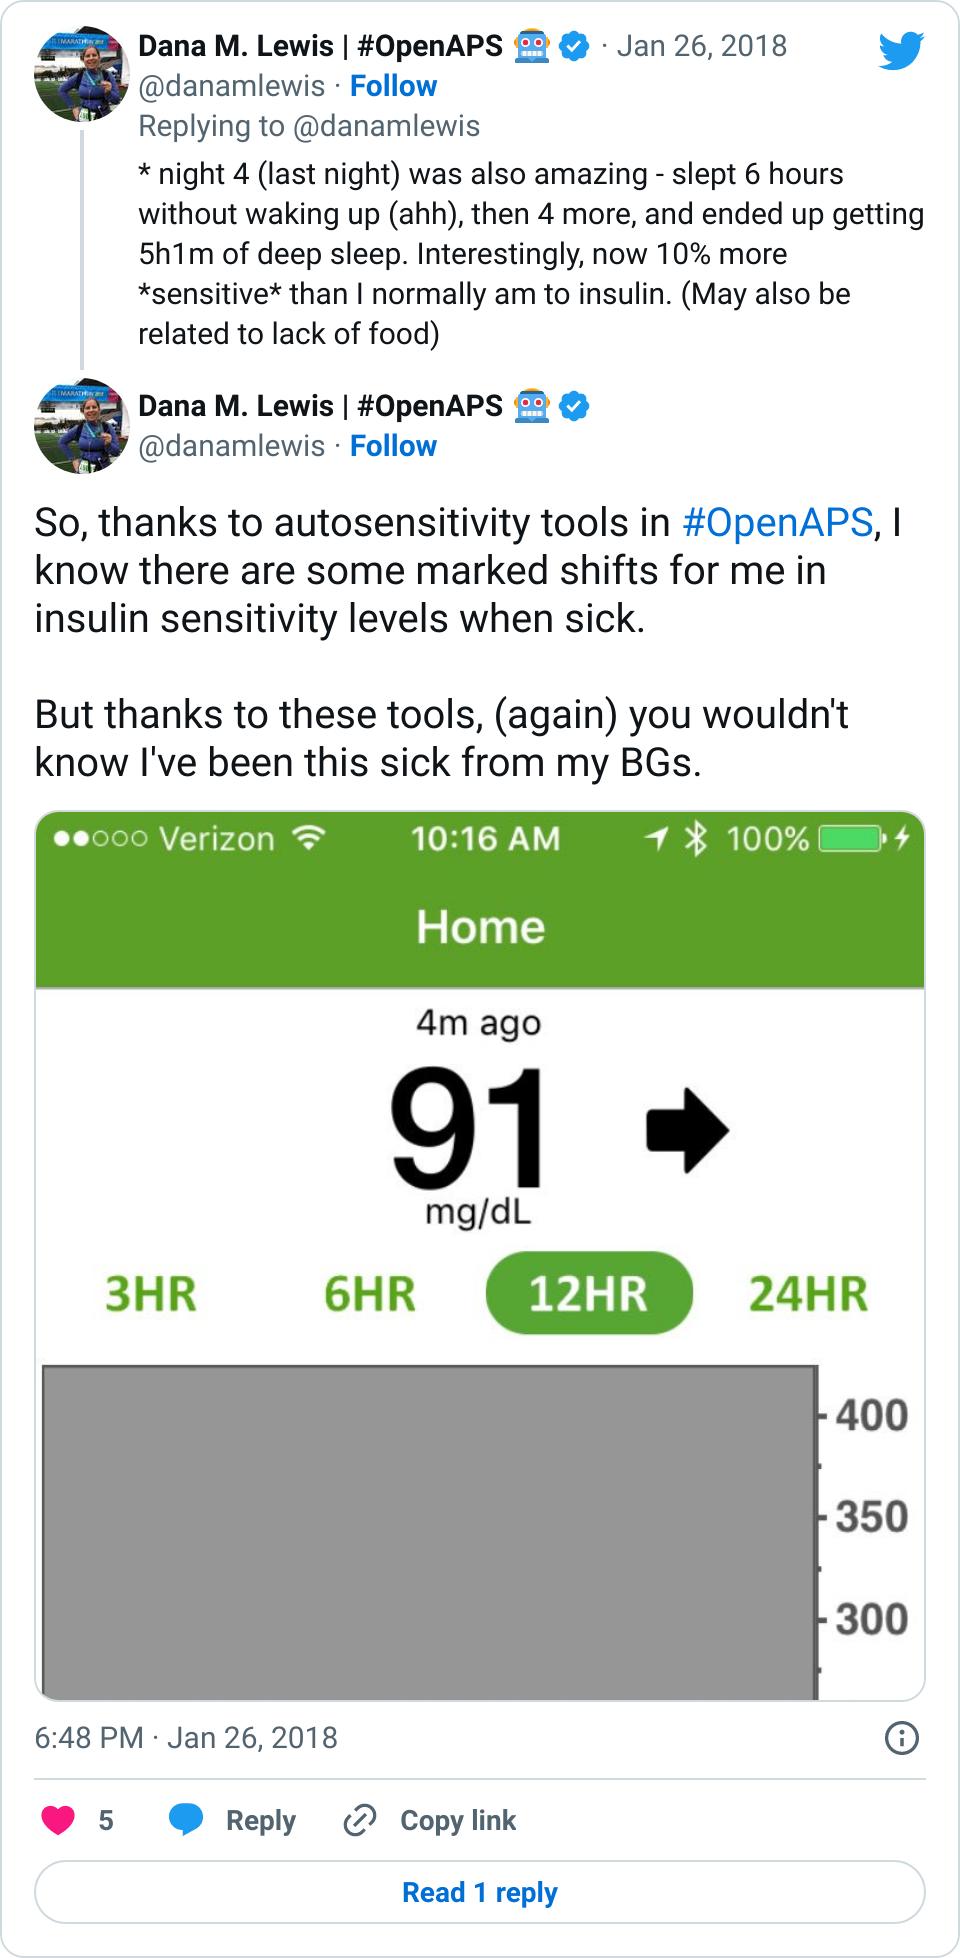
- Night 4 yielded more deep sleep (>5 hours), and a tad bit of insulin sensitivity (~10%), but it’s unclear whether that’s totally sickness related or more related to the fact that I wasn’t eating much in day 3 and day 4.
- Night 5 felt like I was going backward – 1h36m of deep sleep, tons of coughing, and interestingly a tad bit of insulin resistance (~20%) again. Night 6 (last night) I supposedly got plenty of deep sleep again (>4h), but didn’t feel like it at all due to coughing. BGs are still perfectly in range, and insulin sensitivity back to usual.
This was all done still with no-bolus, and just carb announcement when I ate whatever it was I was eating. In several cases there was negative IOB on board, but I didn’t have the usual spikes that I would normally see from that. I had 120 carbs of gluten free biscuits and gravy yesterday, and I didn’t go higher than 130mg/dl.
It’s a weird feeling to have been this sick, and have perfectly normal blood sugars. But that’s why it’s so interesting to be able to look at other data beyond average, time in range, and A1c – we now have the tools and the data to be able to dive in and really understand more about what our bodies are doing in sick situations, whether it’s norovirus or the flu.
I’m thinking if everyone shared their data from when they had the flu, or norovirus, or strep throat, or whatever – we might be able to start to analyze and detect patterns of resistance and otherwise sensitivity changes over the course of typical illness. This way, when someone gets sick with diabetes, we’d know generally “expect around XX% resistance for Days 1-3, and then expect a drop off that looks like this on Day 4”, etc.
That would be way better than the traditional ways of just bracing yourself for sky-high highs and terrible lows with no understanding or ability to make things better during illness. The peace of mind I had during the flu this year was absolutely priceless. Some people will be able to get that with DIY closed loop technology; but as with so many other things we have learned and are learning from this community, I bet we can find ways to help translate these insights to be of benefit for all people with diabetes, regardless of which therapies they have access to or decide to use.
—
Want to help? Been sick? Consider donating your data to my diabetes sick-day analysis project. What you should do:
- If you’re using a closed loop, donate your data to the OpenAPS Data Commons. You can do all your data (yay!), or just the time frame you’ve been sick. Use the “message the project owner” feature to anonymously message and share what kind of illness you had, and the dates of sickness.
- Not using a closed loop, but have Nightscout? Donate your data to the Nightscout Data Commons, and do the same thing: Use the “message the project owner” feature to anonymously message and share what kind of illness you had, and the dates of sickness.
As we have more people who identify batches of sick-day data, I’ll look at what insights we can find around sensitivity changes before, during, and after sickness, plus other insights we can learn from the data.
One thought on “Quantified sickness when you have #OpenAPS and the flu”