Continuation Results On 48 Weeks of Use Of Open Source Automated Insulin Delivery From the CREATE Trial: Safety And Efficacy Data

In addition to the primary endpoint results from the CREATE trial, which you can read more about in detail here or as published in the New England Journal of Medicine, there was also a continuation phase study of the CREATE trial. This meant that all participants from the CREATE trial, including those who were randomized to the automated insulin delivery (AID) arm and those who were randomized to sensor-augmented insulin pump therapy (SAPT, which means just a pump and CGM, no algorithm), had the option to continue for another 24 weeks using the open source AID system.

These results were presented by Dr. Mercedes J. Burnside at #EASD2022, and I’ve summarized her presentation and the results below on behalf of the CREATE study team.

What is the “continuation phase”?

The CREATE trial was a multi-site, open-labeled, randomized, parallel-group, 24-week superiority trial evaluating the efficacy and safety of an open-source AID system using the OpenAPS algorithm in a modified version of AndroidAPS. Our study found that across children and adults, the percentage of time that the glucose level was in the target range of 3.9-10mmol/L [70-180mg/dL] was 14 percentage points higher among those who used the open-source AID system (95% confidence interval [CI], 9.2 to 18.8; P<0.001) compared to those who used sensor augmented pump therapy; a difference that corresponds to 3 hours 21 minutes more time spent in target range per day. The system did not contribute to any additional hypoglycemia. Glycemic improvements were evident within the first week and were maintained over the 24-week trial. This illustrates that all people with T1D, irrespective of their level of engagement with diabetes self-care and/or previous glycemic outcomes, stand to benefit from AID. This initial study concluded that open-source AID using the OpenAPS algorithm within a modified version of AndroidAPS, a widely used open-source AID solution, is efficacious and safe. These results were from the first 24-week phase when the two groups were randomized into SAPT and AID, accordingly.

The second 24-week phase is known as the “continuation phase” of the study.

There were 52 participants who were randomized into the SAPT group that chose to continue in the study and used AID for the 24 week continuation phase. We refer to those as the “SAPT-AID” group. There were 42 participants initially randomized into AID who continued to use AID for another 24 weeks (the AID-AID group).

One slight change to the continuation phase was that those in the SAPT-AID used a different insulin pump than the one used in the primary phase of the study (and 18/42 AID-AID participants also switched to this different pump during the continuation phase), but it was a similar Bluetooth-enabled pump that was interoperable with the AID system (app/algorithm) and CGM used in the primary outcome phase.

All 42 participants in AID-AID completed the continuation phase; 6 participants (out of 52) in the SAPT-AID group withdrew. One withdrew from infusion site issues; three with pump issues; and two who preferred SAPT.

What are the results from the continuation phase?

In the continuation phase, those in the SAPT-AID group saw a change in time in range (TIR) from 55±16% to 69±11% during the continuation phase when they used AID. In the SAPT-AID group, the percentage of participants who were able to achieve the target goals of TIR > 70% and time below range (TBR) <4% increased from 11% of participants during SAPT use to 49% during the 24 week AID use in the continuation phase. Like in the primary phase for AID-AID participants; the SAPT-AID participants saw the greatest treatment effect overnight with a TIR difference of 20.37% (95% CI, 17.68 to 23.07; p <0.001), and 9.21% during the day (95% CI, 7.44 to 10.98; p <0.001) during the continuation phase with open source AID.

Those in the AID-AID group, meaning those who continued for a second 24 week period using AID, saw similar TIR outcomes. Prior to AID use at the start of the study, TIR for that group was 61±14% and increased to 71±12% at the end of the primary outcome phase; after the next 6 months of the continuation phase, TIR was maintained at 70±12%. In this AID-AID group, the percentage of participants achieving target goals of TIR >70% and TBR <4% was 52% of participants in the first 6 months of AID use and 45% during the continuation phase. Similarly to the primary outcomes phase, in the continuation phase there was also no treatment effect by age interaction (p=0.39).

The TIR outcomes between both groups (SAPT-AID and AID-AID) were very similar after each group had used AID for 24 weeks (SAPT-AID group using AID for 24 weeks during the continuation phase and AID-AID using AID for 24 weeks during the initial RCT phase).. The adjusted difference in TIR between these groups was 1% (95% CI, -4 to 6; p=-0.67). There were no glycemic outcome differences between those using the two different study pumps (n=69, which was the SAPT-AID user group and 18 AID-AID participants who switched for continuation; and n=25, from the AID-AID group who elected to continue on the pump they used in the primary outcomes phase).

In the initial primary results (first 24 weeks of trial comparing the AID group to the SAPT group), there was a 14 percentage point difference between the groups. In the continuation phase, all used AID and the adjusted mean difference in TIR between AID and the initial SAPT results was a similar 12.10 percentage points (95% CI, p<0.001, SD 8.40).

Similar to the primary phase, there was no DKA or severe hypoglycemia. Long-term use (over 48 weeks, representing 69 person-years) did not detect any rare severe adverse events.
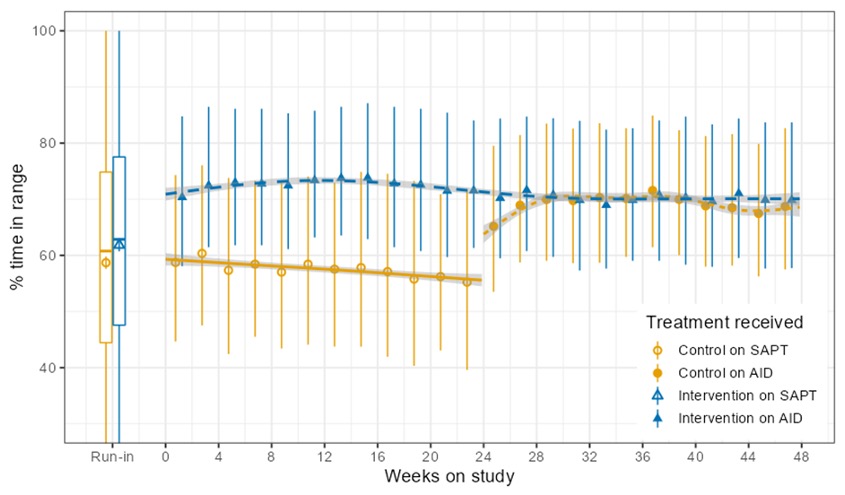
CREATE results from the full 48 weeks on open source AID with both SAPT (control) and AID (intervention) groups plotted on the graph.

Conclusion of the continuation study from the CREATE trial

In conclusion, the continuation study from the CREATE trial found that open-source AID using the OpenAPS algorithm within a modified version of AndroidAPS is efficacious and safe with various hardware (pumps), and demonstrates sustained glycaemic improvements without additional safety concerns.

Key points to takeaway:

  • Over 48 weeks total of the study (6 months or 24 weeks in the primary phase; 6 months/24 weeks in the continuation phase), there were 64 person-years of use of open source AID in the study, compared to 59 person-years of use of sensor-augmented pump therapy.
  • A variety of pump hardware options were used in the primary phase of the study among the SAPT group, due to hardware (pump) availability limitations. Different pumps were also used in the SAPT-AID group during the AID continuation phase, compared to the pumps available in the AID-AID group throughout both phases of trial. (Also, 18/42 of AID-AID participants chose to switch to the other pump type during the continuation phase).
  • The similar TIR results (14 percentage points difference in primary and 12 percentage points difference in continuation phase between AID and SAPT groups) shows durability of the open source AID and algorithm used, regardless of pump hardware.
  • The SAPT-AID group achieved similar TIR results at the end of their first 6 months of use of AID when compared to the AID-AID group at both their initial 6 months use and their total 12 months/48 weeks of use at the end of the continuation phase.
  • The safety data showed no DKA or severe hypoglycemia in either the primary phase or the continuation phases.
  • Glycemic improvements from this version of open source AID (the OpenAPS algorithm in a modified version of AndroidAPS) are not only immediate but also sustained, and do not increase safety concerns.
CREATE Trial Continuation Results were presented at #EASD2022 on 48 weeks of use of open source AID

New Research on Glycemic Variability Assessment In Exocrine Pancreatic Insufficiency (EPI) and Type 1 Diabetes

I am very excited to share that a new article I wrote was just published, looking at glycemic variability in data from before and after pancreatic enzyme replacement therapy (PERT) was started in someone with type 1 diabetes with newly discovered exocrine pancreatic insufficiency (EPI or PEI).

If you’re not aware of exocrine pancreatic insufficiency, it occurs when the pancreas no longer produces the amount of enzymes necessary to fully digest food. If that occurs, people need supplementary enzymes, known as pancreatic enzyme replacement therapy (PERT), to help them digest their food. (You can read more about EPI here, and I have also written other posts about EPI that you can find at DIYPS.org/EPI.)

But, like MANY medications, when someone with type 1 diabetes or other types of insulin-requiring diabetes starts taking them, there is little to no guidance about whether these medications will change their insulin sensitivity or otherwise impact their blood glucose levels. No guidance, because there are no studies! In part, this may be because of the limited tools available at the time these medications were tested and approved for their current usage. Also this is likely in part because people with diabetes make up a small fraction of the study participants that most of these medications are tested on. If there are any specific studies on the medications in people with diabetes, these studies likely were done before CGM, so little data is available that is actionable.

As a result, the opportunity came up to review someone’s data who happened to have blood glucose data from a continuous glucose monitor (CGM) as well as a log of what was eaten (carbohydrate entries) prior to commencing pancreatic enzyme replacement therapy. The tracking continued after commencing PERT and was expanded to also include fat and protein entries. As a result, there was a useful dataset to compare the impacts of pancreatic enzyme replacement therapy on blood glucose outcomes and specifically, looking at glycemic variability changes!

(You can read an author copy here of the full paper and also see the supplementary material here, and the DOI for the paper is https://doi.org/10.1177/19322968221108414 . Otherwise, below is my summary of what we did and the results!)

In addition to the above background, it’s worth noting that Type 1 diabetes is known to be associated with EPI. In upwards of 40% of people with Type 1 diabetes, elastase levels are lowered, which in other cases is correlated with EPI. However, in T1D, there is some confusion as to whether this is always the case or not. Based on recent discussions with endocrinologists who treat patients with T1D and EPI (and have patients with lowered elastase that they think don’t have EPI), I don’t think there have been enough studies looking at the right things to assess whether people with T1D and lowered elastase levels would benefit from PERT and thus have EPI. More on this in the future!

Because we now have technology such as AID (automated insulin delivery) and CGM, it’s possible to evaluate things beyond simple metrics of “average blood sugar” or “A1c” in response to taking new medications. In this paper, we looked at some basic metrics like average blood sugar and percent time in range (TIR), but we also did quite a few calculations of variables that tell us more about the level of variability in glucose levels, especially in the time frames after meals.
Methods

This person had tracked carb entries through an open source AID system, and so carb entries and BG data were available from before they started PERT. We call this “pre-PERT”, and selected 4 weeks worth of data to exclude major holidays (as diet is known to vary quite a bit during those times). We then compared this to “post-PERT”, the first 4 weeks after the person started PERT. The post-PERT data not only included BGs and carb entries, but also had fat and protein entries as well as PERT data. Each time frame included 13,975 BG data points.
We used a series of open source tools to get the data (Nightscout -> Nightscout Data Transfer Tool -> Open Humans) and process the data (my favorite Unzip-Zip-CSVify-OpenHumans-data.sh script).

All of our code for this paper is open source, too! Check it out here. We analyzed time in range, TIR 70-180, time out of range, TOR >180, time below range, TBR <70 and <54, the number of hyperglycemic excursions >180. We also calculated total daily dose of insulin, average carbohydrate intake, and average carbohydrate entries per day. Then we calculated a series of variability related metrics such as Low Blood Glucose Index (LBGI), High Blood Glucose Index (HBGI), Coefficient of Variation (CV), Standard Deviation (SD), and J_index (which stresses both the importance of the mean level and variability of glycemic levels).

Results

This person already had an above-goal TIR. Standard of care goal for TIR is >70%; before PERT they had 92.12% TIR and after PERT it was 93.70%. Remember, this person is using an open source AID! TBR <54 did not change significantly, TBR <70 decreased slightly, and TOR >180 also decreased slightly.

More noticeably, the total number of unique excursions above 180 dropped from 40 (in the 4 weeks without PERT) to 26 (in 4 weeks when using PERT).

The paper itself has a few more details about average fat, protein, and carb intake and any changes. Total daily insulin was relatively similar, carb intake decreased slightly post-PERT but was trending back upward by the end of the 4 weeks. This is likely an artifact of being careful to adjust to PERT and dose effectively for PERT. The number of meals decreased but the average carb entry per meal increased, too.

What I find really interesting is the assessment we did on variability, overall and looking at specific meal times. The breakfast meal was identical during both time periods, and this is where you can really SEE visible changes pre- and post-PERT. Figure 2 (displayed below), shows the difference in the rate of change frequency. There’s less of the higher rate of changes (red) post-PERT than there is from pre-PERT (blue).

Figure 2 from GV analysis on EPI, showing lower frequency of high rate of change post-PERT

Similarly, figure 3 from the paper shows all glucose data pre- and post-PERT, and you can see the fewer excursions >180 (blue dotted line) in the post-PERT glucose data.

Figure 3 from GV analysis paper on EPI showing lower number of excursions above 180 mg/dL

Table 1 in the paper has all the raw data, and Figure 1 plots the most relevant graphs side by side so you can see pre- and post-PERT before and after after all meals on the left, versus pre and post-PERT before and after breakfast only. Look at TOR >180 and the reduction in post-breakfast levels after PERT! Similarly, HBGI post-PERT after-breakfast is noticeably different than HBGI pre-PERT after-breakfast.

Here’s a look at the HBGI for breakfast only, I’ve highlighted in purple the comparison after breakfast for pre- and post-PERT:

High Blood Glucose Index (HBGI) pre- and post-PERT for breakfast only, showing reduction in post-PERT after breakfast

Discussion

This is a paper looking at n=1 data, but it’s not really about the n=1 here. (See the awesome limitation section for more detail, where I point out it’s n=1, it’s not a clinical study, the person has ‘moderate’ EPI, there wasn’t fat/protein data from pre-PERT, it may not be representative of all people with diabetes with EPI or EPI in general.)

What this paper is about is illustrating the types of analyses that are possible, if only we would capture and analyze the data. There are gaping holes in the scientific knowledge base: unanswered and even unasked questions about what happens to blood glucose with various medications, and this data can help answer them! This data shows minimal changes to TIR but visible and significant changes to post-meal glycemic variability (especially after breakfast!). Someone who had a lower TIR or wasn’t using an open source AID may have more obvious changes in TIR following PERT commencement.

This paper shows several ways we can more easily detect efficacy of new-onset medications, whether it is enzymes for PERT or other commonly used medications for people with diabetes.

For example, we could do a similar study with metformin, looking at early changes in glycemic variability in people newly prescribed metformin. Wouldn’t it be great, as a person with diabetes, to be able to more quickly resolve the uncertainty of “is this even working?!” and not have to suffer through potential side effects for 3-6 months or longer waiting for an A1c lab test to verify whether the metformin is having the intended effects?

Specifically with regards to EPI, it can be hard for some people to tell if PERT “is working”, because they’re asymptomatic, they are relying on lab data for changes in fat soluble vitamin levels (which may take time to change following PERT commencement), etc. It can also be hard to get the dosing “right”, and there is little guidance around titrating in general, and no studies have looked at titration based on macronutrient intake, which is something else that I’m working on. So, having a method such as these types of GV analysis even for a person without diabetes who has newly discovered EPI might be beneficial: GV changes could be an earlier indicator of PERT efficacy and serve as encouragement for individuals with EPI to continue PERT titration and arrive at optimal dosing.

Conclusion

As I wrote in the paper:

It is possible to use glycemic variability to assess changes in glycemic outcomes in response to new-onset medications, such as pancreatic enzyme replacement therapy (PERT) in people with exocrine pancreatic insufficiency (EPI) and insulin-requiring diabetes. More studies should use AID and CGM data to assess changes in glycemic outcomes and variability to add to the knowledge base of how medications affect glucose levels for people with diabetes. Specifically, this n=1 data analysis demonstrates that glycemic variability can be useful for assessing post-PERT response in someone with suspected or newly diagnosed EPI and provide additional data points regarding the efficacy of PERT titration over time.

I’m super excited to continue this work and use all available datasets to help answer more questions about PERT titration and efficacy, changes to glycemic variability, and anything else we can learn. For this study, I collaborated with the phenomenal Arsalan Shahid, who serves as technology solutions lead at CeADAR (Ireland’s Centre for Applied AI at University College Dublin), who helped make this study and paper possible. We’re looking for additional collaborators, though, so feel free to reach out if you are interested in working on similar efforts or any other research studies related to EPI!

Findings from the world’s first RCT on open source AID (the CREATE trial) presented at #ADA2022

September 7, 2022 UPDATEI’m thrilled to share that the paper with the primary outcomes from the CREATE trial is now published. You can find it on the journal site here, or view an author copy here. You can also see a Twitter thread here, if you are interested in sharing the study with your networks.

Example citation:

Burnside, M; Lewis, D; Crocket, H; et al. Open-Source Automated Insulin Delivery in Type 1 Diabetes. N Engl J Med 2022;387:869-81. DOI:10.1056/NEJMoa2203913


(You can also see a previous Twitter thread here summarizing the study results, if you are interested in sharing the study with your networks.)

TLDR: The CREATE Trial was a multi-site, open-labeled, randomized, parallel-group, 24-week superiority trial evaluating the efficacy and safety of an open-source AID system using the OpenAPS algorithm in a modified version of AndroidAPS. Our study found that across children and adults, the percentage of time that the glucose level was in the target range of 3.9-10mmol/L [70-180mg/dL] was 14 percentage points higher among those who used the open-source AID system (95% confidence interval [CI], 9.2 to 18.8; P<0.001) compared to those who used sensor augmented pump therapy; a difference that corresponds to 3 hours 21 minutes more time spent in target range per day. The system did not contribute to any additional hypoglycemia. Glycemic improvements were evident within the first week and were maintained over the 24-week trial. This illustrates that all people with T1D, irrespective of their level of engagement with diabetes self-care and/or previous glycemic outcomes, stand to benefit from AID. This study concluded that open-source AID using the OpenAPS algorithm within a modified version of AndroidAPS, a widely used open-source AID solution, is efficacious and safe.

The backstory on this study

We developed the first open source AID in late 2014 and shared it with the world as OpenAPS in February 2015. It went from n=1 to (n=1)*2 and up from there. Over time, there were requests for data to help answer the question “how do you know it works (for anybody else)?”. This led to the first survey in the OpenAPS community (published here), followed by additional retrospective studies such as this one analyzing data donated by the community,  prospective studies, and even an in silico study of the algorithm. Thousands of users chose open source AID, first because there was no commercial AID, and later because open source AID such as the OpenAPS algorithm was more advanced or had interoperability features or other benefits such as quality of life improvements that they could not find in commercial AID (or because they were still restricted from being able to access or afford commercial AID options). The pile of evidence kept growing, and each study has shown safety and efficacy matching or surpassing commercial AID systems (such as in this study), yet still, there was always the “but there’s no RCT showing safety!” response.

After Martin de Bock saw me present about OpenAPS and open source AID at ADA Scientific Sessions in 2018, we literally spent an evening at the dinner table drawing the OpenAPS algorithm on a napkin at the table to illustrate how OpenAPS works in fine grained detail (as much as one can do on napkin drawings!) and dreamed up the idea of an RCT in New Zealand to study the open source AID system so many were using. We sought and were granted funding by New Zealand’s Health Research Council, published our protocol, and commenced the study.

This is my high level summary of the study and some significant aspects of it.

Study Design:

This study was a 24-week, multi-centre randomized controlled trial in children (7–15 years) and adults (16–70 years) with type 1 diabetes comparing open-source AID (using the OpenAPS algorithm within a version of AndroidAPS implemented in a smartphone with the DANA-i™ insulin pump and Dexcom G6® CGM), to sensor augmented pump therapy. The primary outcome was change in the percent of time in target sensor glucose range (3.9-10mmol/L [70-180mg/dL]) from run-in to the last two weeks of the randomized controlled trial.

  • This is a LONG study, designed to look for rare adverse events.
  • This study used the OpenAPS algorithm within a modified version of AndroidAPS, meaning the learning objectives were adapted for the purpose of the study. Participants spent at least 72 hours in “predictive low glucose suspend mode” (known as PLGM), which corrects for hypoglycemia but not hyperglycemia, before proceeding to the next stage of closed loop which also then corrected for hyperglycemia.
  • The full feature set of OpenAPS and AndroidAPS, including “supermicroboluses” (SMB) were able to be used by participants throughout the study.

Results:

Ninety-seven participants (48 children and 49 adults) were randomized.

Among adults, mean time in range (±SD) at study end was 74.5±11.9% using AID (Δ+ 9.6±11.8% from run-in; P<0.001) with 68% achieving a time in range of >70%.

Among children, mean time in range at study end was 67.5±11.5% (Δ+ 9.9±14.9% from run-in; P<0.001) with 50% achieving a time in range of >70%.

Mean time in range at study end for the control arm was 56.5±14.2% and 52.5±17.5% for adults and children respectively, with no improvement from run-in. No severe hypoglycemic or DKA events occurred in either arm. Two participants (one adult and one child) withdrew from AID due to frustrations with hardware issues.

  • The pump used in the study initially had an issue with the battery, and there were lots of pumps that needed refurbishment at the start of the study.
  • Aside from these pump issues, and standard pump site/cannula issues throughout the study (that are not unique to AID), there were no adverse events reported related to the algorithm or automated insulin delivery.
  • Only two participants withdrew from AID, due to frustration with pump hardware.
  • No severe hypoglycemia or DKA events occurred in either study arm!
  • In fact, use of open source AID improved time in range without causing additional hypoglycemia, which has long been a concern of critics of open source (and all types of) AID.
  • Time spent in ‘level 1’ and ‘level 2’ hyperglycemia was significantly lower in the AID group as well compared to the control group.

In the primary analysis, the mean (±SD) percentage of time that the glucose level was in the target range (3.9 – 10mmol/L [70-180mg/dL]) increased from 61.2±12.3% during run-in to 71.2±12.1% during the final 2-weeks of the trial in the AID group and decreased from 57.7±14.3% to 54±16% in the control group, with a mean adjusted difference (AID minus control at end of study) of 14.0 percentage points (95% confidence interval [CI], 9.2 to 18.8; P<0.001). No age interaction was detected, which suggests that adults and children benefited from AID similarly.

  • The CREATE study found that across children and adults, the percentage of time that the glucose level was in the target range of 3.9-10mmol/L [70-180mg/dL] was 14.0 percentage points higher among those who used the open-source AID system compared to those who used sensor augmented pump therapy.
  • This difference reflects 3 hours 21 minutes more time spent in target range per day!
  • For children AID users, they spent 3 hours 1 minute more time in target range daily (95% CI, 1h 22m to 4h 41m).
  • For adult AID users, they spent 3 hours 41 minutes more time in target range daily (95% CI, 2h 4m to 5h 18m).
  • Glycemic improvements were evident within the first week and were maintained over the 24-week trial. Meaning: things got better quickly and stayed so through the entire 24-week time period of the trial!
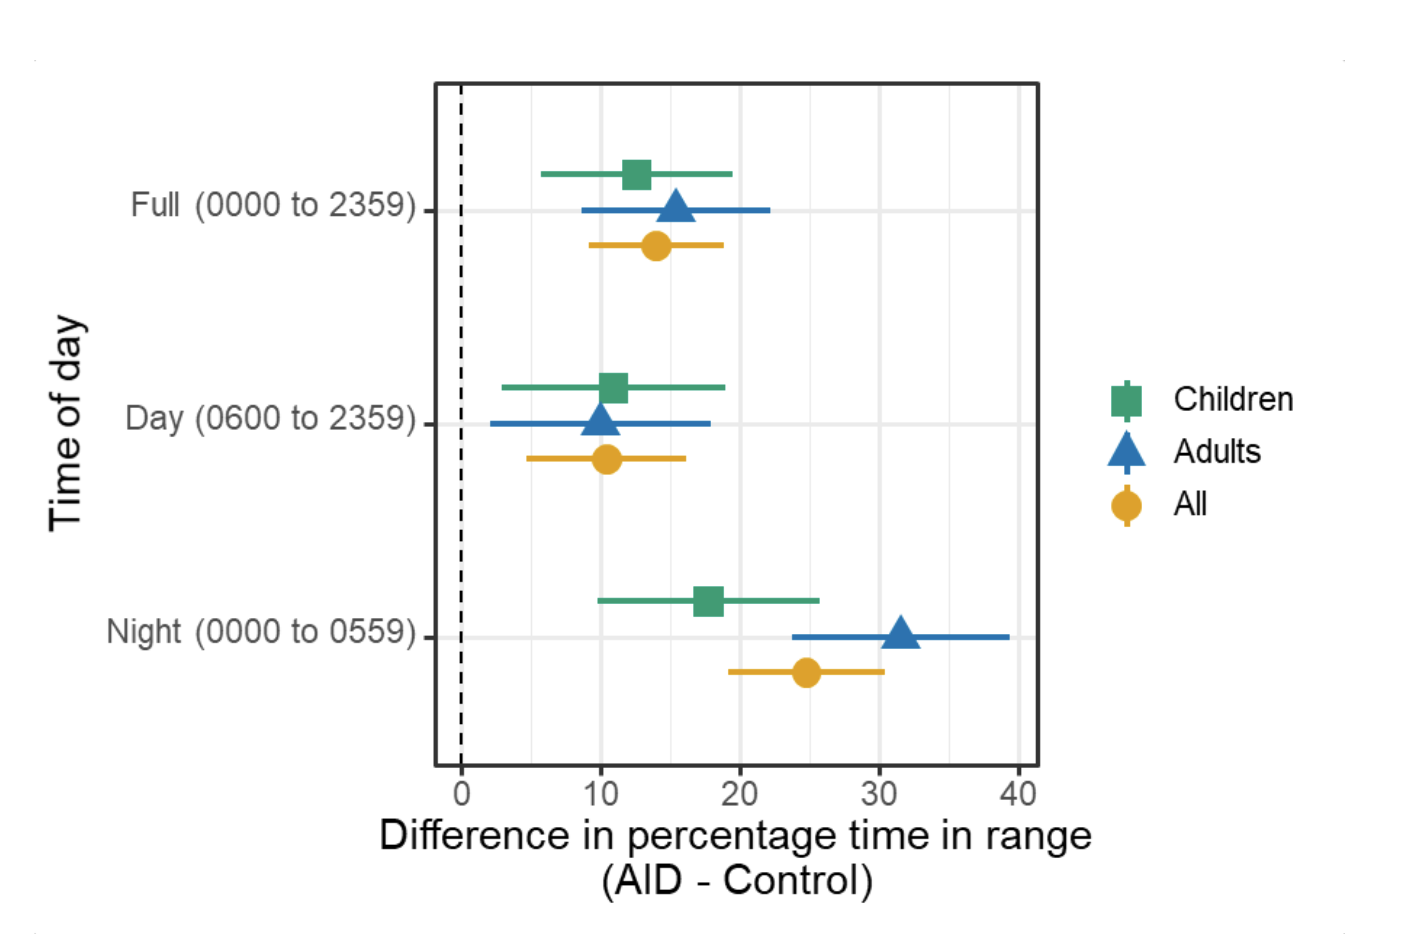
  • AID was most effective at night.
Difference between control and AID arms overall, and during day and night separately, of TIR for overall, adults, and kids

One thing I think is worth making note of is that one criticism of previous studies with open source AID is regarding the self-selection effect. There is the theory that people do better with open source AID because of self-selection and self-motivation. However, the CREATE study recruited a diverse cohort of participants, and the study findings (as described above) match all previous reports of safety and efficacy outcomes from previous studies. The CREATE study also found that the greatest improvements in TIR were seen in participants with lowest TIR at baseline. This means one major finding of the CREATE study is that all people with T1D, irrespective of their level of engagement with diabetes self-care and/or previous glycemic outcomes, stand to benefit from AID.

This therefore means there should be NO gatekeeping by healthcare providers or the healthcare system to restrict AID technology from people with insulin-requiring diabetes, regardless of their outcomes or experiences with previous diabetes treatment modalities.

There is also no age effect observed in the trail, meaning that the results of the CREATE Trial demonstrated that open-source AID is safe and effective in children and adults with type 1 diabetes. If someone wants to use open source AID, they would likely benefit, regardless of age or past diabetes experiences. If they don’t want to use open source AID or commercial AID…they don’t have to! But the choice should 100% be theirs.

In summary:

  • The CREATE trial was the first RCT to look at open source AID, after years of interest in such a study to complement the dozens of other studies evaluating open source AID.
  • The conclusion of the CREATE trial is that open-source AID using the OpenAPS algorithm within a version of AndroidAPS, a widely used open-source AID solution, appears safe and effective.
  • The CREATE trial found that across children and adults, the percentage of time that the glucose level was in the target range of 3.9-10mmol/L [70-180mg/dL] was 14.0 percentage points higher among those who used the open-source AID system compared to those who used sensor augmented pump therapy; a difference that reflects 3 hours 21 minutes more time spent in target range per day.
  • The study recruited a diverse cohort, yet still produced glycemic outcomes consistent with existing open-source AID literature, and that compare favorably to commercially available AID systems. Therefore, the CREATE Trial indicates that a range of people with type 1 diabetes might benefit from open-source AID solutions.

Huge thanks to each and every participant and their families for their contributions to this study! And ditto, big thanks to the amazing, multidisciplinary CREATE study team for their work on this study.


September 7, 2022 UPDATE – I’m thrilled to share that the paper with the primary outcomes from the CREATE trial is now published. You can find it on the journal site here, or like all of the research I contribute to, access an author copy on my research paper.

Example citation:

Burnside, M; Lewis, D; Crocket, H; et al. Open-Source Automated Insulin Delivery in Type 1 Diabetes. N Engl J Med 2022;387:869-81. DOI:10.1056/NE/Moa2203913

Note that the continuation phase study results are slated to be presented this fall at another conference!

Findings from the RCT on open source AID, the CREATE Trial, presented at #ADA2022

Presentations and poster content from @DanaMLewis at #2018ADA

DanaMLewis_ADA2018As I mentioned, I am honored to have two presentations and a co-authored poster being presented at #2018ADA. As per my usual, I plan to post all content and make it fully available online as the embargo lifts. There will be three sets of content:

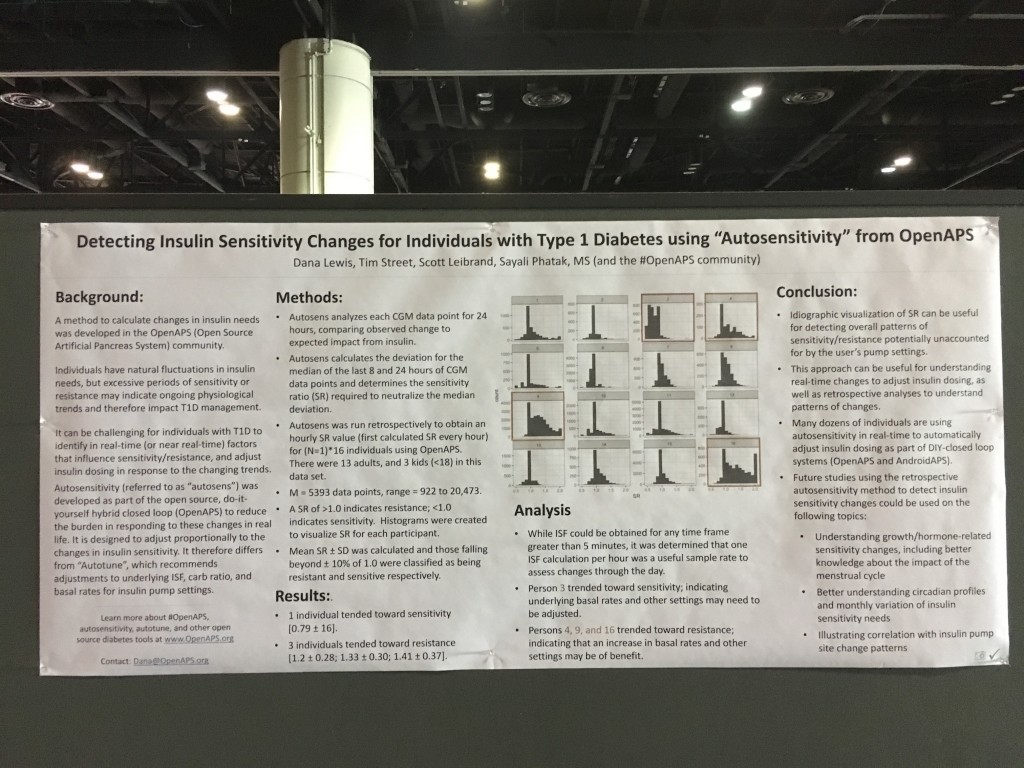
  • Poster 79-LB in Category 12-A Detecting Insulin Sensitivity Changes for Individuals with Type 1 Diabetes using “Autosensitivity” from OpenAPS’ poster, co-authored by Dana Lewis, Tim Street, Scott Leibrand, and Sayali Phatak.
  • Content from my presentation Saturday, The Data behind DIY Diabetes—Opportunities for Collaboration and Ongoing Research’, which is part of the “The Diabetes Do-It-Yourself (DIY) Revolution” Symposium!
  • Content from my presentation Monday, Improvements in A1c and Time-in-Range in DIY Closed-Loop (OpenAPS) Users’, co-authored by Dana Lewis, Scott Swain, and Tom Donner.

First up: the autosensitivity poster!

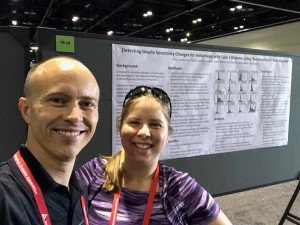
Dana_Scott_ADA2018_autosens_posterYou can find the full write up and content of the autosensitivity poster in a post over on OpenAPS.org. There’s also a twitter thread if you’d like to share this poster with others on Twitter or elsewhere.

Summary: we ran autosensitivity retrospectively on the command line to assess patterns of sensitivity changes for 16 individuals who had donated data in the OpenAPS Data Commons. Many had normal distributions of sensitivity, but we found a few people who trended sensitive or resistant, indicating underlying pump settings could likely benefit from a change.
2018 ADA poster on Autosensitivity from OpenAPS by DanaMLewis


Presentation:
The Data behind DIY Diabetes—Opportunities for Collaboration and Ongoing Research’

This presentation was a big deal to me, as it was flanked by 3 other excellent presentations on the topic of DIY and diabetes. Jason Wittmer gave a great overview and context setting of DIY diabetes, ranging from DIY remote monitoring and CGM tools all the way to DIY closed loops like OpenAPS. Jason is a dad who created OpenAPS rigs for his son with T1D. Lorenzo Sandini spoke about the clinician’s perspective for when patients come into the office with DIY tools. He knows it from both sides – he’s using OpenAPS rigs, and also has patients who use OpenAPS. And after my presentation, Joyce Lee also spoke about the overarching landscape of diabetes and the role DIY plays in this emerging technology space.

Why did I present as part of this group today? One of the roles I’ve taken on in the last few years in the OpenAPS community (among others) is a collaborator and facilitator of research with and about the community. I put together the first outcomes study (see here in JDST or here in a blog post form on OpenAPS.org) in 2016. We presented a poster on Autotune last year at ADA (see here in a blog post form on OpenAPS.org). I’ve also worked to create and manage the OpenAPS Data Commons, as well as build tools for researchers to use this data, so individuals can easily and anonymously donate their DIY closed loop data for other research projects, lowering the friction and barriers for both patients and researchers. And, I’ve co-led or led several research projects with the community’s data as a result.

My presentation was therefore about setting the stage with background on OpenAPS & how we ended up creating the OpenAPS Data Commons; presenting a selection of research projects that have utilized data from the community; highlighting other research projects working with the OpenAPS community; announcing a new international collaboration (OPEN – more coming on that in the future!) for research with the DIY community; and hopefully encouraging other diabetes researchers to think about sharing their work, data, methods, tools, and insights as openly possible to help us all move forward with improving the lives of people with diabetes.

That is, of course, quite an abbreviated summary! I’ve shared a thread on Twitter that goes into detail on each of the key points as part of the presentation, or there’s a version of this Twitter/presentation content also written below.

If you’re someone who wants to do research with retrospective data from the OpenAPS Data Commons, you can find out more about it here (including instructions on how to request data). And if you’re interested in prospective research, please do reach out as well!

Full content for those who don’t want to read Twitter:

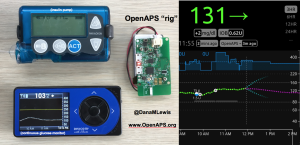
Patients are often seen as passive recipients of care, but many of us PWDs have discovered that problems are opportunities to change things. My journey to DIY began after I was frustrated by my inability to hear CGM alarms at night. 4 years ago, there was no way for me to access my own device data in real time OR retrospectively. Thanks to John Costik for sharing his code, I was able to get my CGM data & send it to the cloud and down to my phone, creating a louder alarm. Scott and I created an algorithm to push notifications to me to take action. This was an ‘open loop’ system we called #DIYPS. With Ben West’s help, we realized could combine our algorithm with small, off-the-shelf hardware & a radio stick to automate insulin delivery. #OpenAPS was thus created, open sourcing all components of DIY closed loop system so others could close the loop, too. An #OpenAPS rig consists of a small computer, radio chip, & battery. The hardware is constantly evolving. Many of us also use Nightscout to visualize our closed loop data, and share with loved ones.

2018ADA_slide12018ADA_slide 42018ADA_slide 32018ADA_Slide 2


I closed the loop in December of 2015. As people learned about it, I got pushback: “It works for you, but how do you know it’s going to work for others?” I didn’t, and I said so. But that didn’t mean I shouldn’t share what was working for me.

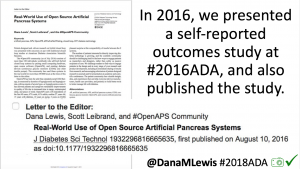
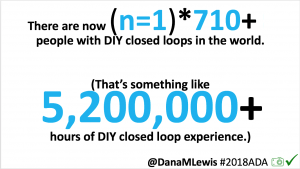
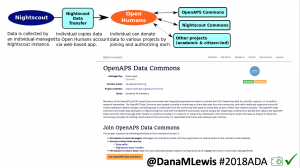
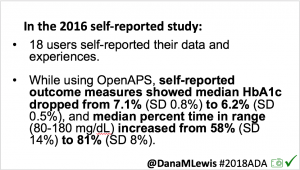
Once we had dozens of users of #OpenAPS, we presented a research study at #2016ADA, with 18 individuals sharing outcomes data on A1c, TIR, and QOL improvements. (See that publication here: https://twitter.com/danamlewis/status/763782789070192640 ). I was often asked to share my data for people to analyze, but I’m not representative of entire #OpenAPS community. Plus, the community has kept growing: we estimate there are more than (n=1)*710+ (as of June 2018) people worldwide using different kinds of DIY APs. (Note: if you’d like to keep track of the growing #OpenAPS community, the count of loopers worldwide is updated periodically at  https://openaps.org/outcomes ).  I began to work with Open Humans to build the #OpenAPS Data Commons, enabling individuals to anonymously upload their data and consent to share it with the Data Commons.

2018ADA_Slide 52018ADA_Slide 62018ADA_Slide 72018ADA_Slide 8


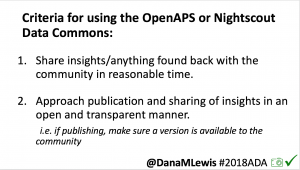
Criteria for using the #OpenAPS Data Commons:

  • 1) share insights back with the community, especially if you find something about an individual’s data set where we should notify them
  • 2) publish in an accessible (and preferably open) manner

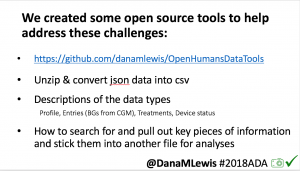
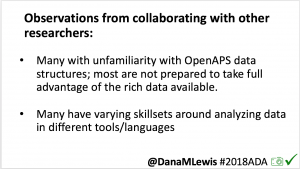
I’ve learned that not many are prepared to take advantage of the rich (and complex) data available from #OpenAPS users; and many researchers have varying background and skillsets.  To aid researchers, I created a series of open source tools (described here: http://bit.ly/2l5ypxq, and tools available at https://github.com/danamlewis/OpenHumansDataTools ) to help researchers & patients working with data.

2018ADA_Slide 10 2018ADA_Slide 9


We have a variety of research projects that have leveraged the anonymously donated, DIY closed loop data from the #OpenAPS Data Commons.

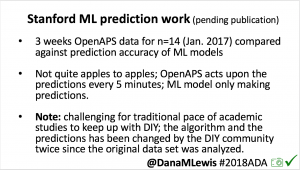
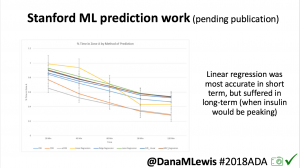
  • 2018ADA_Slide 112018ADA_Slide 12One research project, in collaboration with a Stanford team, evaluated published machine learning model predictions & #OpenAPS predictions. Some models (particularly linear regression) = accurate predictions in short term, but less so longer term when insulin peaks. This study is pending publication, but I’d like to note the challenge of more traditional research keeping pace with DIY innovation: the code (and data) studied was from January 2017. #OpenAPS prediction code has been updated 2x since then.
  • In response to the feedback from the #2016ADA #OpenAPS Outcomes study we presented, a follow up study on #OpenAPS outcomes was created in partnership with a team at Johns Hopkins. That study will be presented on Monday, 6-6:15pm (352-OR).
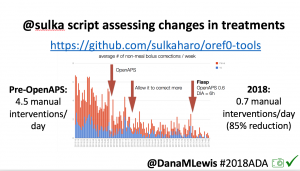
  • 2018ADA_Slide 13Many people share publicly online their outcomes with DIY closed loops. Sulka Haro has shared his script to evaluate the reduction in daily manual diabetes interventions after they began using #OpenAPS. Before: 4.5/day manual corrections; now they treat <1/day.
  • #OpenAPS features such as autosensitivity automatically detect sensitivity changes and insulin needs, improving outcomes. (See above at the top of this post for the full poster content).
  • If you missed it at #2017ADA (see here: http://bit.ly/2rMBFmn) , Autotune is a tool for assessing changes to basal rates, ISF, and carb ratio. Developed for #OpenAPS users but can also be used by traditional pumpers (and some MDI users also utilize it).

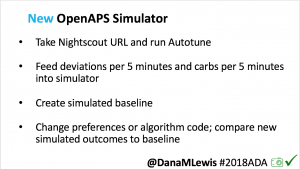
I’m also thrilled to share a new tool we’ve created: an #OpenAPS simulator to allow us to more easily back-test and compare settings changes & feature changes in #OpenAPS code.
2018ADA_Slide 14

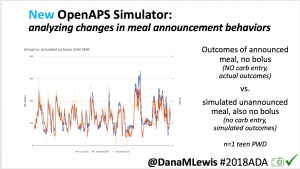
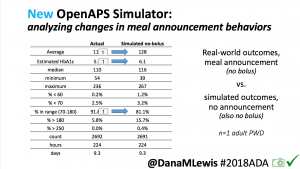
  • Screen Shot 2018-06-22 at 4.48.06 PM2018ADA_Slide 16  We pulled a recent week of data for n=1 adult PWD who does no-bolus, rough carb entry meal announcements, and ran the simulator to predict what the outcomes would be for no-bolus and no meal-announcement.


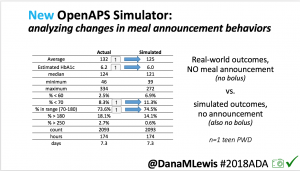
  • 2018ADA_Slide 172018ADA_Slide 18 We also ran the simulator on n=1 teen PWD who does no-bolus and no-meal-announcement in real life. The simulator tracked closely to his actual outcomes (validated this week with a lab-A1c of 6.1)


The new #OpenAPS simulator will allow us to better test future algorithm changes and features across a diverse data set donated by DIY closed loop users.

There are many other studies & collaborations ongoing with the DIY community.

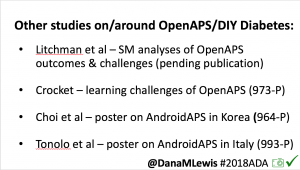
  • Michelle Litchman, Perry Gee, Lesly Kelly, and myself have a paper pending review analyzing social-media-reported outcomes & themes from DIY community.
  • 2018ADA_Slide 19There are also multiple other posters about DIY outcomes here at #2018ADA:
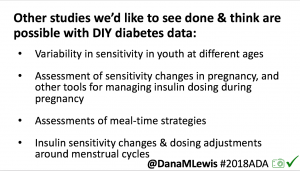
  • 2018ADA_Slide 20 There are many topics of interest in DIY community we’d like to see studies on, and have data for. These include: “eating soon” (optimal insulin dosing for lesser post-prandial spikes); and variability in sensitivity for various ages, pregnancy, and menstrual cycle.
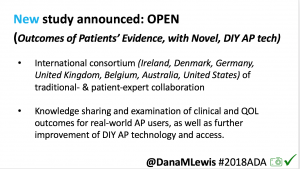
  • 2018ADA_Slide 21I’m also thrilled to announce funding will be awarded to OPEN (a new collaboration on Outcomes of Patients’ Evidence, with Novel, DIY-AP tech), a 36-month international collaboration assessing outcomes, QOL, further development, access of real-world AP tech, etc. (More to come on this soon!)

In summary: we don’t have a choice in living with diabetes. We *do* have a choice to DIY, and also to research to learn more and improve knowledge and availability of tools for us PWDs, more quickly. We would love to partner and collaborate with anyone interested in working with the DIY community, whether that is utilizing the #OpenAPS Data Commons for retrospective studies or designing prospective studies. If you take away one thing today: let it be the request for us to all openly share our tools, data, and insights so we can all make life with type 1 diabetes better, faster.

2018ADA_Slide 222018ADA_Slide 23


A huge thank you as always to the community: those who have donated and shared data; those who have helped develop, test, troubleshoot, and otherwise help power the #OpenAPS and other DIY diabetes communities.

2018ADA_Slide 24

Presentation:
Improvements in A1c and Time-in-Range in DIY Closed-Loop (OpenAPS) Users

(full tweet thread available here; or a description of this presentation below)

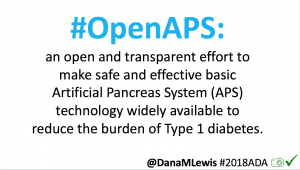
#OpenAPS is an open and transparent effort to make safe and effective Artificial Pancreas System (APS) technology widely available to reduce the burden of Type 1 diabetes. #OpenAPS evolved from my first DIY closed loop system and our desire to openly share what we’ve learned living with DIY closed loops. It takes a small, off-the-shelf computer; a radio; and a battery to communicate with existing insulin pumps and CGMs. As a PWD, I care a lot about safety: the safety reference design is the first thing in #OpenAPS that was shared, in order to help set expectations around what a DIY closed loop can (and cannot) do.

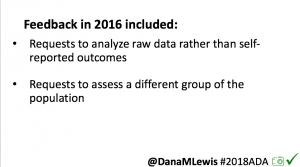
ADA2018_Slide 23ADA2018_Slide 24As I shared about my own DIY experience, people questioned whether it would work for others, or just me. At #2016ADA, we presented an outcomes study with data from 18 of the first 40 DIY closed loop users. Feedback on that study included requests to evaluate CGM data, given concerns around accuracy of self-reported outcomes.

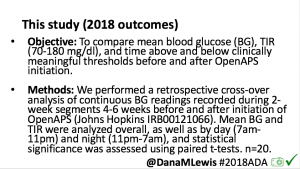
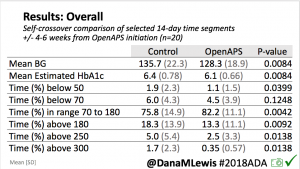
This 2018 #OpenAPS outcomes study was the result. We performed a retrospective cross-over analysis of continuous BG readings recorded during 2-week segments 4-6 weeks before and after initiation of OpenAPS.

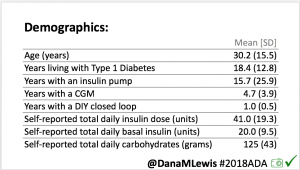
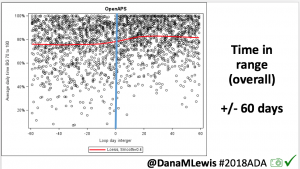
ADA2018_Slide 26For this study, n=20 based on the availability of data that met the stringent protocol requirements (and the limited number of people who had both recorded that data and donated it to the #OpenAPS Data Commons in early 2017).  Demographics show that, like the 2016 study, the people choosing to #OpenAPS typically have lower A1C than the average T1D population; have had diabetes for over a decade; and are long-time pump and CGM users. Like the 2016 study, this 2018 study found mean BG and TIR improved across all time categories (overall, day, and nighttime).

ADA2018_Slide 28ADA2018_Slide 29ADA2018_Slide 30ADA2018_Slide 31ADA2018_Slide 32

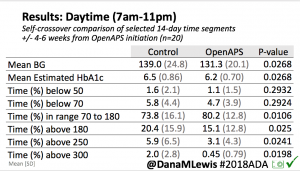
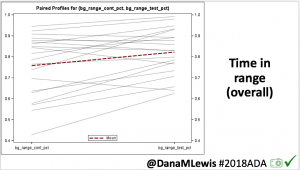
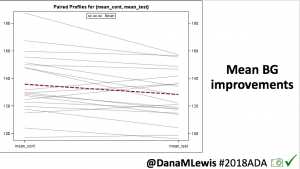
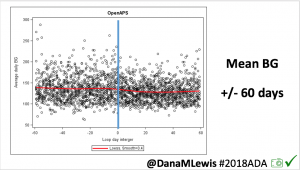
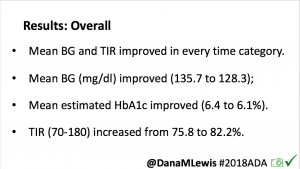
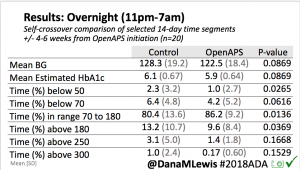
Overall, mean BG (mg/dl) improved (135.7 to 128.3); mean estimated HbA1c improved (6.4 to 6.1%). TIR (70-180) increased from 75.8 to 82.2%. Overall, time spent high and low were all reduced, in addition to eAG and A1c reduction. Overnight (11pm-7am) had smaller improvement in all categories compared to daytime improvements in these categories.

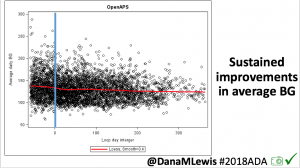
Notably: although this study primarily focused on a 4-6 week time frame pre-looping vs. 4-6 weeks post-looping, the improvements in all categories are sustained over time by #OpenAPS users.

ADA2018_Slide 33 ADA2018_Slide 34

ADA2018_Slide 35Conclusion: Even with tight initial control, persons with T1D saw meaningful improvements in estimated A1c, TIR, and a reduction in time spent high and low, during the day and at night, after initiating #OpenAPS. Although this study focused on BG data from CGM, do not overlook additional QOL benefits when analyzing benefits of hybrid closed loop therapy or designing future studies! See these examples shared from Sulka Haro and Jason Wittmer as example of quality of life impacts of #OpenAPS.

A huge thank you to the community: those who have donated and shared data; those who have helped develop, test, troubleshoot, and otherwise help power the #OpenAPS and other DIY diabetes communities.

And, special thank you to my co-authors, Scott Swain & Tom Donner, for the collaboration on this study. Lewis_Donner_Swain_ADA2018

Hormones, CGM preferences, DIY, and why so many things are YDMV even when #WeAreNotWaiting

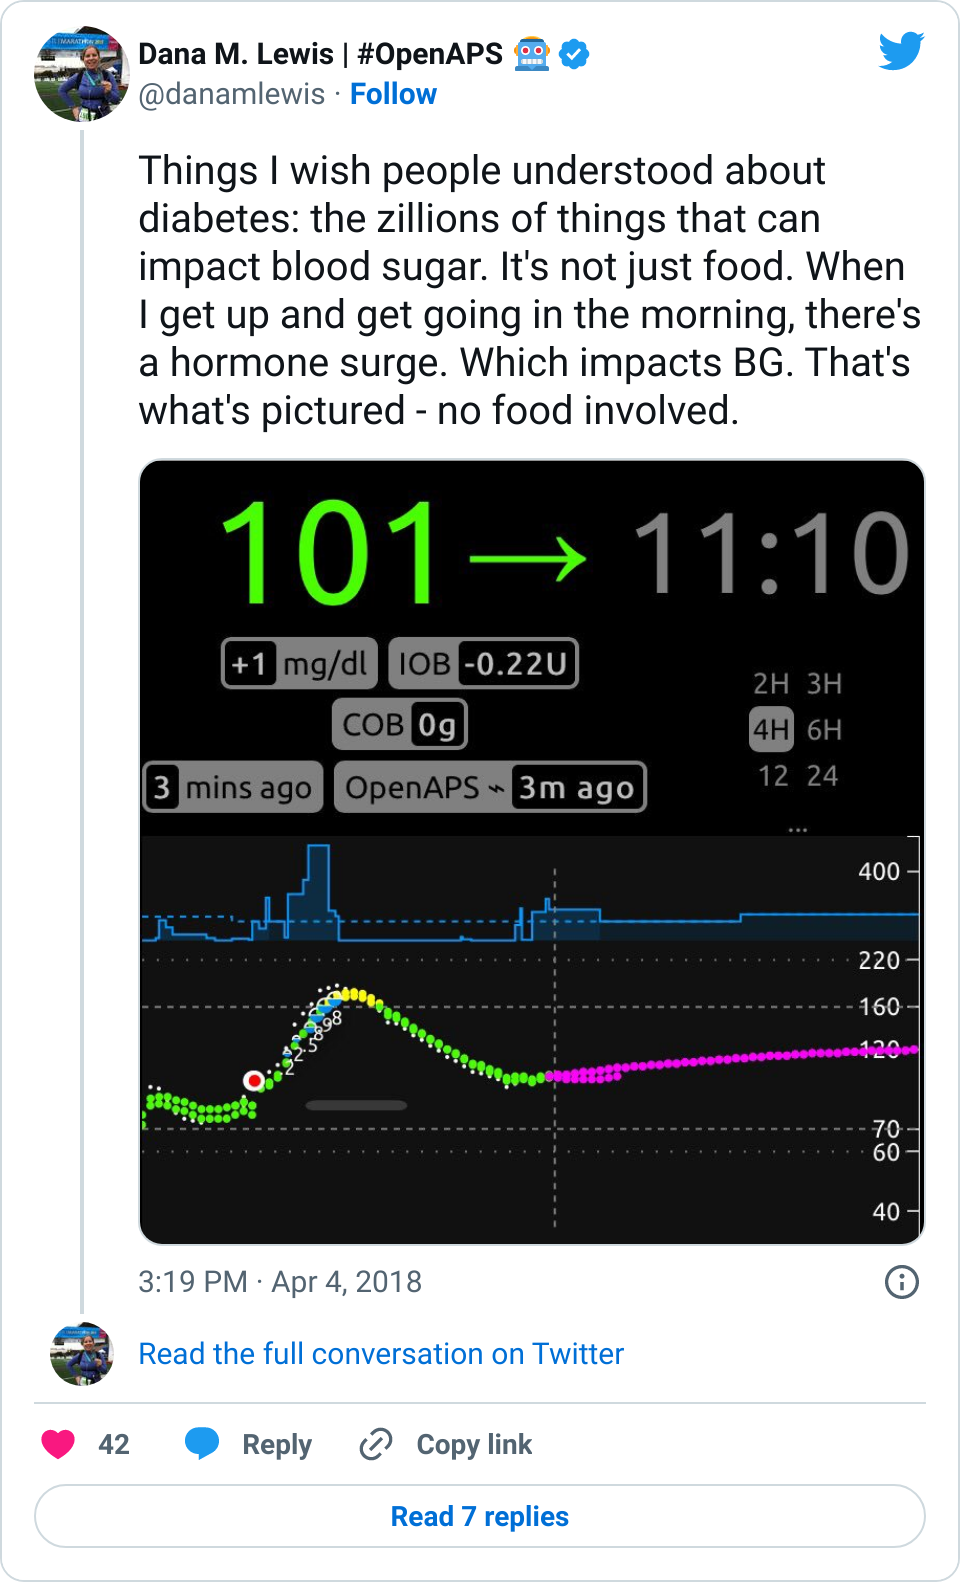
I posted one of my Nightscout graphs yesterday, showing a snapshot of my morning:

Example of how getting out of bed - rather than dawn phenomenon hormones - can increase BG levels.

I hadn’t eaten, and my blood sugar still spiked up. I’ve noticed this happens in the mornings sometimes. When I have mentioned it over the years, people are quick to tell me my basal rates are wrong, and I should adjust them because dawn phenomenon. But actually, this isn’t dawn phenomenon. This happens after I physically get up and start moving for the day, whether that happens at 4am, or 6am, or 10am, or even waking up after noon. So, it’s not a basal thing, and modifying my basal rates doesn’t fix it. (And this is why I wanted to add wake-up mode to my suite of tools, to help address this.)

To me, this is a great example, (as I mentioned in my Twitter thread), of why diabetes is so hard: sooooo many things impact BG levels, and in many cases, we PWDs just have to roll with it and respond the best we can. In my case, #OpenAPS did a great job responding to the spike and bringing me back down within an hour or so.

One of the questions that popped up yesterday in response to that graph, though, was about the BG line: how did I have two BG lines?

The answer: I wear a G4 sensor, and usually have 2 receivers running off the same transmitter and sensor. One receiver is Share-d to my phone, and uploads to NS via the interwebz. The other receiver, although Share-capable, doesn’t (because the company only allows you to pair one receiver and upload via Share). I leave that CGM plugged into a rig to enable it to be a backup for offline looping. When online, this rig with the plugged in CGM uploads BGs from that receiver to NS.

Sometimes, because of different start/stop times and therefore differing calibration records, the receivers “drift” from each other, making it obvious on the graph when that happens.

Because if you give a mouse a cookie, other questions come up, someone had also asked me why I’m using G4, and why not G5. Someone else asked me in a different channel why I’m not using G5 and xDrip+ (a DIY option that doesn’t use Dexcom app or a Dexcom receiver for receiving the data or processing it), or another DIY tool to process my CGM data.

Now, as always, what I chose to use is my personal preference. It’s colored by my preference for what equipment I’m willing to carry; what phone I want to use; what data I want to have; my safety backup preferences; what my insurance covers and what I can afford; where I live; etc. So, just because I use this method, doesn’t mean I expect anyone else to want to do it. It’s just what I do. I don’t try to convince other people to use this method, and I also hope others can share info about what works for them without trying to hammer me over the head because what I’m doing is different. This is where YDMV (your diabetes may vary) comes in. It’s so true, and even within “people who DIY”, there’s a ton of variation – and that’s a good thing! I adore having options to find what works for me, and I want to have other people have options and choices to choose what works for them.

That being said, here’s the answer to how I run my CGMs and some of the things that have factored into my choice to not DIY CGM receivers/data processing most of the time:

  • With two G4 receivers, I can keep one in my pocket, paired to my phone and uploading via Share. When I’m out and about in the city or usually during the day, this is what I carry. When I run, I take the Share receiver.
  • But, I also like emergency back-ups. I like keeping a receiver plugged into an #OpenAPS rig so that if connectivity goes out/down, I can keep looping without a break in my stride. So, I could keep my Share receiver plugged into the rig, but that would involve me unplugging and replugging fairly frequently when I run errands or actually go for a short run, and meh. Hassle. So I keep “non-Share” receiver as the one that’s usually plugged into my ‘offline’ rig.
  • Having the G4 receiver plugged into the rig enables me to see raw data. Raw data is nice for a couple of things: assessing the health of my sensor (if it gets jumpy compared to the filtered data, I know the quality of the sensor is decreasing, and that helps me decide when to change it); giving me a clue to what’s going on when the filtered data goes to ??? or during the start up of a new sensor; and actually being able to run my rig and loop off some* of the raw data when I need to. (*With OpenAPS, you can choose to loop off of it within a certain range, and there’s an option to only set a certain amount of correction for a proportion of what otherwise would be proposed, with a higher level of raw data.)
  • With two receivers running, that also gives me more flexibility around sensor changes. Technically, the sensor is approved for 7 days. At the end of the 7 days, the receiver stops giving you data and forces you to “start” a new sensor session. That could be by inserting a new sensor; or it could be the same sensor on your body. But either way, theoretically it’s a 2 hour ‘warm up’ period from that session where you can’t see data. With 2 receivers, I can stagger the end and start of sensor sessions. I usually set a calendar alarm to restart one of the receivers on the night of the 6th day of the session, allowing me more flexibility on day 7 to choose when to restart or change my sensor.
  • This also means I can choose to “hot swap” when actually changing a sensor. I may choose to not hit ‘stop’ and ‘start’ on a sensor session on one of the receivers, but rather shut it off for about 30 minutes, and just do the stop/start on the other receiver (leaving it plugged into a rig to upload raw data to NS, and be able to see where the new sensor’s readings come in compared to the old one). When I power the non-restarted receiver back on about 30m after swapping the transmitter over to the new receiver (as soon as the raw readings have flattened out), it usually either goes to “no signal” for a few minutes, and then comes back with some data, an hour or more before the restarted sensor allows me to calibrate it and get data. There are downsides to this method: the data on the receiver that didn’t get restarted can be fairly inaccurate, as it’s still using the calibrations from the old sensor. So I don’t always do that, but when it’s more important to me to be able to see relative trend of where BG is (flat, or dropping or spiking), it’s nice to have that option. And since I often soak my new CGM sensors, the data from “day 1” of the sensor after a session “start” on the receiver is often better than if it was truly day 1 of the sensor being in my body.

Phew. Maybe that sounds like a lot of work, but the above setup works well for me for a variety of reasons, and also allows me the flexibility and choice for when I change sensors, when I am forced to be without data or potentially not loop, etc. Given that my schedule varies a lot, it helps since I’m not consistently in the same time zone and what works for starting or changing sensors one week in one part of the world doesn’t always align with convenience exactly 168 hours (7 days) later in another part of the world that I’m in, doing something differently.

Some of the reasons I haven’t switched to G5 include the fact that the transmitters only last for ~3 months instead of 6+ months; I’ve observed many people being frustrated by sensor not talking to the phone even when it’s right beside them; there’s no raw data on G5; you can’t have multiple receivers paired with your transmitter; etc.

Now, you might say, but that’s using Dexcom’s app, etc. With DIY solutions, those limitations don’t apply! And that’s true, to a degree – savvy folks in the community have figured out how to make it so you don’t *have* to use Dexcom’s app to display or process the data; you can replace the batteries on the transmitter; etc. But, just like my method above of using raw data isn’t necessarily going to work for everyone or might not be something someone else choose to do, the DIY options that go with G5 (or even G4 in some cases), aren’t something I believe is the right thing to do for me.

A lot of it comes down to safety. When we first started designing my DIY closed loop, we spent eons discussing how we could do this safely for me. And that evolved into further discussions about how other people could do this safely, too. A core of the OpenAPS Reference Design is that we are using already approved and vetted devices that exist on the market (e.g. existing pumps and CGMs). Those devices include approved and vetted methods for CGM data processing, too, which is even more important when the CGM data is being used to dose insulin as in OpenAPS. Now – this is not a requirement we can enforce: people can do what they want, and some people are even using non-CGMs (such as the Libre, a “Flash Glucose Monitoring” solution, plus a DIY NFC reader) as a CGM source for looping. But, whether it’s a DIY app or algorithm on CGM data, or a different glucose measuring device that’s not a CGM, that’s choice has some safety implications that I hope people are aware of.

First, the background for those who aren’t familiar: the CGM companies display a processed (“filtered”) version of the CGM data. That’s part of their proprietary stuff, but there’s reasons behind it: the raw data can be hectic and weird, and individual readings aren’t the point, anyway. The beauty of CGM is you can see the trends in addition to the estimated BG number.  In some scenarios, such as during sensor starts, during error messages that are displayed as ???, etc, the companies/FDA decided that the CGM should not show data, and instead show an error message/symbol, to help prevent anyone from making incorrect treatment decisions based off of confusing or misleading data.  That’s good enough most of the time.  As mentioned above, there are edge cases when seeing the raw is helpful, but most of the time, I’m happy with the filtered data.

But to me, there’s a difference between using raw or DIY-calibrated data for edge cases, vs. using them all the time. I’ve seen several cases in just the past few days with a newer “DIY CGM app”, which uses its own calibration algorithm for processing the unfiltered CGM readings.  These people have reported the app displaying normal BGs (say, 90 mg/dL), while they found themselves in the 40’s (rather low). It’s not clear whether that is due to the app’s calibration algorithm, something the user did in testing and calibrating, or if it’s just a bad sensor, and since most of them are not using the official receiver/app in parallel, that’s difficult to figure out.  But regardless, it’s happened enough times across numerous people for me to be concerned about a DIY CGM app being used as the primary source of CGM data. There are limitations to using company-built apps or physical devices for CGMs, but in the case where people can afford it, for safety I think it is important to at least use the approved and vetted receiver/app in parallel, to provide a backup and baseline level of alerting and alarming. The FDA & the companies have worked to create something that can be reliable for alarming when your BG is actually low (say <55 mg/dl) and alerting a human that something is going on. This is important regardless of whether people are looping or not, but it’s perhaps even more important when people are looping, since that data is driving insulin dosing decisions. Additionally, the company-created devices have been designed to deal with miscalibrations that aren’t in line with what the data from the receiver is showing, and have safety measures in place to “reject” calibrations and request new ones when necessary. Sure: there are times where that’s frustrating, but those features truly are “there for safety”, and are important for avoiding the rare but potentially serious outcomes that could be caused by incorrect CGM readings. Since safety is what we prioritize and design around in DIY closed looping, I hope people will consider that ,and prioritize safety first when choosing what to use as their primary data source.

Tl;dr – YDMV. I currently use G4 with two receivers, for the reasons described above. I think it’s important to prioritize safety over convenience most of the time, and understand the limitations of the solution that you choose (DIY or commercial). But everyone’s different, and their situation, preferences, etc. may drive different decision making. And did I mention YDMV?

Quantified sickness when you have #OpenAPS and the flu

Getting “real people sick*” is the worst. And it can be terrifying when you have type 1 diabetes, and know the sickness is both likely to send your blood sugars rocketing sky high, as well as leave you exhausted and weak and that much harder to deal with a plummeting low.

*(Scott hates this term because he doesn’t like the implication that PWD’s aren’t real. We’re real, all right. But I like the phrase because it differentiates between feeling bad from blood sugar-related reasons, and the kind of sickness that anyone can get.)

In February 2014, Scott got home from a conference on Friday, and on Saturday complained about being tired with a headache. By Sunday, I started feeling weary with a sore throat. By Monday morning, I had a raging fever, chills, and the bare minimum of energy required to drag myself into the employee health clinic and get diagnosed with the flu. And since they knew I was single and lived by myself, the conversation went from “here’s your prescription for Tamiflu” to “but you can’t be by yourself, maybe we should find a bed for you in the hospital” because of how sick I was. Luckily, I called Scott and asked him to come pick me up and let me stay at his place. And there I stayed in complete misery for several days, the sickest I’d ever been. I remember at one point on the second day, waking up from a fitful doze and seeing Scott standing across the room with his laptop on a dresser, using it as a standing desk because he was so worried about me that he didn’t want to leave the room at that point. It was that bad.

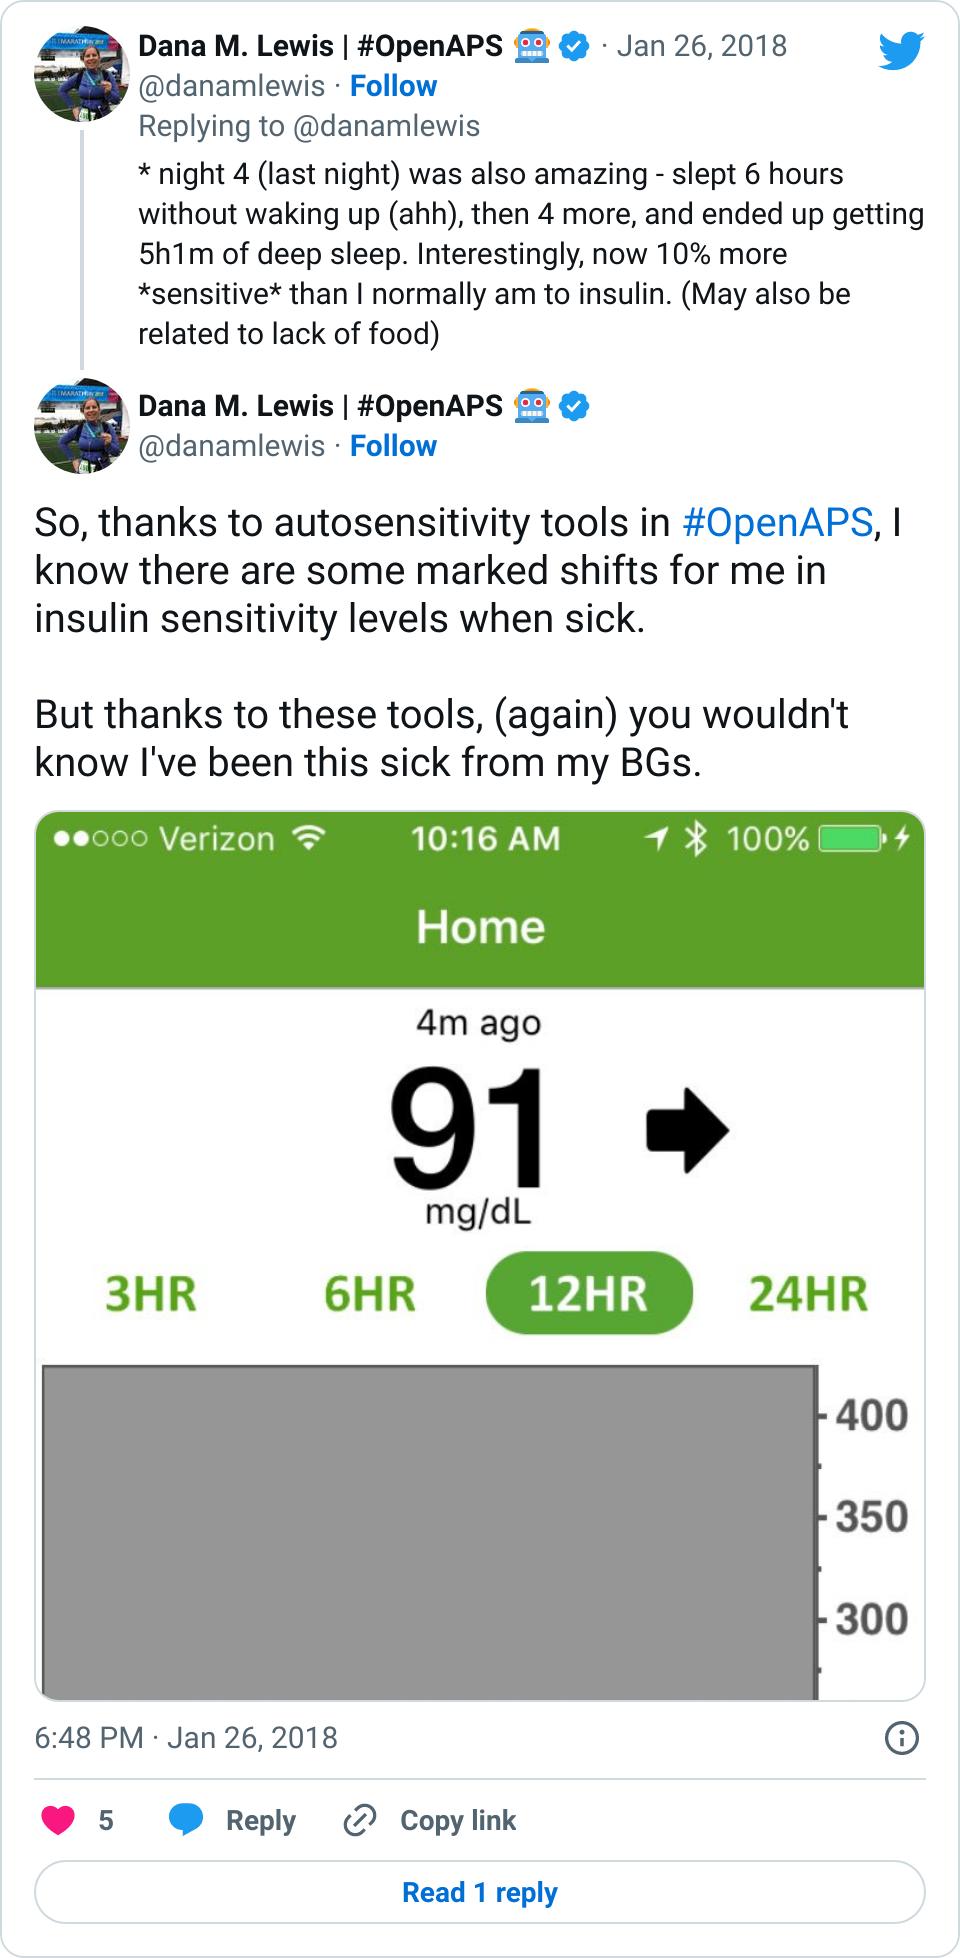
Luckily, I survived. (And good thing, right, given that we went on to build OpenAPS, yes? ;)) This year’s flu experience was different. This year I was real-people sick, but without the diabetes-related fear that I’d so often experienced in the past. My blood sugars were perfectly managed by OpenAPS. I didn’t go low. It didn’t matter if I didn’t eat, or did eat (potato soup, ice cream, and frozen fruit bars were the foods of choice). My BGs stayed almost entirely in range. And because they were so in range that it was odd, I started watching the sensitivity ratio that is calculated by autosensitivity to see how my insulin sensitivity was changing over the course of the sickness. And by day 5, I finally felt good enough to share some of that data (aka, tweet). Here’s what I found from this year’s flu experience:

  • Night 1 was terrible, because I got hardly any deep sleep (45 minutes, whereas 2+h is my usual average per night) and kept waking up coughing. I also was 40% insulin resistant all night long and into Day 2, meaning it took 40% more insulin than usual to keep my BGs at target.
  • Night 2 was even worse – ZERO deep sleep. Ahhhh! It was terrible. Resistance also nudged up to 50%.
  • Night 3 – hallelujah, deep sleep returned. I ended up getting 4h53m of deep sleep, and also was able to sleep for closer to 2 hour blocks at a time, with less coughing. Also, going into night 3 was pretty much the only “high” I had of being sick – up around 180 for a few hours. Then it fell off a cliff and whooshed down to the bottom of my target, marking the drastic end of insulin resistance. After that, insulin sensitivity was fairly normal.
  • Night 4 yielded more deep sleep (>5 hours), and a tad bit of insulin sensitivity (~10%), but it’s unclear whether that’s totally sickness related or more related to the fact that I wasn’t eating much in day 3 and day 4.
  • Night 5 felt like I was going backward – 1h36m of deep sleep, tons of coughing, and interestingly a tad bit of insulin resistance (~20%) again. Night 6 (last night) I supposedly got plenty of deep sleep again (>4h), but didn’t feel like it at all due to coughing. BGs are still perfectly in range, and insulin sensitivity back to usual.

This was all done still with no-bolus, and just carb announcement when I ate whatever it was I was eating. In several cases there was negative IOB on board, but I didn’t have the usual spikes that I would normally see from that. I had 120 carbs of gluten free biscuits and gravy yesterday, and I didn’t go higher than 130mg/dl.

In-range BGs shown on CGM graph thanks to OpenAPS

It’s a weird feeling to have been this sick, and have perfectly normal blood sugars. But that’s why it’s so interesting to be able to look at other data beyond average, time in range, and A1c – we now have the tools and the data to be able to dive in and really understand more about what our bodies are doing in sick situations, whether it’s norovirus or the flu.

I’m thinking if everyone shared their data from when they had the flu, or norovirus, or strep throat, or whatever – we might be able to start to analyze and detect patterns of resistance and otherwise sensitivity changes over the course of typical illness. This way, when someone gets sick with diabetes, we’d know generally “expect around XX% resistance for Days 1-3, and then expect a drop off that looks like this on Day 4”, etc.

That would be way better than the traditional ways of just bracing yourself for sky-high highs and terrible lows with no understanding or ability to make things better during illness. The peace of mind I had during the flu this year was absolutely priceless. Some people will be able to get that with DIY closed loop technology; but as with so many other things we have learned and are learning from this community, I bet we can find ways to help translate these insights to be of benefit for all people with diabetes, regardless of which therapies they have access to or decide to use.

Want to help? Been sick? Consider donating your data to my diabetes sick-day analysis project. What you should do:

  1. If you’re using a closed loop, donate your data to the OpenAPS Data Commons. You can do all your data (yay!), or just the time frame you’ve been sick. Use the “message the project owner” feature to anonymously message and share what kind of illness you had, and the dates of sickness.
  2. Not using a closed loop, but have Nightscout? Donate your data to the Nightscout Data Commons, and do the same thing: Use the “message the project owner” feature to anonymously message and share what kind of illness you had, and the dates of sickness.

As we have more people who identify batches of sick-day data, I’ll look at what insights we can find around sensitivity changes before, during, and after sickness, plus other insights we can learn from the data.

Why Open Humans is an essential part of my work to change the future of healthcare research

I’ve written about Open Humans before; both in terms of how we’re creating Data Commons there for people using Nightscout and DIY closed loops like OpenAPS to donate data for research, as well as building tools to help other researchers on the Open Humans platform. Madeleine Ball asked me to share some more about the background of the community’s work and interactions with Open Humans, along with how it will play into the Opening Pathways grant work, so here it is! This is also posted on the OpenHumans blog. Thanks, Madeleine, and Open Humans!


So, what do you like about Open Humans?

Health data is important to individuals, including myself, and I think it’s important that we as a society find ways to allow individuals to be able to chose when and how we share our data. Open Humans makes that very easy, and I love being able to work with the Open Humans team to create tools like the Nightscout Data Transfer uploader tool that further anonymizes data  uploads. As an individual, this makes it easy to upload my own diabetes data (continuous glucose monitoring data, insulin dosing data, food info, and other data) and share it with projects that I trust. As a researcher, and as a partner to other researchers, it makes it easy to build Data Commons projects on Open Humans to leverage data from the DIY artificial pancreas community to further healthcare research overall.

Wait, “artificial pancreas”? What’s that?

I helped build a DIY “artificial pancreas” that is really an “automated insulin delivery system”. That means a small computer & radio device that can get data from an insulin pump & continuous glucose monitor, process the data and decide what needs to be done, and send commands to adjust the insulin dosing that the insulin pump is doing. Read, write, read, rinse, repeat!

I got into this because, as a patient, I rely on my medical equipment. I want my equipment to be better, for me and everyone else. Medical equipment often isn’t perfect. “One size fits all” really doesn’t fit all. In 2013, I built a smarter alarm system for my continuous glucose monitor to make louder alarms. In 2014, with the partnership of others like Ben West who is also a passionate advocate for understanding medical devices, I “closed the loop” and built a hybrid closed loop artificial pancreas system for myself. In early 2015, we open sourced it, launching the OpenAPS movement to make this kind of technology more broadly accessible to those who wanted it.

You must be the only one who’s doing something like this

Actually, no. There are more than 400+ people worldwide using various types of DIY closed loop systems – and that’s a low estimate! It’s neat to live during a time when off the shelf hardware, existing medical devices, and open source software can be paired to improve our lives. There’s also half a dozen (or more) other DIY solutions in the diabetes community, and likely other examples (think 3D-printing prosthetics, etc.) in other types of communities, too. And there should be even more than there are – which is what I’m hoping to work on.

So what exactly is your project that’s being funded?

I created the OpenAPS Data Commons to address a few issues. First, to stop researchers from emailing and asking me for my individual data. I by no means represent all other DIY closed loopers or people with diabetes! Second, the Data Commons approach allows people to donate their data anonymously to research; since it’s anonymized, it is often IRB-exempt. It also makes this data available to people (patient researchers) who aren’t affiliated with an organization and don’t need IRB approval or anything fancy, and just need data to test new algorithm features or investigate theories.

But, not everyone implicitly knows how to do research. Many people learn research skills, but not everyone has the wherewithal and time to do so. Or maybe they don’t want to become a data science expert! For a variety of reasons, that’s why we decided to create an on-call data science and research team, that can provide support around forming research questions and working through the process of scientific discovery, as well as provide data science resources to expedite the research process. This portion of the project does focus on the diabetes community, since we have multiple Data Commons and communities of people donating data for research, as well as dozens of citizen scientists and researchers already in action (with more interested in getting involved).

What else does Open Humans have to do with it?

Since I’ve been administering the Nightscout and OpenAPS Data Commons, I’ve spent a lot of time on the Open Humans site as both a “participant” of research donating my data, as well as a “researcher” who is pulling down and using data for research (and working to get it to other researchers). I’ve been able to work closely with Madeleine and suggest the addition of a few features to make it easier to use for research and downloading large data sets from projects. I’ve also been documenting some tools I’ve created (like a complex json to csv converter; scripts to pull data from multiple OH download files and into a single file for analysis; plus writing up more details about how to work with data files coming from Nightscout into OH), also with the goal of facilitating more researchers to be able to dive in and do research without needing specific tool or technical experience.

It’s also great to work with a platform like Open Humans that allows us to share data or use data for multiple projects simultaneously. There’s no burdensome data collection or study procedures for individuals to be able to contribute to numerous research projects where their data is useful. People consent to share their data with the commons, fill out an optional survey (which will save them from having to repeat basic demographic-type information that every research project is interested in), and are done!

Are you *only* working with the diabetes community?

Not at all. The first part of our project does focus on learning best practices and lessons learned from the DIY diabetes communities, but with an eye toward creating open source toolkit and materials that will be of use to many other patient health communities. My goal is to help as many other patient health communities spark similar #WeAreNotWaiting projects in the areas that are of most use to them, based on their needs.

How can I find out more about this work?
Make sure to read our project announcement blog post if you haven’t already – it’s got some calls to action for people with diabetes; people interested in leading projects in other health communities; as well as other researchers interested in collaborating! Also, follow me on Twitter, for more posts about this work in progress!

Why a non-academic (patient) publishes in academic journals

Today I was able to share that my Letter to the Editor was published in the Journal of Diabetes Science and Technology. It’s on why we need to set expectations to help patients successfully adopt hybrid closed loop/artificial pancreas/automated insulin delivery system technology. (You can read it via image copies in the first link.)

JDST_screenshot_LTE_expectationsI’ve published a few times in academic journals. Last year, Scott and I published another Letter to the Editor in JDST with the OpenAPS outcomes study we had presented at the 2016 ADA Scientific Sessions conference.

But, I’m sure people are wondering why I choose to do so – especially as I am 1) a patient and 2) a non-academic. (Although in case you missed it – I’m now the Principal Investigator on a grant-funded study!)

While there are many healthcare providers, researchers, industry employees, FDA staff, etc. who read blogs like this and are up to speed on the bleeding edge of diabetes technology… there are easily 10x the number that do not.

And if they don’t know about the existence of this world, they won’t know about the valuable lessons we’re learning and won’t be able to share those lessons and knowledge with other healthcare providers and the patients that they treat.

So, in my pursuit to find more ways to share knowledge from our community with the rest of the diabetes community, this is why we submit abstracts for posters and presentations to conferences like ADA’s Scientific Sessions. Our abstracts are evaluated just like the abstracts from traditional healthcare providers (as far as they can tell, I’m just another academic, albeit one with fewer credentials ;)), and I’m proud that they’re evaluated and deemed worthy of poster presentations alongside mainstream researchers. Ditto for our written publications, whether they be letters to the editor or other types of articles submitted to journals and publications.

We need to find more ways to share and distribute knowledge with the “traditional” medical and academic research world. And I’d love to do more – so please share ideas if you have them. And if you’re someone who bridges the gap to the traditional world, I appreciate your help sharing these types of articles and conversations with your colleagues.

What I wish CDEs (diabetes educators) and other HCPs knew about DIY and other diabetes tech (#OpenAPS or otherwise)

I had the awesome opportunity to present at #AADE17, the annual education meeting for the American Association of Diabetes Educators, this past weekend. My topic was about OpenAPS and DIY diabetes… which really translates to some broader things I want all educators and HCPs to know about patients and technology, whether it’s DIY or just unknown to them. Unfortunately AADE didn’t record or livestream my session, so I wanted to write up a summary of the content here.

(If you’re new to this blog/me/OpenAPS, you can also watch this June 2017 TEDX talk where I share some of the story of how I ended up with a DIY artificial pancreas and how the OpenAPS community came to be; or this older talk from OSCON 2016 as well. As always, if you’re curious to learn more about OpenAPS or wondering how to build your own DIY artificial pancreas, OpenAPS.org is the first place to learn more!)

Diabetes is hard. Even if you are privileged to have access to insulin, education, and technology – it can still be so incredibly hard to get it right. And even if you do everything “right”, the outcomes will still vary. And after all, the devices themselves are not perfect, and we still have diabetes.

The lack of varying alarms and the unchangeable volume is what led me to create DIYPS (my open loop and louder alarm system), and the same frustration with lack of data access and visualization led John Costik, Lane Desborough, Ben West, and so many others to explore creating other DIY tools, such as Nightscout. And thanks to social media, we all didn’t have to create in a vacuum: we can share code (this is what open source means) and insight through social media, and build upon each other’s work. As a result, these collaborations, sharing, and iterative development is how OpenAPS, the open source artificial pancreas system movement, was created.

I tweet and talk and share frequently about how great it is having #OpenAPS in my life. Norovirus? No problem. Changes in sensitivity due to exercise? Not the biggie it used to be.

Showing flat overnight CGM graph representing sleep uninterupted by hypoglycemia thanks to OpenAPS

However, this technology is by no means a cure. It still requires work on the part of the person with diabetes. We still have to:

  • Change pump sites
  • Change CGM sensors
  • Calibrate regularly
  • Deal with bonked pump sites and sensors that fall out

And also, given the speed of insulin, most people are still going to engage with the system for some kind of meal bolus or announcement. This is why it’s called “hybrid” closed loop technology. (However, depending on the sophistication of the technology, you start to get to be able to choose what you want to optimize for and the behaviors you want to choose to do less of, which is great.)

In some cases, we humans know more than the technology: such as when a meal is going to happen/is coming, and when exercise is going to happen. So it’s nice to be able to interoperate your devices and be able to use your phone, watch, computer, etc. to be able to tell the system what to do differently (i.e. set higher targets in the case of activity, or lower targets to achieve “eating soon” mode , or in the case of waking up).

But in a LOT of cases, it’s tiring for the human to have to think about all the things. Such as whether a pump site is slowly dying and causing apparent insulin resistant. Or such as when you’re more sensitive 12-24 hours after exercise. Or during menstrual cycles. Or when sick. Or during a growth spurt. Or during jet lag. Or during a trip where you can’t find anything to eat. Etc. It’s a lot for us PWD’s to track, and this is where computers come in handy. Things like autosensitivity in OpenAPS to automatically detect changes in sensitivity and adjust the variables for calculations automatically; and autotune, to track the data of what’s actually happening and make recommendations for changing your underlying pump settings (ISF, carb ratio, and basal rates).

And how has this technology been developed by patients? Iteratively, as we figure out what’s possible. It’s not about boiling the ocean; it’s about approaching problems bit by bit as we have new tools to solve them, or new people with energy to think about the problem in different ways. It’s like thinking about getting a car – you wouldn’t expect the manufacturer to sell bits and pieces of the car frame, and you don’t really expect medical device manufacturers to sell bits and pieces of a pump or other device. However, patients are closest to the REAL problems in living with diabetes. Instead of a “car”, they’re looking for solutions for getting from point A to point B. And so in the car analogy, that means starting with a skateboard, scooter, or bike – and ending up with a car is great, but the car is not the point.

So no, any piece of technology isn’t going to be a cure or solve all problems or work perfectly for everyone. But that is true whether it’s DIY or a commercial tool: one size certainly does not fit all. And patients are individuals with their own lives and their own challenges with diabetes, with different motivations around what aspects of life with diabetes feel like friction and what they feel equipped to tackle and solve.

So, here’s some of what’s on my list for what I’d like CDE’s and other HCP’s to know as a result of the proliferation of technology around diabetes:

  • Yes, DIY tech is often off label. But that’s ok – it just means it’s off label; it doesn’t prevent you from listening to why patients are using it, what we think it’s doing for us, and it doesn’t prevent you from asking questions, learning more, or still advising patients.
  • Don’t make us switch providers by refusing to discuss it or listen to it, just because it’s new/different/you don’t understand it. (By the way: we don’t expect you to understand all possible technology! You can’t be experts on everything, but that doesn’t mean shunning what you don’t know.)
  • You get to take advantage of the opportunity when someone brings something new into the office – it’s probably the first of many times you’ll see it, and the first patient is often on the bleeding edge and deeply engaged and understands what they’re using, and open to sharing what they’ve learned to help you, so you can also help other patients!
  • You also get to take advantage of the open source community. It’s open, not just for patients to use, but for companies, and for CDEs and other HCPs as well. There are dozens if not hundreds of active people on Twitter, Facebook, blogs, forums, and more who are happy to answer questions and help give perspective and insight into why/how/what things are.
  • Don’t forget – many of the DIY tools provide data and insight that currently don’t exist in any traditional and/or commercially and/or FDA-approved tool. Take autotune for example – there’s nothing else out there that we know of that will tune basal rates, ISF, and carb ratio for people with pumps. And the ability of tools like Nightscout reports to show data from a patient’s disparate devices is also incredibly helpful for healthcare providers and educators to use to help patients.

And one final point specific to hybrid closed loop technology: this technology is going to solve a lot of problems and frustrations. But, it may mean that patients will shift the prioritization of other quality of life factors like ease of use over older, traditionally learned diabetes behaviors. This means things like precise carb counting may go by the wayside for general meal size estimations, because the technology yields similar outcomes. Being aware of this will be important for when CDE’s are working with patients; knowing what the patterns of behaviors are and knowing where a patient has shifted their choices will be helpful for identifying what behaviors can be adapted to yield different outcomes.

I think the increase in technology (especially various types of closed loops, DIY and commercial) will yield MORE work for CDE’s and HCP’s, rather than less. This means it’s even more important for them to get up to speed on current and evolving technology – because it’s by no means going away. And the first wave of DIY’ers have a lot we can share and teach not just other patients, but also CDE’s. So again, many thanks to AADE for the opportunity to share some of this perspective at #AADE17, and thanks to everyone for the engagement during and after the session!

Why guess when you don’t have to? (#OpenAPS logs & why they’re handy)

One of the biggest benefits (in my very biased opinion) of a DIY closed loop is this: it’s designed to be understandable to the person using it.

You don’t have to guess “what did it do at 2am?” or “why did it do a temp basal and not an SMB?”

Well, you COULD guess – but you don’t have to. Guessing is a choice ;).

Because we’ve been designing a system that a person has to decide to trust, it provides information about everything it’s doing and the information it has. That’s what “the logs” are for, and you can get information from “the logs” from a couple of places:

  • The OpenAPS “pill” in Nightscout
  • Secondary logging sources like Papertrail
  • Information that shows up on your Pebble watch
  • The full logs from SSH’ing into a rig (usually what we mean when we ask, “what do your logs say?”)

Here’s an example of the information the OpenAPS pill provides me in Nightscout:

Example OpenAPS pill info in Nightscout

This tells me that at 11:03 am, my BG was 121; I had no carbs on board; was dropping a tiny bit as expected and was likely going to end up slightly below my target; and the current temporary basal rate running was about equivalent to what OpenAPS thought I needed at the time. I had 0.47 netIOB, all from basal adjustments. It also specifies some of the eventual numbers that are what trigger the “purple line predictions” displayed in Nightscout, so if you can’t tell where the line is (90 or 100?), you can use the pill information to determine that more easily.

(Here’s the instructions for setting up Nightscout for OpenAPS)

Here’s an example of a log from Papertrail and what it tells us:

Example papertrail usage for OpenAPS

This example is from Katie, who described her daughter’s patterns in the morning: when Anna leaves her rig in the bedroom and went to take a shower, you can see the tune change at around 6:55, meaning she’s out of range of the rig. After the shower, getting dressed, and getting back to the rig around 7:25, it goes back to “normal” tuning (which means reading and writing to the pump as usual).

Papertrail is handy for figuring out if a rig is working or not remotely and high level why it might not be, especially if it’s a communication or power problem. But I generally find it to be most helpful when you know what kind of problem it is, and use it to drill down on a particular thing. However, it’s not going to give you absolutely all the details needed for every problem – so make sure to read about how to access the traditional logs, too, and be able to do that on the go.

(Here’s the instructions for getting Papertrail going for OpenAPS)

Here’s what the logs ported to my Pebble tell me:

OpenAPS logs on Pebble watch @DanaMLewis example

There’s several helpful things that display on my watch (using the excellent “Urchin” watchface designed by Mark Wilson, which you can customize to suit your personal preference): BGs, basal activity, and then some detailed text, similar to what’s in the OpenAPS pill (current BG, the change in BG, timestamp of BG, my netIOB, my eventual BGs, and any temp basal activity). In this case, it’s easy for me to glance and see that I was a bit low for a while; am now flat but have negative net IOB so it’s been high temping a bit to level out the netIOB.

(I’ve always preferred a data-rich watchface – even back in the days of “open looping” with #DIYPS:)

https://twitter.com/danamlewis/status/652566409537433600/photo/1

(Here’s more about the Urchin watchface)

Here’s what the full logs from the rig tell me:

Example OpenAPS logs from the rig

This has a LOT of information in it (which is why it’s so awesome). There are messages being shared by each step of the loop – when it’s listening for “silence” to make sure it can talk successfully to the pump; refreshing pump history; checking the clocks on devices and for fresh BGs; and then processing through the math on what the BG is, where it’s headed, and what needs to happen. You can also see from this example where autosensitivity is kicking in, adjust basals slightly up, target down, and sensitivity down, etc. (And for those who aren’t testing oref1 features like SMB and UAM yet, you’ll get a glimpse of how there’s now additional information in the logs about if those features are currently enabled.)

(Here are some other logs you can watch, and how to run them)

Pro tip for OpenAPS users: if you’re logged into your rig, you just have to type l (the letter “L” but lower case) for it to bring up your logs!

So if you find yourself wondering: what did OpenAPS do/why did it do <thing>? Instead of wondering, start by looking at the logs.

And remember, if you don’t know what the problem is – the full logs are the best source of information for spotting what the main problem is. You can then use the information from the logs to ask about how to resolve a particular problem (Gitter is great for this!)– but part of troubleshooting well/finding out more is taking the first step to pull up your logs, because anyone who is going to help you troubleshoot will need that information to figure out a solution.

And if you ever see someone say “RTFL”, instead of “read the manual” or “read the docs”, it means “read the logs”. 😉 :)