I am very excited to share that a new article I wrote was just published, looking at glycemic variability in data from before and after pancreatic enzyme replacement therapy (PERT) was started in someone with type 1 diabetes with newly discovered exocrine pancreatic insufficiency (EPI or PEI).
If you’re not aware of exocrine pancreatic insufficiency, it occurs when the pancreas no longer produces the amount of enzymes necessary to fully digest food. If that occurs, people need supplementary enzymes, known as pancreatic enzyme replacement therapy (PERT), to help them digest their food. (You can read more about EPI here, and I have also written other posts about EPI that you can find at DIYPS.org/EPI.)
But, like MANY medications, when someone with type 1 diabetes or other types of insulin-requiring diabetes starts taking them, there is little to no guidance about whether these medications will change their insulin sensitivity or otherwise impact their blood glucose levels. No guidance, because there are no studies! In part, this may be because of the limited tools available at the time these medications were tested and approved for their current usage. Also this is likely in part because people with diabetes make up a small fraction of the study participants that most of these medications are tested on. If there are any specific studies on the medications in people with diabetes, these studies likely were done before CGM, so little data is available that is actionable.
As a result, the opportunity came up to review someone’s data who happened to have blood glucose data from a continuous glucose monitor (CGM) as well as a log of what was eaten (carbohydrate entries) prior to commencing pancreatic enzyme replacement therapy. The tracking continued after commencing PERT and was expanded to also include fat and protein entries. As a result, there was a useful dataset to compare the impacts of pancreatic enzyme replacement therapy on blood glucose outcomes and specifically, looking at glycemic variability changes!
(You can read an author copy here of the full paper and also see the supplementary material here, and the DOI for the paper is https://doi.org/10.1177/19322968221108414 . Otherwise, below is my summary of what we did and the results!)
—
In addition to the above background, it’s worth noting that Type 1 diabetes is known to be associated with EPI. In upwards of 40% of people with Type 1 diabetes, elastase levels are lowered, which in other cases is correlated with EPI. However, in T1D, there is some confusion as to whether this is always the case or not. Based on recent discussions with endocrinologists who treat patients with T1D and EPI (and have patients with lowered elastase that they think don’t have EPI), I don’t think there have been enough studies looking at the right things to assess whether people with T1D and lowered elastase levels would benefit from PERT and thus have EPI. More on this in the future!
Because we now have technology such as AID (automated insulin delivery) and CGM, it’s possible to evaluate things beyond simple metrics of “average blood sugar” or “A1c” in response to taking new medications. In this paper, we looked at some basic metrics like average blood sugar and percent time in range (TIR), but we also did quite a few calculations of variables that tell us more about the level of variability in glucose levels, especially in the time frames after meals.
Methods
This person had tracked carb entries through an open source AID system, and so carb entries and BG data were available from before they started PERT. We call this “pre-PERT”, and selected 4 weeks worth of data to exclude major holidays (as diet is known to vary quite a bit during those times). We then compared this to “post-PERT”, the first 4 weeks after the person started PERT. The post-PERT data not only included BGs and carb entries, but also had fat and protein entries as well as PERT data. Each time frame included 13,975 BG data points.
We used a series of open source tools to get the data (Nightscout -> Nightscout Data Transfer Tool -> Open Humans) and process the data (my favorite Unzip-Zip-CSVify-OpenHumans-data.sh script).
All of our code for this paper is open source, too! Check it out here. We analyzed time in range, TIR 70-180, time out of range, TOR >180, time below range, TBR <70 and <54, the number of hyperglycemic excursions >180. We also calculated total daily dose of insulin, average carbohydrate intake, and average carbohydrate entries per day. Then we calculated a series of variability related metrics such as Low Blood Glucose Index (LBGI), High Blood Glucose Index (HBGI), Coefficient of Variation (CV), Standard Deviation (SD), and J_index (which stresses both the importance of the mean level and variability of glycemic levels).
Results
This person already had an above-goal TIR. Standard of care goal for TIR is >70%; before PERT they had 92.12% TIR and after PERT it was 93.70%. Remember, this person is using an open source AID! TBR <54 did not change significantly, TBR <70 decreased slightly, and TOR >180 also decreased slightly.
More noticeably, the total number of unique excursions above 180 dropped from 40 (in the 4 weeks without PERT) to 26 (in 4 weeks when using PERT).
The paper itself has a few more details about average fat, protein, and carb intake and any changes. Total daily insulin was relatively similar, carb intake decreased slightly post-PERT but was trending back upward by the end of the 4 weeks. This is likely an artifact of being careful to adjust to PERT and dose effectively for PERT. The number of meals decreased but the average carb entry per meal increased, too.
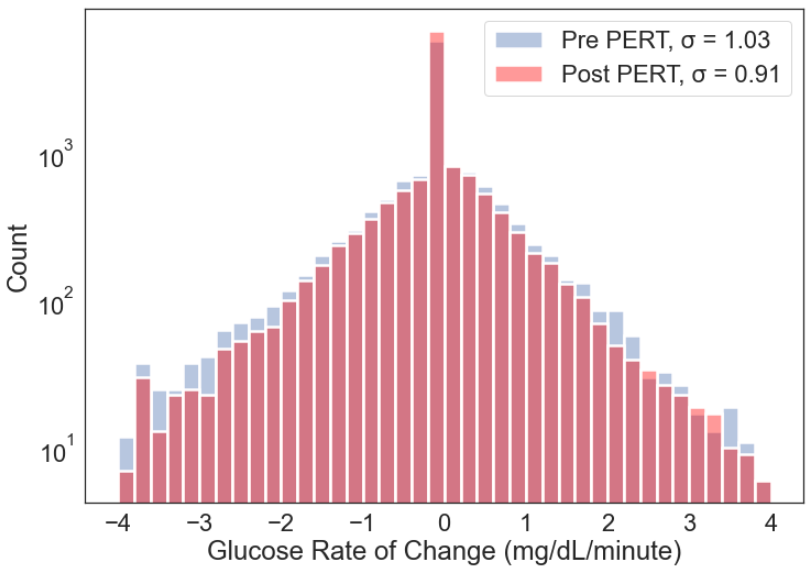
What I find really interesting is the assessment we did on variability, overall and looking at specific meal times. The breakfast meal was identical during both time periods, and this is where you can really SEE visible changes pre- and post-PERT. Figure 2 (displayed below), shows the difference in the rate of change frequency. There’s less of the higher rate of changes (red) post-PERT than there is from pre-PERT (blue).
Similarly, figure 3 from the paper shows all glucose data pre- and post-PERT, and you can see the fewer excursions >180 (blue dotted line) in the post-PERT glucose data.
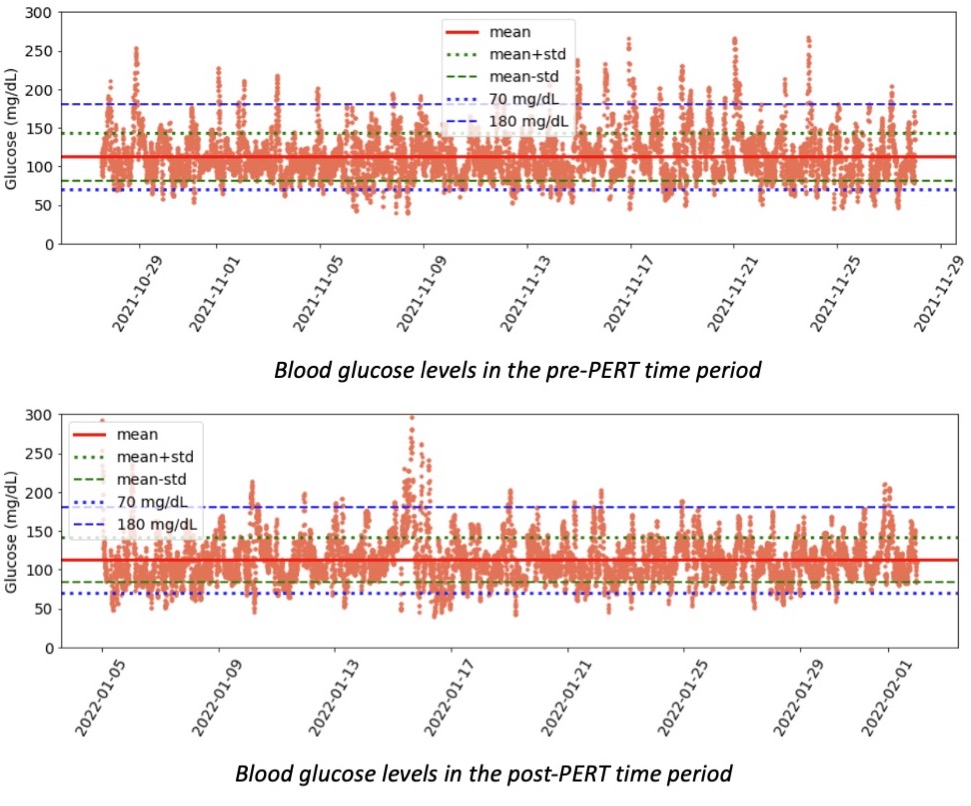
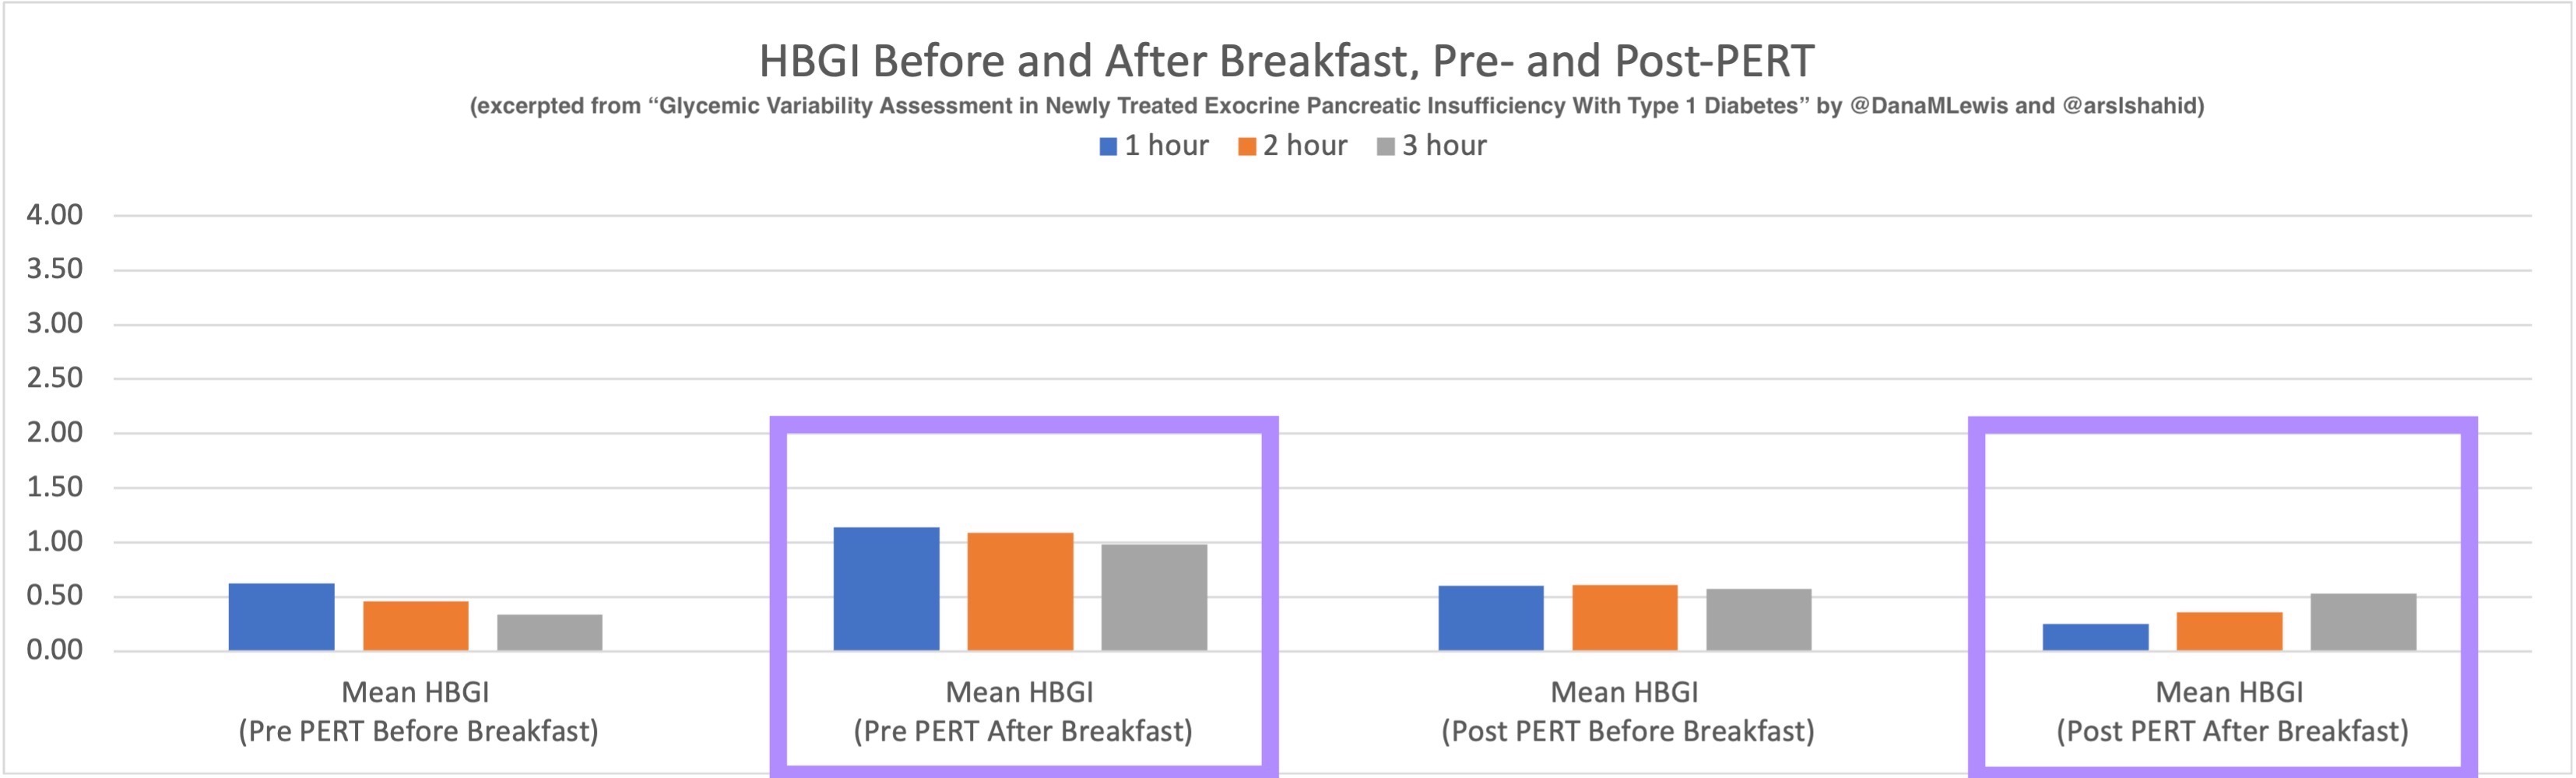
Table 1 in the paper has all the raw data, and Figure 1 plots the most relevant graphs side by side so you can see pre- and post-PERT before and after after all meals on the left, versus pre and post-PERT before and after breakfast only. Look at TOR >180 and the reduction in post-breakfast levels after PERT! Similarly, HBGI post-PERT after-breakfast is noticeably different than HBGI pre-PERT after-breakfast.
Here’s a look at the HBGI for breakfast only, I’ve highlighted in purple the comparison after breakfast for pre- and post-PERT:
Discussion
This is a paper looking at n=1 data, but it’s not really about the n=1 here. (See the awesome limitation section for more detail, where I point out it’s n=1, it’s not a clinical study, the person has ‘moderate’ EPI, there wasn’t fat/protein data from pre-PERT, it may not be representative of all people with diabetes with EPI or EPI in general.)
What this paper is about is illustrating the types of analyses that are possible, if only we would capture and analyze the data. There are gaping holes in the scientific knowledge base: unanswered and even unasked questions about what happens to blood glucose with various medications, and this data can help answer them! This data shows minimal changes to TIR but visible and significant changes to post-meal glycemic variability (especially after breakfast!). Someone who had a lower TIR or wasn’t using an open source AID may have more obvious changes in TIR following PERT commencement.
This paper shows several ways we can more easily detect efficacy of new-onset medications, whether it is enzymes for PERT or other commonly used medications for people with diabetes.
For example, we could do a similar study with metformin, looking at early changes in glycemic variability in people newly prescribed metformin. Wouldn’t it be great, as a person with diabetes, to be able to more quickly resolve the uncertainty of “is this even working?!” and not have to suffer through potential side effects for 3-6 months or longer waiting for an A1c lab test to verify whether the metformin is having the intended effects?
Specifically with regards to EPI, it can be hard for some people to tell if PERT “is working”, because they’re asymptomatic, they are relying on lab data for changes in fat soluble vitamin levels (which may take time to change following PERT commencement), etc. It can also be hard to get the dosing “right”, and there is little guidance around titrating in general, and no studies have looked at titration based on macronutrient intake, which is something else that I’m working on. So, having a method such as these types of GV analysis even for a person without diabetes who has newly discovered EPI might be beneficial: GV changes could be an earlier indicator of PERT efficacy and serve as encouragement for individuals with EPI to continue PERT titration and arrive at optimal dosing.
Conclusion
As I wrote in the paper:
It is possible to use glycemic variability to assess changes in glycemic outcomes in response to new-onset medications, such as pancreatic enzyme replacement therapy (PERT) in people with exocrine pancreatic insufficiency (EPI) and insulin-requiring diabetes. More studies should use AID and CGM data to assess changes in glycemic outcomes and variability to add to the knowledge base of how medications affect glucose levels for people with diabetes. Specifically, this n=1 data analysis demonstrates that glycemic variability can be useful for assessing post-PERT response in someone with suspected or newly diagnosed EPI and provide additional data points regarding the efficacy of PERT titration over time.
I’m super excited to continue this work and use all available datasets to help answer more questions about PERT titration and efficacy, changes to glycemic variability, and anything else we can learn. For this study, I collaborated with the phenomenal Arsalan Shahid, who serves as technology solutions lead at CeADAR (Ireland’s Centre for Applied AI at University College Dublin), who helped make this study and paper possible. We’re looking for additional collaborators, though, so feel free to reach out if you are interested in working on similar efforts or any other research studies related to EPI!
Recent Comments