Why DIY AID in 2023? #ADA2023 Debate

I was asked to participate in a ‘debate’ about AID at #ADA2023 (ADA Scientific Sessions), representing the perspective that DIY systems should be an option for people living with diabetes.

I present this perspective as a person with type 1 diabetes who has been using DIY AID for almost a decade (and as a developer/contributor to the open source AID systems used in DIY) – please note my constant reminder that I am not a medical doctor.

Dr. Gregory P. Forlenza, an Associate Professor from Barbara Davis Center, presented a viewpoint as a medical doctor practicing in the US.

FYI: here are my disclosures and Dr. Forlenza’s disclosures:

On the left is my slide (Dana M. Lewis) showing I have no commercial support or conflicts of interest. My research in the last 3 years has previously been funded by the New Zealand Health Research Council (for the CREATE Trial); JDRF; and DiabetesMine. Dr. Forlenza lists research support from NIH, JDRF, NSF, Helmsley Charitable Trust, Medtronic, Dexcom, Abbott, Insulet, Tandem, Beta Bionics, and Lilly. He also lists Consulting/Speaking/AdBoard: Medtronic, Dexcom, Abbott, Insulet, Tandem, Beta Bionics, and Lilly.

I opened the debate with my initial presentation. I talk about the history of DIY in diabetes going back to the 1970s, when people with diabetes had to “DIY” with blood glucose meters because initially healthcare providers did not want people to fingerstick at home because they might do something with the information. Similarly, even insulin pumps and CGMs have been used in different “DIY” ways over the years – notably, people with diabetes began dosing insulin using CGM data for years prior to them being approved for that purpose. It’s therefore less of a surprise in that context to think about DIY being done for AID. (If you’re reading this you probably also know that DIY AID was done years before commercial AID was even available; and that there are multiple DIY systems with multiple pump and CGM options, algorithms, and phone options).

And, for people with diabetes, using DIY is very similar to how a lot of doctors recommend or prescribe doing things off label. Diabetes has a LOT of these types of recommendations, whether it’s different types of insulins used in pumps that weren’t approved for that type of insulin; medications for Type 2 being used for Type 1 (and vice versa); and other things that aren’t regulatory approved at all but often recommended anyway. For example, GLP-1’s that are approved for weight management and not glycemic control, but are often prescribed for glycemic control reasons. Or things like Vitamin D, which are widely prescribed or recommended as a supplement even though it is not regulatory-approved as a pharmaceutical agent.

I always like to emphasize that although open source AID is not necessarily regulated (but can be: one open source system has received regulatory clearance recently), that’s not a synonym for ‘no evidence’. There’s plenty of high quality scientific evidence on DIY use and non-DIY use of open source AID. There’s even a recent RCT in the New England Journal of Medicine, not to mention several other RCTs (see here and here, plus another pending publication forthcoming). In addition to those gold-standard RCTs, there are also reviews of large-scale big data datasets from people with diabetes using AID, such as this one where we reviewed 122 people’s glucose data representing 46,070 days’ worth of data; or another forthcoming publication where we analyzed the n=75 unique (distinct from the previous dataset) DIY AID users with 36,827 days’ of data (average of 491 days per participant) and also found above goal TIR outcomes (e.g. mean TIR 70-180 mg/dL of 82.08%).

Yet, people often choose to DIY with AID not just for the glucose outcomes. Yes, commercial AID systems (especially now second-generation) can similarly reach the goal of 70+% TIR on average. DIY helps provide more choices about the type and amount of work that people with diabetes have to put IN to these systems in order to get these above-goal OUTcomes. They can choose, overall or situationally, whether to bolus, count carbs precisely, announce meals at all, or only announce relative meal size while still achieving >80% TIR, no or little hypoglycemia, and less hyperglycemia. Many people using DIY AID for years have been doing no-bolus and/or no meal announcements at all, bringing this closer to a full closed loop, or at least, an AID system with very, very little user input required on a daily basis if they so choose. I presented data back in 2018(!) showing how this was being done in DIY AID, and it was recently confirmed in a randomized control trial (hello, gold standard!) showing that between traditional use (with meal announcements and meal boluses); meal announcement only (no boluses); and no announcement nor bolusing, that they all got similar outcomes in terms of TIR (all above-goal). There was also no difference in those modes of total daily insulin dose (TDD) or amount of carb intake. There was a small difference in time below range being slightly higher in the first mode (where people were counting carbs and bolusing) as compared to the other two modes – which suggests that MORE user input may actually be limiting the capabilities of the system!

The TLDR here is that people with diabetes can do less work/provide less input into AID and still achieve the same level of ideal, above-goal outcomes – and ongoing studies are showing the increased QOL and other patient-reported outcomes that also improve as a result.

Again, people may be predisposed to think that the main difference between commercial and DIY is whether or not it is regulatory approved (and therefore prescribable by doctors and able to be supported by a company under warranty); the bigger differences are instead around interoperability across devices, data access, and transparency of how the system works.

There’s even an international consensus statement on open source AID, created by an international group of 48 medical and legal experts, endorsed by 9 national and international diabetes organizations, supporting that open source AID used in DIY AID is a safe and effective treatment option, confirming that the scientific evidence exists and it has the potential to help people with diabetes and reduce the burden of diabetes. They emphasize that doctors should support patient (and caregiver) autonomy and choice of DIY AID, and state that doctors have a responsibility to learn about all options that exist including DIY. The consensus statement is focused on open source AID but also, in my opinion, applies to all AID: they say that AID systems should fully disclose how they operate to enable informed decisions and that all users should have real-time and open access to their own data. Yes, please! (This is true of DIY but not true of all commercial systems.)

The elephant in the room that I always bring up is cost, insurance coverage, and therefore access and accessibility of AID. Many places have government or insurance that won’t cover AID. For example, the proposed NICE guidelines in the UK wouldn’t provide AID to everyone who wants one. In other places, some people can get their pump covered but not CGM, or vice versa, and must pay out of pocket. Therefore in some cases, DIY has out of pocket costs (because it’s not covered by insurance), but is still cheaper than AID with insurance coverage (if it’s even covered).

I also want to remind everyone that choosing to DIY – or not – is not a once-in-a-lifetime decision. People who use DIY choose every day to use it and continue to use it; at any time, they could and some do choose to switch to a commercial system. Others try commercial, switch back to DIY, and switch back and forth over time for various reasons. It’s not a single or permanent decision to DIY!

The key point is: DIY AID provides safety and efficacy *and* user choice for people with diabetes.

Dr. Forlenza followed my presentation, talking about commercial AID systems and how they’ve moved through development more quickly recently. He points to the RCTs for each approved commercial system that exist, saying commercial AID systems work, and describing different feature sets and variety across commercial systems. He shared his thoughts on advantages of commercial systems including integration between components by the companies; regulatory approval meaning these systems can be prescribed by healthcare providers; company-provided warranties; and company provided training and support of healthcare providers and patients.

He makes a big point about a perceived reporting bias in social media, which is a valid point, and talks about people who cherry pick (my words) data to share online about their TIR.

He puts an observational study and the CREATE Trial RCT data up next to the commercial AID systems RCT data, showing how the second generation commercial AID reach similar TIR outcomes.

He then says “what are you #notwaiting for?”, pointing out in the US that there are 4 commercial systems FDA approved for type 1 diabetes. He says “Data from the DIY trials themselves demonstrate that DIY users, even with extreme selection bias, do not achieve better glycemic control than is seen with commercial systems.” He concludes that commercial AID has a wide variety of options; commercial systems achieve target-level outcomes; a perception that both glucose outcomes and QOL are being addressed by the commercial market, and that “we do not need Unapproved DIY solutions in this space”.

After Dr. Forlenza’s presentation, I began my rebuttal, starting with pointing out that he is incorrectly conflating perceived biases/self-reporting of social media posts with gold-standard, rigorously performed scientific trials evaluating DIY. Data from DIY AID trials do not suffer from ‘selection bias’ any more than commercial AID trials do. (In fact, all clinical trials have their own aspects of selection bias, although that isn’t the point here.) I reminded the audience of the not one but multiple RCTs available as well as dozens of other prospective and retrospective clinical trials. Plus, we have 82,000+ data points analyzed showing above-goal outcomes, and many studies that evaluate this data and adjust for starting outcomes still show that people with diabetes who use DIY AID benefit from doing so, regardless of their starting A1c/TIR or demographics. This isn’t cherry-picked social media anecdata.

When studies are done rigorously, as they have been done in DIY, we agree that now second-generation commercial AID systems reach (or exceed, depending on the system) ADA standard of care outcomes. For example, Dr. Forlenza cited the OP5 study with 73.9% TIR which is similar to the CREATE Trial 74.5% TIR.

My point is not that commercial systems don’t work; my point is that DIY systems *do* work and that the fact that commercial systems work doesn’t then override the fact that DIY systems have been shown to work, also! It’s a “yes, and”! Yes, commercial AID systems work; and yes, DIY AID systems work.

The bigger point, which Dr. Forlenza does not address, is that the person with diabetes should get to CHOOSE what is best for them, which is not ONLY about glucose outcomes. Yes, a commercial system- like DIY AID – may help someone get to goal TIR (or above goal), but DIY provides more choice in terms of the input behaviors required to achieve those outcomes! There’s also possible choice of systems with different pumps or CGMs, different (often lower) cost, increased data access and interoperability of data displays, different mobile device options, and more.

Also, supporting user choice of DIY is in fact A STANDARD OF CARE!

It’s in the ADA’s Standards of Care, in fact, as I wrote about here when observing that it’s in the 2023 Standards of Care…as well as in 2022, 2021, 2020, and 2019!

I wouldn’t be surprised if there are people attending the debate who think they don’t have any – or many – patients using DIY AID. For those who think that (or are reading this thinking the same), I ask a question: how many patients have you asked if they are using DIY AID?

There’s a bunch of reasons why it may not come up, if you haven’t asked:

  • They may use the same consumables (sites, reservoirs) with a different or previous pump in a DIY AID system.
  • Their prescribed pump (particularly in Europe and non-US places that have Bluetooth-enabled pumps) may be usable in a DIY AID.
  • They may not be getting their supplies through insurance, so their prescription doesn’t match what they are currently using.
  • Or, they have more urgent priorities to discuss at appointments, so it doesn’t come up.
  • Or, it’s also possible that it hasn’t come up because they don’t need any assistance or support from their healthcare provider.

Speaking of learning and support, it’s worth noting that in DIY AID, because it is open source and the documentation is freely available, users typically begin learning more about the system prior to initiating their start of closed loop (automated insulin delivery). As a result, the process of understanding and developing trust in the system begins prior to closed loop start as well. In contrast, much of the time there is limited available education prior to receiving the prescription for a commercial AID; it often aligns more closely with the timeline of starting the device. Additionally, because it is a “black box” with fewer available details about exactly how it works (and why), the process of developing trust can be a slower process that occurs only after a user begins to use a commercial device.

With DIY AID, because it is open source and the documentation is freely available, users typically begin learning more about the system prior to initiating their start of closed loop (automated insulin delivery). As a result, the process of understanding and developing trust in the system begins prior to closed loop start as well. In contrast, much of the time there is limited available education prior to receiving the prescription for a commercial AID; it often aligns more closely with the timeline of starting the device. Additionally, because it is a black box with less available details about exactly how it works (and why), the process of developing trust can be a slower process that occurs only after a user begins to use a commercial device. The learning & trust in AID timelines is something that needs more attention in commercial AID moving forward.

I closed my rebuttal section by asking a few questions out loud:

I wonder how healthcare providers feel when patients learn something before they do – which is often what happens with DIY AID. Does it make you uncomfortable, excited, curious, or some other feeling? Why?

I encouraged healthcare providers to consider when they are comfortable with off-label prescriptions (or recommending things that aren’t approved, such as Vitamin D), and reflect on how that differs from understanding patients’ choices to DIY.

I also prompted everyone to consider whether they’ve actually evaluated (all of) the safety and efficacy data, of which many studies exist. And to consider who benefits from each type of system, not only commercial/DIY but individual systems within those buckets. And to consider who gets offered/prescribed AID systems (of any sort) and whether subconscious biases around tech literacy, previous glucose outcomes, and other factors (race, gender, other demographic variables) result in particular groups of people being excluded from accessing AID. I also remind everyone to think about what financial incentives influence access and available of AID education, and where the education comes from.

Although Dr. Forlenza’s  rebuttal followed mine, I’ll summarize it here before finishing a recap of my rebuttal: he talks about individual selection bias/cherry picked data, acknowledging it can occur in anecdotes with commercial systems as well; talks about the distinction of regulatory approval vs. off label and unapproved; legal concerns for healthcare providers; and closes pointing out that many PWD see primary care providers, he doesn’t believe it is reasonable to expect PCPs to become familiar with DIY since there are no paid device representatives to support their learning, and that growth of AID requires industry support.

People probably wanted to walk out of this debate with a black and white, clear answer on what is the ‘right’ type of AID system: DIY or commercial. The answer to that question isn’t straightforward, because it depends.

It depends on whether a system is even AVAILABLE. Not all countries have regulatory-approved systems available, meaning commercial AID is not available everywhere. Some places and people are also limited by ACCESSIBILITY, because their healthcare providers won’t prescribe an AID system to them; or insurance won’t cover it. AFFORDABILITY, even with insurance coverage, also plays a role: commercial AID systems (and even pump and CGM components without AID) are expensive and not everyone can afford them. Finally, ADAPTABILITY matters for some people, and not all systems work well for everyone.

When these factors align – they are available, accessible, affordable, and adaptable – that means for some people in some places in some situations, there are commercial systems that meet those needs. But for other people in other places in other situations, DIY systems instead or also can meet that need.

The point is, though, that we need a bigger overlap of these criteria! We need MORE AID systems to be available, accessible, affordable, and adaptable. Those can either be commercial or DIY AID systems.

The point that Dr. Forlenza and I readily agree on is that we need MORE AID – not less.

This is why I support user choice for people with diabetes and for people who want – for any variety of reasons – to use a DIY system to be able to do so.

People probably want a black and white, clear answer on what is the ‘right’ type of AID system: DIY or commercial. It depends on whether a system is even AVAILABLE. Not all countries have regulatory-approved systems available, meaning commercial AID is not available everywhere. Some places and people are also limited by ACCESSIBILITY, because their healthcare providers won’t prescribe an AID system to them; or insurance won’t cover it. AFFORDABILITY, even if insurance coverage, also plays a role: commercial AID systems (and even pump and CGM components without AID) are expensive and not everyone can afford them. Finally, ADAPTABILITY matters for some people, and not all systems work well for everyone. The point is that we need a bigger overlap of these criteria! We need more alignment of these factors - more AID (DIY and commercial) available, accessible, affordable, and adaptable for people with diabetes. I support user choice for people with diabetes, which includes DIY AID systems

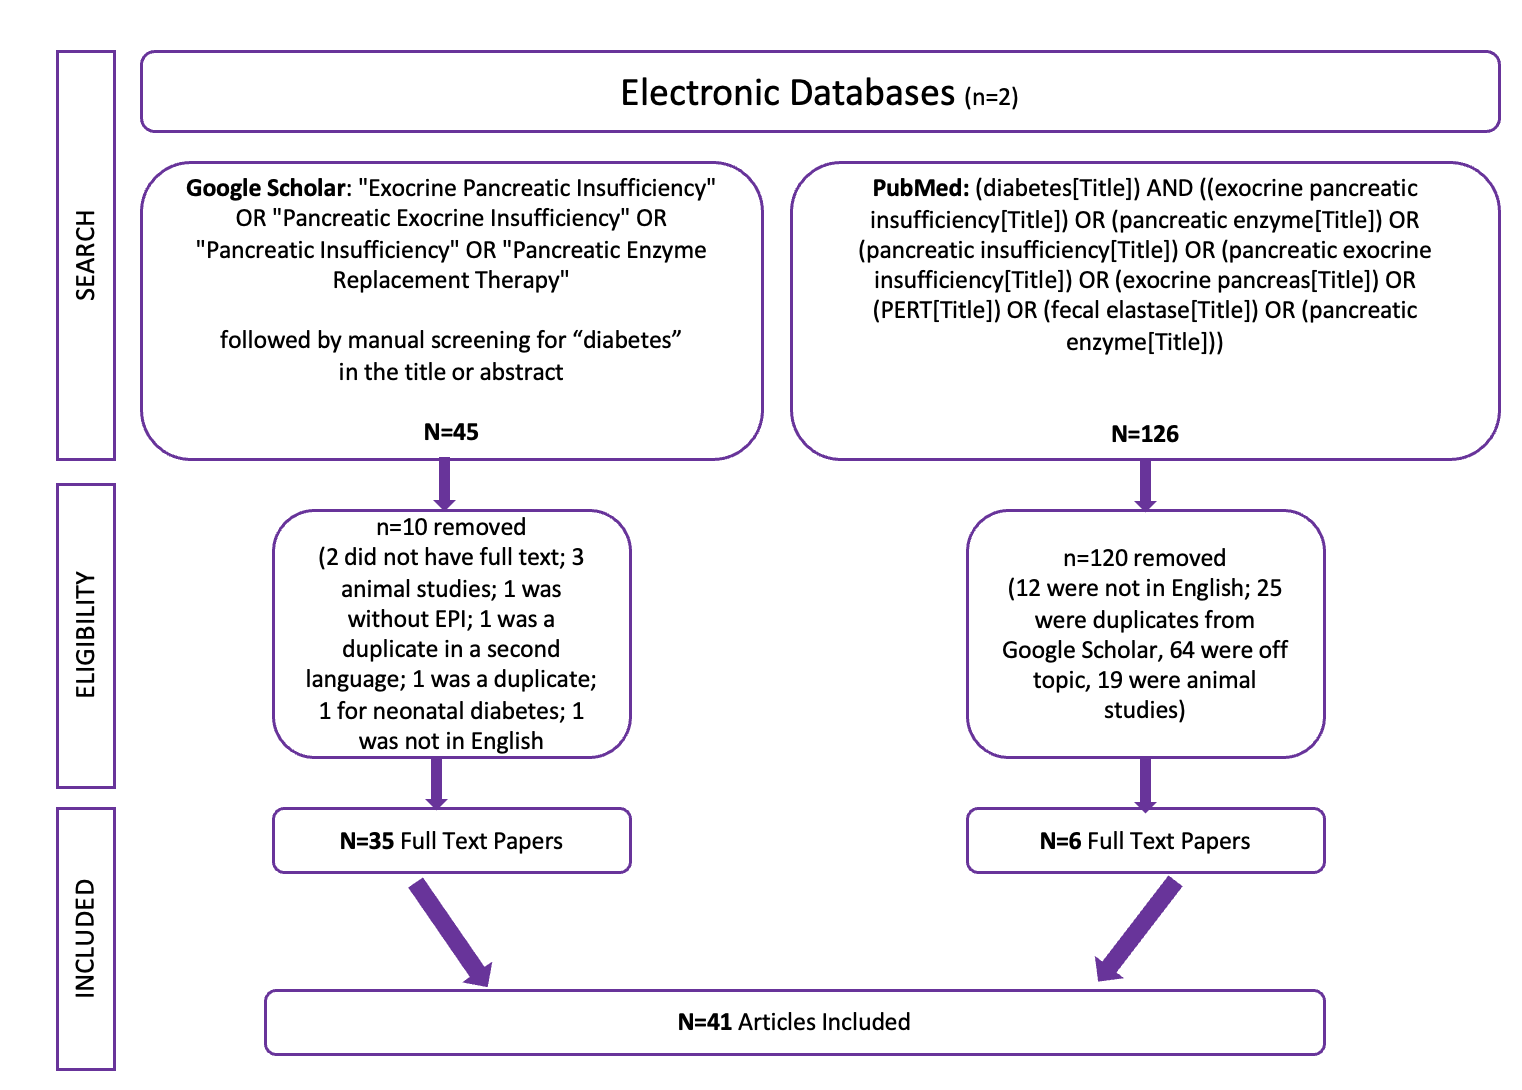
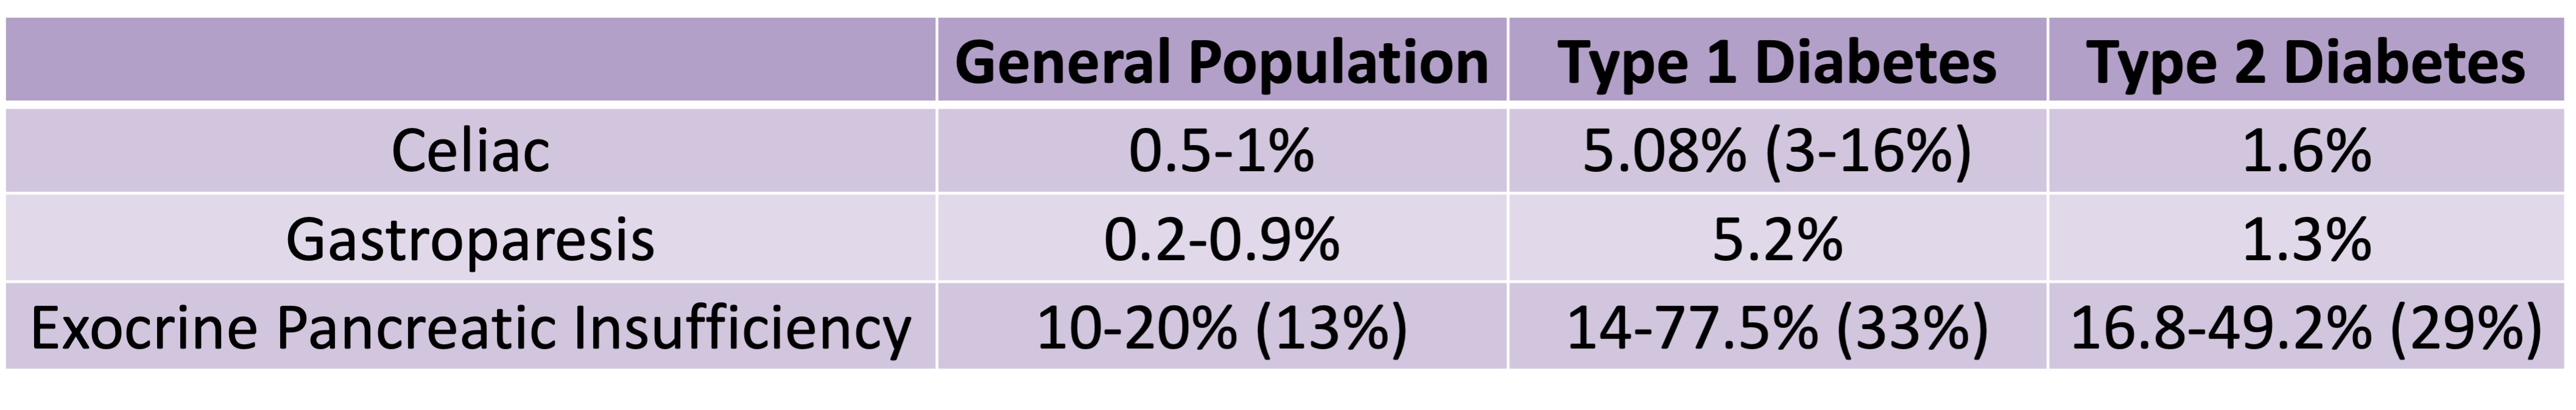
PS – I also presented a poster at #ADA2023 about the high prevalence rates of exocrine pancreatic insufficiency (EPI / PEI / PI) in Type 1 and Type 2 diabetes – you can find the poster and a summary of it here.

Exocrine Pancreatic Insufficiency (EPI/PEI) In Type 1 and Type 2 Diabetes – Poster at #ADA2023

When I was invited to contribute to a debate on AID at #ADA2023 (read my debate recap here), I decided to also submit an abstract related to some of my recent work in researching and understanding the prevalence and treatment of exocrine pancreatic insufficiency (known as EPI or PEI or PI) in people with diabetes.

I have a personal interest in this topic, for those who aren’t aware – I was diagnosed with EPI last year (read more about my experience here) and now take pancreatic enzyme replacement therapy (PERT) pills with everything that I eat.

I was surprised that it took personal advocacy to get a diagnosis, and despite having 2+ known risk factors for EPI (diabetes, celiac disease), that when I presented to a gastroenterologist with GI symptoms, EPI never came up as a possibility. I looked deeper into the research to try to understand what the correlation was in diabetes and EPI and perhaps understand why awareness is low compared to gastroparesis and celiac.

Here’s what I found, and what my poster (and a forthcoming full publication in a peer-reviewed journal!) is about (you can view my poster as a PDF here):

1304-P at #ADA2023, “Exocrine Pancreatic Insufficiency (EPI / PEI)  Likely Overlooked in Diabetes as Common Cause of Gastrointestinal-Related Symptoms”

Exocrine Pancreatic Insufficiency (EPI / PEI / PI) occurs when the pancreas no longer makes enough enzymes to support digestion, and is treated with pancreatic enzyme replacement therapy (PERT). Awareness among diabetes care providers of EPI does not seem to match the likely rates of prevalence and contributes to underscreening, underdiagnosis, and undertreatment of EPI among people with diabetes.

Methods:

I performed a broader systematic review on EPI, classifying all articles based on co-condition. I then did a second specific diabetes-specific EPI search, and de-duplicated and combined the results. (See PRISMA figure).

A PRISMA diagram showing that I performed two separate literature searches - one broadly on EPI before classifying and filtering for diabetes, and one just on EPI and diabetes. After filtering out irrelevant, animal, and off topic papers, I ended up with 41

I ended up with 41 articles specifically about EPI and diabetes, and screened them for diabetes type, prevalence rates (by type of diabetes, if it was segmented), and whether there were any analyses related to glycemic outcomes. I also performed an additional literature review on gastrointestinal conditions in diabetes.

Results:

From the broader systematic review on EPI in general, I found 9.6% of the articles on specific co-conditions to be about diabetes. Most of the articles on diabetes and EPI are simply about prevalence and/or diagnostic methods. Very few (4/41) specified any glycemic metrics or outcomes for people with diabetes and EPI. Only one recent paper (disclosure – I’m a co-author, and you can see the full paper here) evaluated glycemic variability and glycemic outcomes before and after PERT using CGM.

There is a LOT of work to be done in the future to do studies with properly recording type of diabetes; using CGM and modern insulin delivery therapies; and evaluating glycemic outcomes and variabilities to actually understand the impact of PERT on glucose levels in people with diabetes.

In terms of other gastrointestinal conditions, healthcare providers typically perceive the prevalence of celiac disease and gastroparesis to be high in people with diabetes. Reviewing the data, I found that celiac has around ~5% prevalence (range 3-16%) in people with type 1 diabetes and ~1.6% prevalence in Type 2 diabetes, in contrast to the general population prevalence of 0.5-1%. For gastroparesis, the rates in Type 1 diabetes were around ~5% and in Type 2 diabetes around 1.3%, in contrast to the general population prevalence of 0.2-0.9%.

Speaking of contrasts, let’s compare this to the prevalence of EPI in Type 1 and Type 2 diabetes.

  • The prevalence of EPI in Type 1 diabetes in the studies I reviewed had a median of 33% (range 14-77.5%).
  • The prevalence of EPI in Type 2 diabetes in the studies I reviewed had a median of 29% (16.8-49.2%).

You can see this relative prevalence difference in this chart I used on my poster:

The prevalence of EPI is much higher in T1 and T2 than the prevalence of celiac and gastroparesis.

Key Findings and Takeaways:

Gastroparesis and celiac are often top of mind for diabetes care providers, yet EPI may be up to 10 times more common among people with diabetes! EPI is likely significantly underdiagnosed in people with diabetes.

Healthcare providers who see people with diabetes should increase the screening of fecal elastase (FE-1/FEL-1) for people with diabetes who mention gastrointestinal symptoms.

With FE-1 testing, results <=200 μg/g are indicative of EPI and people with diabetes should be prescribed PERT. The quality-of-life burden and long-term clinical implications of undiagnosed EPI are significant enough, and the risks are low enough (aside from cost) that PERT should be initiated more frequently for people with diabetes who present with EPI-related symptoms.

EPI symptoms aren’t just diarrhea and/or weight loss: they can include painful bloating, excessive gas, changed stools (“messy”, “oily”, “sticking to the toilet bowl”), or increased bowel movements. People with diabetes may subconsciously adjust their food choices in response to symptoms for years prior to diagnosis.

Many people with diabetes and existing EPI diagnoses may be undertreated, even years after diagnosis. Diabetes providers should periodically discuss PERT dosing and encourage self-adjustment of dosing (similar to insulin, matching food intake) for people with diabetes and EPI who have ongoing GI symptoms. This also means aiding in updating prescriptions as needed. (PERT has been studied and found to be safe and effective for people with diabetes.)

Non-optimal PERT dosing may result in seemingly unpredictable post-meal glucose outcomes. Non-optimal postprandial glycemic excursions may be a ‘symptom’ of EPI because poor digestion of fat/protein may mean carbs are digested more quickly even in a ’mixed meal’ and result in larger post-meal glucose spikes.

As I mentioned, I have a full publication with this systematic review undergoing peer review and I’ll share it once it’s published. In the meantime, if you’re looking for more personal experiences about living with EPI, check out DIYPS.org/EPI, and also for people with EPI looking to improve their dosing with pancreatic enzyme replacement therapy – you may want to check out PERT Pilot (a free iOS app to record enzyme dosing).

Researchers, if you’re interested in collaborating on studies in EPI (in diabetes, or more broadly on EPI), please reach out! My email is Dana@OpenAPS.org

Air Quality, CO2 monitoring, and Situational Masking

I do a lot of things most people don’t want to do themselves – and I get that. (For example, recording macronutrients while running? Running for up to 16 or 25 hours? Let alone other choices like building DIY and making open source automated insulin delivery systems not only for myself but more widely available for other people.) I’ve also talked before about functional self-tracking and how I don’t track things for the sake of tracking, I track when the data/information is actionable either retrospectively or in real-time.

I’ve spent enough time now collecting real-time data on air quality (via a proxy of CO2 levels) that I think it would be useful to share for other people to consider the retrospective data for THEIR decision making.

You may not want (or be able to afford) a CO2 monitor, and you may not want to mask inside all the time, but the below outlines the general scenarios in which air quality tends to be better or worse and when you would get the most benefit from situational masking in response to those situations.

(Think about situational masking indoors like you think about situational masking for smoke and poor air quality outside. Most of the time, you likely don’t mask outside. But if you’re on the east coast right now or have lived through a previous west coast US summer with a “smoke season”, you’ve probably experienced multi-day air quality outside that was so poor that you considered or did wear a high-quality (N95/K95) mask outside or limit your time exposed to that outdoor air.)

Air quality assessment via CO2 monitoring

In the last few years, Scott and I acquired two different CO2 monitors. The first was cheap, required to be plugged into a battery pack to run it, and was simply viewable on the device display. It was useful to start to get a sense for what the CO2 levels were in indoor spaces as compared to outdoor air.

Later, we decided to invest in an Aranet CO2 monitor, which runs on two AA batteries and lasts months on a single pair of batteries. You can view the data on the device display AND see a retrospective and realtime graph of the data in your phone, because it connects via Bluetooth. You can see not only CO2 but also temperature, humidity, and air pressure.

We have found this useful because CO2 is something that we all produce when we breathe out. The more we breathe out, and the more people that are breathing out, the higher the CO2 levels. The more of that air that is replaced with low-CO2 outside air, the lower the CO2 levels. Measuring the CO2 then helps us understand the ventilation (how much air is flowing through the space and how often it is being cleared out) and the risks of being in that space. A higher CO2 level means more people and/or less air being cleared out of the space, meaning  you are more likely to be breathing in what someone else is breathing out.

How we evaluate CO2 levels

An outdoor CO2 level would be around ~450 ppm in urban areas, or as low as 400 ppm out in nature. Since a perfectly-ventilated space would be 100% outside air, we want to compare any indoor air CO2 reading to outdoor air.

For example, at home in our enclosed apartment with 2 people (and 2 cats), we typically run around 700 ppm, which means ~250 ppm above outdoor air levels. When we open our door or a window, it drops to ~500 ppm, or only ~50 ppm above outdoor air levels. Given that we have confirmed our air intake into our HVAC system for our apartment is outdoor air, this means the ~250 ppm we are sharing between the two of us is just our (and the cats) exhalations, rather than anyone outside our household. So those levels are acceptable to us, but our choice of interventions would change if we were sharing air with other people, especially random strangers. (Stranger danger is one way to think about air, further contextualized below with data.)

In a shared space with random strangers, your risk of COVID aerosol-based transmission is proportional to how elevated the CO2 level is above that of outside air, and the amount of time spent in that space. So a CO2 reading of 650 ppm, which is ~200 ppm over outside air, would be half as risky as a reading of 850 ppm, or ~400 ppm over outside air. And timing matters, so a 1 hour bus ride or the hour you spend boarding and waiting for takeoff on your plane when CO2 levels are highest and the air filtration (see below) is off will be of greater risk than short exposure to the same levels.

Now, we’ve also used our CO2 monitors in many other places, such as in airports and on planes and other public transportation, and other indoor shared spaces like grocery stores etc.

Here’s what we’ve learned about where CO2 levels trend (based on our repeated but n=1 testing).

Trains, buses, and rideshare (e.g. Uber, Lyft, etc) = BAD NEWS BEAR AIR

Public transportation, in every location and every country we have been in, has much higher CO2 levels.

What do I mean by much higher? Often 1000-1500 ppm easily (and sometimes >2000 ppm), which is anywhere from 500-1500 ppm above outdoor air quality.

Trains/metros/light rail where the doors are constantly opening and closing to outdoor air would seem like they would be better, but sometimes they still have (due to the density of riders) >1500 ppm.

Buses where you can’t open the window can be as high of CO2 levels as planes, without the benefit of air exchange or HEPA filtration of the air. Our recent 20 minute bus ride was up to >2500 ppm on a full bus.

Watch out for rideshares, too. Often times we get in a rideshare and the driver intentionally or accidentally has “recirc” or “recirculating air” on, meaning the air isn’t exchanged outside and the driver and riders are re-breathing each other’s air over and over and over and over again..yikes. Specifically looking at the console when you get in the car is useful: if you see the recirc button lit up, ask the driver to turn it off. If they don’t understand or refuse, or you don’t want to try to explain it, opening a window helps immensely to reduce the CO2 levels and the amount of re-breathing air. (The recirc icon usually looks like a car with a U-shaped arrow on it).

Planes (including airports, during boarding, in flight, and during landing/deplaning) = ALSO BAD NEWS BEAR AIR

Airports sometimes have better-ventilated spaces: you can often find less crowded corners of a terminal and see CO2 readings of <900 ppm. However, it’s still pretty common to be in the airport and see >1000 ppm, meaning that the CO2 is >500 ppm above outdoor air quality, and it is air from a whole assortment of random strangers coming and going, so it’s less safe than the air you’d be breathing in at home or in private spaces.

When boarding, both standing close in line with other people but also on the jet bridge and while you are on the plane, is usually even HIGHER CO2 levels than the airport. The typical air for a plane (that they tout with HEPA filters and high air exchange rates) is not turned on until you start to take off, and then it takes some time to exchange all of the air. This means there is a MUCH higher rate of re-breathing other people’s air while boarding and until you are in the air.

Now, we have measured CO2 levels during all of these times. If indoor airport air is around 900 ppm, it usually jumps to 1100-1300 on the jetbridge (if you’ve got a backed up line) and when you’re sitting on the plane watching other people board, it can go up to 2500+. And then it continues to go up as you have a full flight of people breathing in this enclosed space. During flight, we’ve seen CO2 levels hover between 1700-3000 ppm, and in some cases have gone up to ~4000 ppm. This is a lot of CO2! However, there are HEPA filters cleaning the ~half of the air that is recirculated instead of replaced. So, it’s harder to say when the airplane air systems ARE running (during most of the flight) whether the risk is as high (for infectious disease transmission) as it is in other environments that aren’t studiously exchanging and HEPA-filtering any recirculated air.

Note that when they spin down the engines after landing and all the way through taxiing, deplaning, and getting back into the airport – the CO2 level again tends to rise because they again change the air flow when they’re on the ground. So like standing in line to get on or waiting for other people to board, standing in line to get off/waiting for everyone to get off produces high CO2 levels *without the benefit of in-flight air exchange*, so it’s likely higher risk during those times than in the air during the middle of the flight, even if CO2 levels are equally high during flight.

Indoor spaces like grocery stores or conference rooms/meeting halls

Indoor spaces can vary quite a bit, and often by country or venue.

For example, most indoor spaces in the US we’ve found to often have a fairly high (e.g. 900+ ppm) indoor CO2 level, even without a huge density of people. For example, we quickly went into a grocery store the other day and the CO2 was high-800s without being around many people in the aisles, across the entire store. For not having people actively occupying the space, this is fairly high and less optimal.

In contrast, we recently were in Sweden for a conference and were honestly gobsmacked when we got off the plane and found the CO2 levels to be <600 ppm in the airport! And in the hotel lobby! And in the hotel elevator! And at the local grocery store!

(Seriously, it shocked us, because we’ve also recently been in the UK with our CO2 monitor and found US-like CO2 levels typically around 900-1000 ppm or higher, and also in Spain last year where we similarly found it to be >900 ppm even when not densely occupied. The exception to optimal air quality in Sweden was our ~20 minute bus ride where CO2 levels were >2500 ppm).

So, the CO2 levels may vary quite a bit and this is why measuring is helpful. Because you can’t assume that one country/one room means that all of the rooms in that country or even that venue will be the same.

Case in point? Conference rooms/halls or meeting rooms.

In Barcelona, Spain in April 2022, I spoke at a conference. The CO2 levels in the hallways and in the meeting room before the session started were around 800-900 ppm when not occupied. Again, a little high for not having people actively in the spaces. Then, when the conference started, Scott watched the CO2 monitor and saw it rise..and rise…and rise. Within 45 minutes, the CO2 levels were around 2000 ppm (>1500 ppm over outdoor air quality)! He went to the back of the room and opened the doors to try to get some air circulating in the room, although it didn’t make a big difference. That room did not have a high number of air exchanges per hour and was not successfully clearing out the air people were breathing out.

In Sweden (May 2023, where the CO2 was <600 in a lot of public indoor spaces), we found the same challenge in a high ceiling, large meeting hall. With 300 people, the start of the session had about 950 ppm (as opposed to the <600 ppm of less occupied hallways). Not too bad given 300 people in the space. However, by the end of the session, the CO2 level had risen to ~1350! And it continued to rise even as people had exited the room; we didn’t see a drop in CO2 levels until we went out in the hallway to continue talking to people, and it took another ~25 minutes before CO2 levels in the hallway were back down <600 ppm.

Again, we were surprised, because this venue (the hallways, lobby, elevator, etc) all had really great otherwise indoor air quality with CO2 <600 ppm!

But the challenge is the space (and the infrastructure for filtration and air exchanges); the number of people filling the space; and the amount of time, in terms of what happens to the CO2 levels.

The takeaway from this? Conference halls, meeting rooms, and anywhere where you are sitting with a group of people over a period of time is going to have a much higher CO2 level and it will increase in proportion to the time that you are occupying that space (e.g. a 30 minute or 1 hour session is going to have a much higher CO2 buildup than a 10 minute talk where the audience is turning over and leaving the room and it clears out some before the next session).

So what should you do about this information? Consider situational masking.

I really have found a CO2 monitor helpful, because even my best guesses about air quality (e.g. thinking Sweden’s conference hall would have good air quality given the size of the room and ceilings) aren’t always accurate. But if you don’t want to invest in a CO2 monitor, here’s where you can get the biggest bang for your buck with situational masking.

What do I mean by situational masking? Maybe you don’t think you’re at very high risk for COVID or other infectious illnesses, but you are interested in reducing the likelihood that you spread anything you get to other people (thanks!). But you don’t want to have to think about it, and maybe you’ve chosen previously to drop masking so you don’t have to think about it. Here’s a set of easy rules/situations in which, like learning to dump your liquids out before going through airport security, you can get into a habit of doing and not have to think about it much.

  • Public/shared transportation.

    Riding a bus, train, metro, or a car with a stranger and especially with multiple strangers – these have high CO2 levels.

  • Airports, boarding a plane and during takeoff, and during descent/landing/deboarding the plane.

    This is when the CO2 levels are highest and the air exchanges/HEPA filtration is not running.

    Think of it like the seatbelt sign. You board the plane and put your seatbelt on, then eventually once you’ve reached cruising altitude the seatbelt sign goes off. If you’re standing in a line of people (to board or deplane) OR if the seatbelt sign is ON, that’s a huge ROI for wearing a high-quality (N95 or KN95) mask. When the seatbelt sign first turns off during the flight (or you hear the 10k-feet chime) and you want to take and leave it off, or take it off a while to eat or drink – that’s less risky during those times due to the HEPA filtration and air exchanges during flight. But when the seatbelt sign goes on for the plane’s final descent? The air quality is going down, too, so putting your seatbelt AND your mask back on is a higher ROI thing to do.

    (You do you inside the airport, too, but see below about density of people and temperature as a guide for whether you might want to consider situational masking in airports when you’re not eating/drinking.)


  • Conferences or meetings where you are sitting for more than a few minutes and there are many people in the room.

    Even with super big rooms and super high ceilings, so far every conference space I’ve presented in during the last several years has high CO2 levels even before the talk starts, and is even higher (>500-1000 ppm added) by the end of the session). If you’re not presenting or eating and drinking and are just sitting there listening and engaging in the session…it’s a low hassle opportunity to pop a high-quality mask on so you’re not breathing so much of the air around you from everyone else. When you’re done with the session and head out and want to socialize? Like leaving the plane, you’ll be around fewer people, and the CO2 levels (and risk) goes down. But sitting there quietly is a great time to wear a good mask and reduce your intake of other people’s exhalations.


You might find yourself in situations where the room feels hot and stuffy, or in the case of conferences and meetings, the air feels FREEZING cold. It runs freezing cold because the room gets hot and stuffy with so many people, indicating this space is not well ventilated, so they pump the AC to change the temperature. But that is a compensation for a too-low rate of air exchanges, and pre-cooling doesn’t prevent CO2 and aerosol buildup, so a room that either gets freezing cold or hot and stuffy should be a signal that the air quality likely isn’t ideal.

So a good rule of thumb is, if you’re in a space that feels hot and stuffy OR freezing cold, that’s an indicator that the air quality might be non-optimal. Consider masking in those situations even if you don’t have a CO2 monitor to evaluate the air.

It would be great if we could get 10x people to consider situational masking like this. Avoid the worst of the bad-news-bear-air of public and shared transportation and indoor spaces, which would cut down on a lot of transmission, even if people otherwise are still socializing and eating in indoor spaces and doing whatever it is they want to do. The choice to situationally mask might occasionally protect them but would also protect everyone around them in those situations when their exhalations have the greatest risk of doing the most damage.

A good way to think about it is at a conference. You might be willing to go to bars and socialize, but someone who is higher risk may be choosing not to attend those indoor dining scenarios. That’s fine: you each get to make your own choices! But when you go and sit down next to that person in a conference session, your choices then influence that person by every breath you take in that conference session.

That’s why situational masking – knowing that a situation is low-hassle to wear a high-quality mask (sitting quietly in a session) but high-risk (due to the poor air quality) means you have a high ROI to pull a mask out of your pocket/bag and throw it on – can help the people around you very effectively with little hassle and thought on your part.

You can get in the habit of masking in the bad-news-bear-air situations/locations, and you don’t have to think much about it. You’ll make things a bit safer for yourself and for the people around you, for far less hassle than avoiding buying a drink before you go through airport security because you know you need to dump liquids out.

Data-driven situational masking based on indoor air quality

How To Talk To Your Doctor About Your Enzyme (PERT) Dosing If You Have Exocrine Pancreatic Insufficiency (EPI or PEI or PI)

In exocrine pancreatic insufficiency (EPI/PEI/PI), people are responsible for self-dosing their medication every time they eat something.

Doctors prescribe a starting dose, but a person with EPI determines each and every time they eat or drink something how many enzyme pills (of pancreatic enzyme replacement therapy, known as PERT) to take. Doctors often prescribe a low starting dose, and people have to try experimenting with multiple pills of the small size, and eventually work with their doctors to change their prescription to get a bigger pill size (so they can take fewer pills per meal) and the correct number of pills per day to match their needs.

For example, often people are prescribed one 10,000 unit pill per meal. The 10,000 units represents the amount of lipase (to help digest fat). There are also two other enzymes (protease, for protein digestion, and amylase, for carbohydrate digestion). They may be prescribed 1 pill per meal, which means 10,000 units of lipase per meal. But most dosing guidelines recommend starting at a dose of 40,000-50,000 units of lipase per meal (and people often need more), so it wouldn’t be surprising that someone prescribed one 10,000 pill per meal would need 4-5 pills of the 10,000 size pill PER MEAL, and times three meals per day (let alone any snacks), to get acceptable GI outcomes.

Mathematically, this means the initial prescription wouldn’t last long. The initial prescription for 1 pill per meal, with 3 meals a day, means 3 pills per day. 3 pills per day across a 30 day month is 90 pills. But when the pills per meal increase, that means the prescription won’t cover the entire month.

In fact, it would last a lot less than a month; closer to one week!

Showing that based on the number of pills and 3 meals per day, an intitial RX of 10,000 size pills may last more like a week rather than a full 30 days when the doctor is unaware of prescribing guidlines that typically suggest 40,000-50,000 per meal is needed as the starting meal dose.

Let’s repeat: with a too-small prescription pill size (e.g. 10,000 starting dose size) and count (e.g. 3 pills per day to cover 1 per meal) and with a person with EPI titrating themselves up to the starting dose guidelines in all of the medical literature, they would run out of their prescription WITHIN ONE WEEK. 

So. If you have EPI, you need to be prepared to adjust your dosing yourself; but you also need to be ready to reach out to your doctor and talk about your need for more enzymes and a changed prescription.

PERT (enzymes) come in different sizes, so one option is to ask for a bigger pill size and/or a different amount (count) per meal/day. Depending on the brand and the number of pills you need per meal, it could be simply going up to a bigger pill size. For example, if you need 3 pills of the 10,000 PERT size, you could move to a 36,000 pill size and take one per meal. If you find yourself taking 5 pills of the 10,000 PERT size, that might mean 2 pills of the 25,000 size. (Brands differ slightly, e.g. one might be 24,000 instead of 25,000, so the math may work out slightly differently depending on which brand you’re taking.)

Don’t be surprised if you need to do this within a week or two of starting PERT. In fact, based on the math above, especially if you’re on a much lower dose than starting guidelines (e.g. 40,000-50,000 units of lipase per meal), you should expect within a few days to need an updated prescription to make sure that you don’t run out of PERT.

If you do find yourself running out of PERT before you can get your prescription updated, there is an alternative you can consider: either substituting or adding on over the counter enzymes. The downsides include the fact that insurance doesn’t cover them so you would be paying out of pocket; plus there are no studies with these so you can’t (shouldn’t) rely on these as full 1:1 substitutes for prescription PERT without careful personal testing that you can do so. That being said, there is anecdotal evidence (from me, as well as hundreds of other people I’ve seen in community groups) that it is possible to use OTC enzymes if you can’t afford or can’t get a PERT prescription; or if you need to “top off”/supplement/add to your PERT because your prescription won’t last a full month and you can’t get a hold of your doctor or they won’t update your prescription.

For me, I generally evaluate the units of lipase (e.g. this kind is 17,000 units of lipase per pill) but then factor in for the lack of reliability for OTC and really treat it like it contains 13-15,000 units of lipase when choosing to take it. Similarly for another lipase-only OTC option (that has ~6,000 units per pill), I assume it acts like it only has ~5,000 units. Unlike insulin, there is little downside to taking a little too much of enzymes; but there is a LOT of downside to not taking enough, so my personal approach is that if in doubt, or on the fence, to round up (especially with OTC pills, which cost somewhere between $0.08/pill (lipase-only) to $0.34/pill (for the larger and multiple enzyme pill)).

So how do you talk to your doctor about needing more PERT?

It helps if you bring data and evidence to the conversation, especially if your doctor thinks by default that you don’t need more than what they initially prescribed. You can bring your personal data (more on that below and how to collect and present that), but you can also cite relevant medical literature to show if your dose is below standard starting guidelines.

Below I’ve shared a series of citations that show that the typical starting dose for people with EPI should be around 40,000-50,000 units of lipase per meal.

Important note that this is the STARTING DOSE SIZE, and most of these recommend further increasing of dose to 2-3 times this amount as needed. Depending on the starting dose size, you can see the chart I built below that illustrates with examples exactly how much this means one might need to increase to. Not everyone will need the upper end of the numbers, but if a doctor starts someone on 10,000 and doesn’t want to get them up to 40,000 (the lower end of starting doses) or go beyond 40,000 because it’s the starting dose, I’ve found this chart useful to show that numerically the range is a lot larger than we might assume.

Example of Titrating According to Common Dose Guidelines, Before Adding PPI

Examples of PERT starting doses of 25,000, 40,000, and 50,000 (plus half that for snacks) and what the dose would be if increased according to guidelines to 2x and 3x, plus the sum of the total daily dose needed at those levels.

Here are some citations that back up my point about 40,000-50,000 units of lipase being the typically recommended starting dose, including across different conditions (e.g. regardless of whether you have EPI + any of (chronic pancreatitis, diabetes, celiac, etc)).

  • Shandro et al, 2020, the median starting dose of 50,000 units per lipase “is an appropriate starting dose”, also citing UEG 2017 guidelines.
  • Forsmark et al, 2020, defined appropriate dose of PERT as >=120,000 units of lipase per day (e.g. 40,000 units of lipase per meal).
  • Whitcomb et al, 2022, in a joint American Gastroenterology Association and PancreasFest symposium paper, concur on 40,000 units as a starting dose and that “This dose should be titrated up as needed to reduce steatorrhea or gastrointestinal symptoms of maldigestion “
  • 2021 UK guidelines for EPI management suggest 50,000 units as the starting dose and emphasize that “all guidelines endorse dose escalation if the initial dose is not effective”

There are also many guidelines and research specific for EPI and different co-conditions supporting the ballpark of 40-50,000 units of lipase starting dose:

It is also worth noting that these guidelines also point out that after titrating 2-3x above the starting dose, PPI (proton pump inhibitors, to suppress acid) should be added if gastrointestinal symptoms are still not resolved. Anecdotally, it seems a lot of doctors are not aware that PPIs should be added if 3x the starting dose is not effective, so make sure to bring this up as well.

How to Share Your Personal PERT Data To Show How Much You Need

In addition to pointing out the guidelines (based on the above), it’s useful to share your data to show what you’ve been taking (dosing) and how it’s been working. I’ve written a lot about how you can do this manually, but I also recently created an iOS based app to make it easier to track what you’re eating, what you’re dosing in terms of PERT/enzymes, and what the outcome is. This app, PERT Pilot, is free to use, and it also enables you to visualize on a graph the relationship between what you’re eating and dosing.

PERT Pilot lets you track how many grams of fat each pill of your current prescription has been used for, so you can see with red and green coloring the relationship between meals that you’ve had symptoms after (in red) vs. when you recorded no symptoms (green). If you have a “convergence zone” of green and red in the same area, that may help you decide to change your ratio (e.g. dose more) around that amount, until you can comfortably and repeatedly get green results (no symptoms when you eat).

How you might use this to talk to your doctor

You can take a screenshot of your PERT Pilot graph and share it with your doctor to show them how many grams of fat your prescription size (e.g. pill size) effectively “covers” for you, and how many meals that you’ve tested it with.

Meals based on the ratio of fat:lipase and protein:protease mapped with color coded dots where green means no symptoms, orange means not sure if symptoms, and red means symptoms occurred and the dose likely didn't work at that ratio.
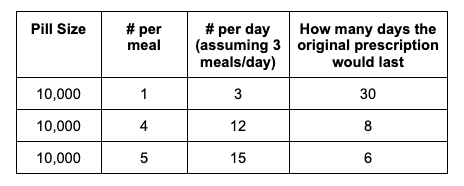
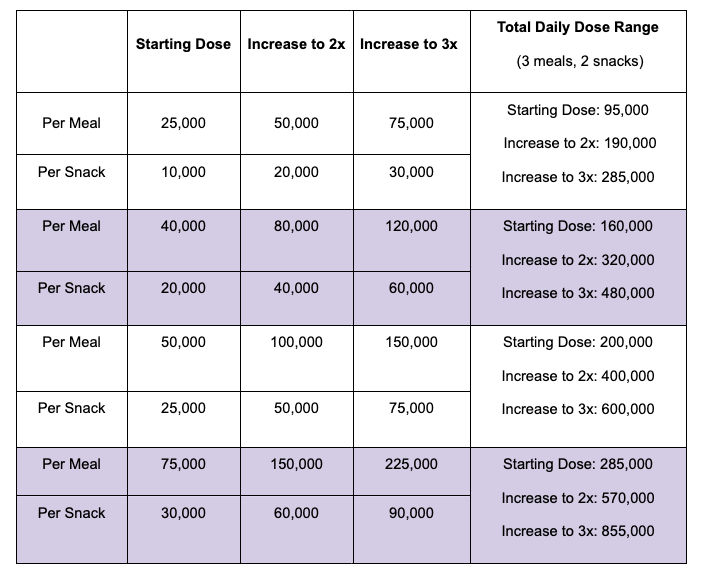
For example, I was initially prescribed an enzyme dose that was one pill per meal (and no snacks), so I had 3 pills per day. But I quickly found myself needing two pills per meal, based on what I was typically eating. I summarized my data to my doctor, saying that I found one pill typically covered up to ~30 grams of fat per meal, but most of my meals were >30 grams of fat, so that I wanted to update my prescription to have an average of 2 pills per meal of this prescription size. I also wanted to be able to eat snacks, so I asked for 2 pills per meal, 1 per snack, which meant that my prescription increased to 8 pills per day (of the same size), to cover 2 pills x 3 meals a day (=6) plus up to 2 snacks (=2). I also had weeks of data to show that my average meal was >30 grams of fat to confirm that I need more than the amount of lipase I was originally prescribed. My doctor was happy to increase my prescription as a result, and this is what I’ve been using successfully for over a year ever since.

So in summary, the data that would be useful to share is:

  • How much one pill ‘covers’ (which is where the PERT Pilot graph can be used)
  • How many pills per meal you’ve been taking and how big your meals typically are
  • Whether you are struggling with the number of pills per meal: if so, ask whether there’s a larger pill size in your current brand that you could increase to, in order to reduce the number of pills per meal (and/or snack) you need to take every time

If you are told that you shouldn’t need “that much”, remember the above section and have those resources ready to discuss that the starting dose is often 40,000-50,000 per meal and that the guidelines say to titrate up to 3x that before adding PPI. Therefore, it would be expected for some people to need upwards of 600,000 units of lipase per day (50,000 starting dose, increased 3x per meal and half of the dose used per snack). Depending on what people eat, this could be even higher (because not everyone eats the same size meal and snack and many of us adjust dose based on what we eat).

Also, it is worth noting that the dosing guidelines never mention the elastase levels or severity of EPI: so PERT prescriptions should not be based on whether you have “moderate” or “severe” EPI and what your elastase level is (e.g. whether it’s 45 or 102 or 146 or even 200, right on the line of EPI – all of those elastase levels would still get the same starting dose of PERT, based on the clinical guidelines for EPI).

It is common and you are not alone if you’ve not been giving the starting dose of PERT that the guidelines recommend.

There are numerous studies showing most people with EPI are initially underdosed/underprescribed PERT. For example, in 2020 Forsmark et al reported that only 8.5% of people with chronic pancreatitis and EPI received an adequate prescription for PERT: and only 5.5% of people with pancreatic cancer and EPI received an adequate prescription dose of PERT. Other studies in chronic pancreatitis and EPI from 2014, 2016, and 2020 report that undertreatment often occurs in EPI and CP; and I’ve found studies in other conditions as well showing undertreatment compared to guidelines, although it’s most studied in CP and cancer (which is true of all types of EPI-related research, despite the prevalence in many other conditions like diabetes, celiac, etc.).

You may need to advocate for yourself, but know that you’re not alone. Again, feel free to comment or email privately (Dana@OpenAPS.org) if you need help finding research for another co-condition and EPI that I haven’t mentioned here.

PS – if you haven’t seen it, I have other posts about EPI at DIYPS.org/EPI


You can also contribute to a research study and help us learn more about EPI/PEI – take this anonymous survey to share your experiences with EPI-related symptoms!