Instruments of freedom are devices, tools, hacks or things that help us do more than we could otherwise, and often do more with less pain or hassle or risk.
Instruments of freedom can be small everyday things, like noise cancelling headphones that help you focus or an effective rolling suitcase that’s easier to roll through the airport. They can be anything that reduces the energy cost of doing something, or increases your comfort or confidence, or expands your choices and flexibility and independence. Instruments of freedom are for everyone, but they can be especially meaningful for people with various health conditions, especially those of us impacted by physical limitations as a result of these health conditions.
I first considered the framework of instruments of freedom a few years ago. A few years ago, my mindset went from “I don’t need poles” for hiking to “I wonder if poles might be beneficial”. I tried them, and they were immensely helpful. I didn’t know if it was because my balance and proprioception has changed ever since I broke my ankle (and later a toe), or if I would have benefited from them all along. Nevertheless, they were highly impactful for helping me power up and more confidently come down hills. As my body changed for other reasons (a new autoimmune disease affecting my lungs and muscles), poles went from optional to the only way I would be able to hike at all. But as hiking has become even harder, I have kept my eyes open for additional instruments of freedom that might be helpful. Specifically, for over a year and a half I have been wanting to try a lower body exoskeleton, but could not find one that was commercially (and easily) available, light enough, and at a price point that I was willing to pay.
Until now.
I discovered one called “Hypershell”. There were 3 versions available (“Go”, “Pro”, and “Carbon”) at the time I was evaluating them, with different price points ($999, $1199, $1799) with different features and accessories.
Here’s what the features were at the time I was evaluating them:
| Hypershell Go X | Hypershell Pro X | Hypershell Carbon X | |
|---|---|---|---|
| Peak “Horsepower” output | 0.5 HP (400W peak) | 1 HP (800W peak) | 1 HP (800W peak) |
| Motion Postures Recognized | 6 | 10 | 10 |
| Weight of device | 2 kg | 2 kg | 1.8 kg |
| Battery range | ~15 km (9 miles) | ~17.5 km (10.5 miles) | ~17.5 km (10.5 miles) |
| Temperature rating of battery | IP54 & Anti-Cold Down to −10 °C |
IP54 & Anti-Cold Down to −20 °C |
IP54 & Anti-Cold Down to −20 °C |
| Number of batteries included | 1 | 2 | 2 |
(As I’m writing this in August 2025, note that they’re announcing a new “Ultra” model in September 2025 but it’s not clear yet what additional features or capabilities it will have.)
I wasn’t sure, though, if I would be able to use and benefit from the Hypershell. It’s hard to explain what my physical limitation is, but it results in me feeling like I can’t press off my ankle effectively (I wear ankle braces on both side) and there’s weakness in my thigh and hip, especially on the right side, that makes it hard to step up and over when going up the stairs and hiking. I can do it, but it’s exhausting, and it results in a weird sick-muscle type feeling after I do it a lot. I joined a Hypershell user group on Facebook and also the “Hypershell disability users” Facebook group. The second disability-based group kept cautioning that you needed to be able to lift up your foot 3-4 inches and take a step in order for the device to kick in. I was nervous about getting it and it not being able to work for me. But, there is a 2 week (14 day) return period, so I was hopeful that if it didn’t work I would be able to return it and get a refund. (But there were also not-so-great reviews of their customer service communication and the refund process, so I was nervous about that.)
I decided to get one and try it. I also specifically decided to choose the “Pro” model (see table above).
Why I chose a Hypershell Pro model instead of the Hypershell Go or Hypershell Carbon
The reasons I chose the “Pro”:
- $200 difference from the base model (Go), but with the 10 motion patterns. Given that I’m hopeful that I can do more types of activities like I used to, I wanted to be able to have as much capability as possible.
- More power output – the Go only has half as much peak power as the Pro/Carbon.
- More range (mileage, albeit slightly)
- Two batteries, including the better cold-resistant ones, on the Pro/Carbon instead of only 1 on the Go.
- …but I didn’t care about the .2kg weight difference, and that was really the only difference between the Pro and Carbon. That wasn’t worth $500 between the Pro and the Carbon.
(Update – December 2025 – are you curious about the latest version, the Hypershell X Ultra? I was able to try one: here is a separate post about my experiences with the Hypershell X Ultra and my comparison to the Hypershell X Pro, with my Pro experiences described below.)
Unboxing the Hypershell exoskeleton and getting set up
Before the Hypershell arrived, I went ahead and downloaded the app. It required an email address and a password, and it also asked about height and weight. It had a decent onboarding experience in the app with videos embedded to show you how to open and get started and how to size it. The height and weight was used to give you a starting setting for the waist. But then I couldn’t do anything else in the app until I had connected the device.
When it arrived, I had low expectations for being able to use it right away, because people online talked about how long it took to charge/having a hard time charging it at first. Because of that, I expected to need to wait an hour or two of charge time before I used it and also was ready with a higher power wall plug to charge it. For some reason, the Hypershell batteries came (both) at 6% charge, but it was enough to turn on and get started for setting up the device. I was able to turn it on and get it connected in the app, do the onboarding (walking you through the first mode changes etc and taking test walks around the house in the different modes) even with it in 6% low battery status.
But then I took it off and put it on the charger to charge it up. I used the same wall plug I use for my laptop, and that was sufficient for its 65W charge rate. It takes a little over an hour to charge the 72 Wh battery up to full, and the lights on the device itself will show you (4 lights) when it’s fully charged, or you can see it in the app. It’s handy to have it lit up on the device because my husband, without access to the app, can see and change batteries to charge the next one himself.
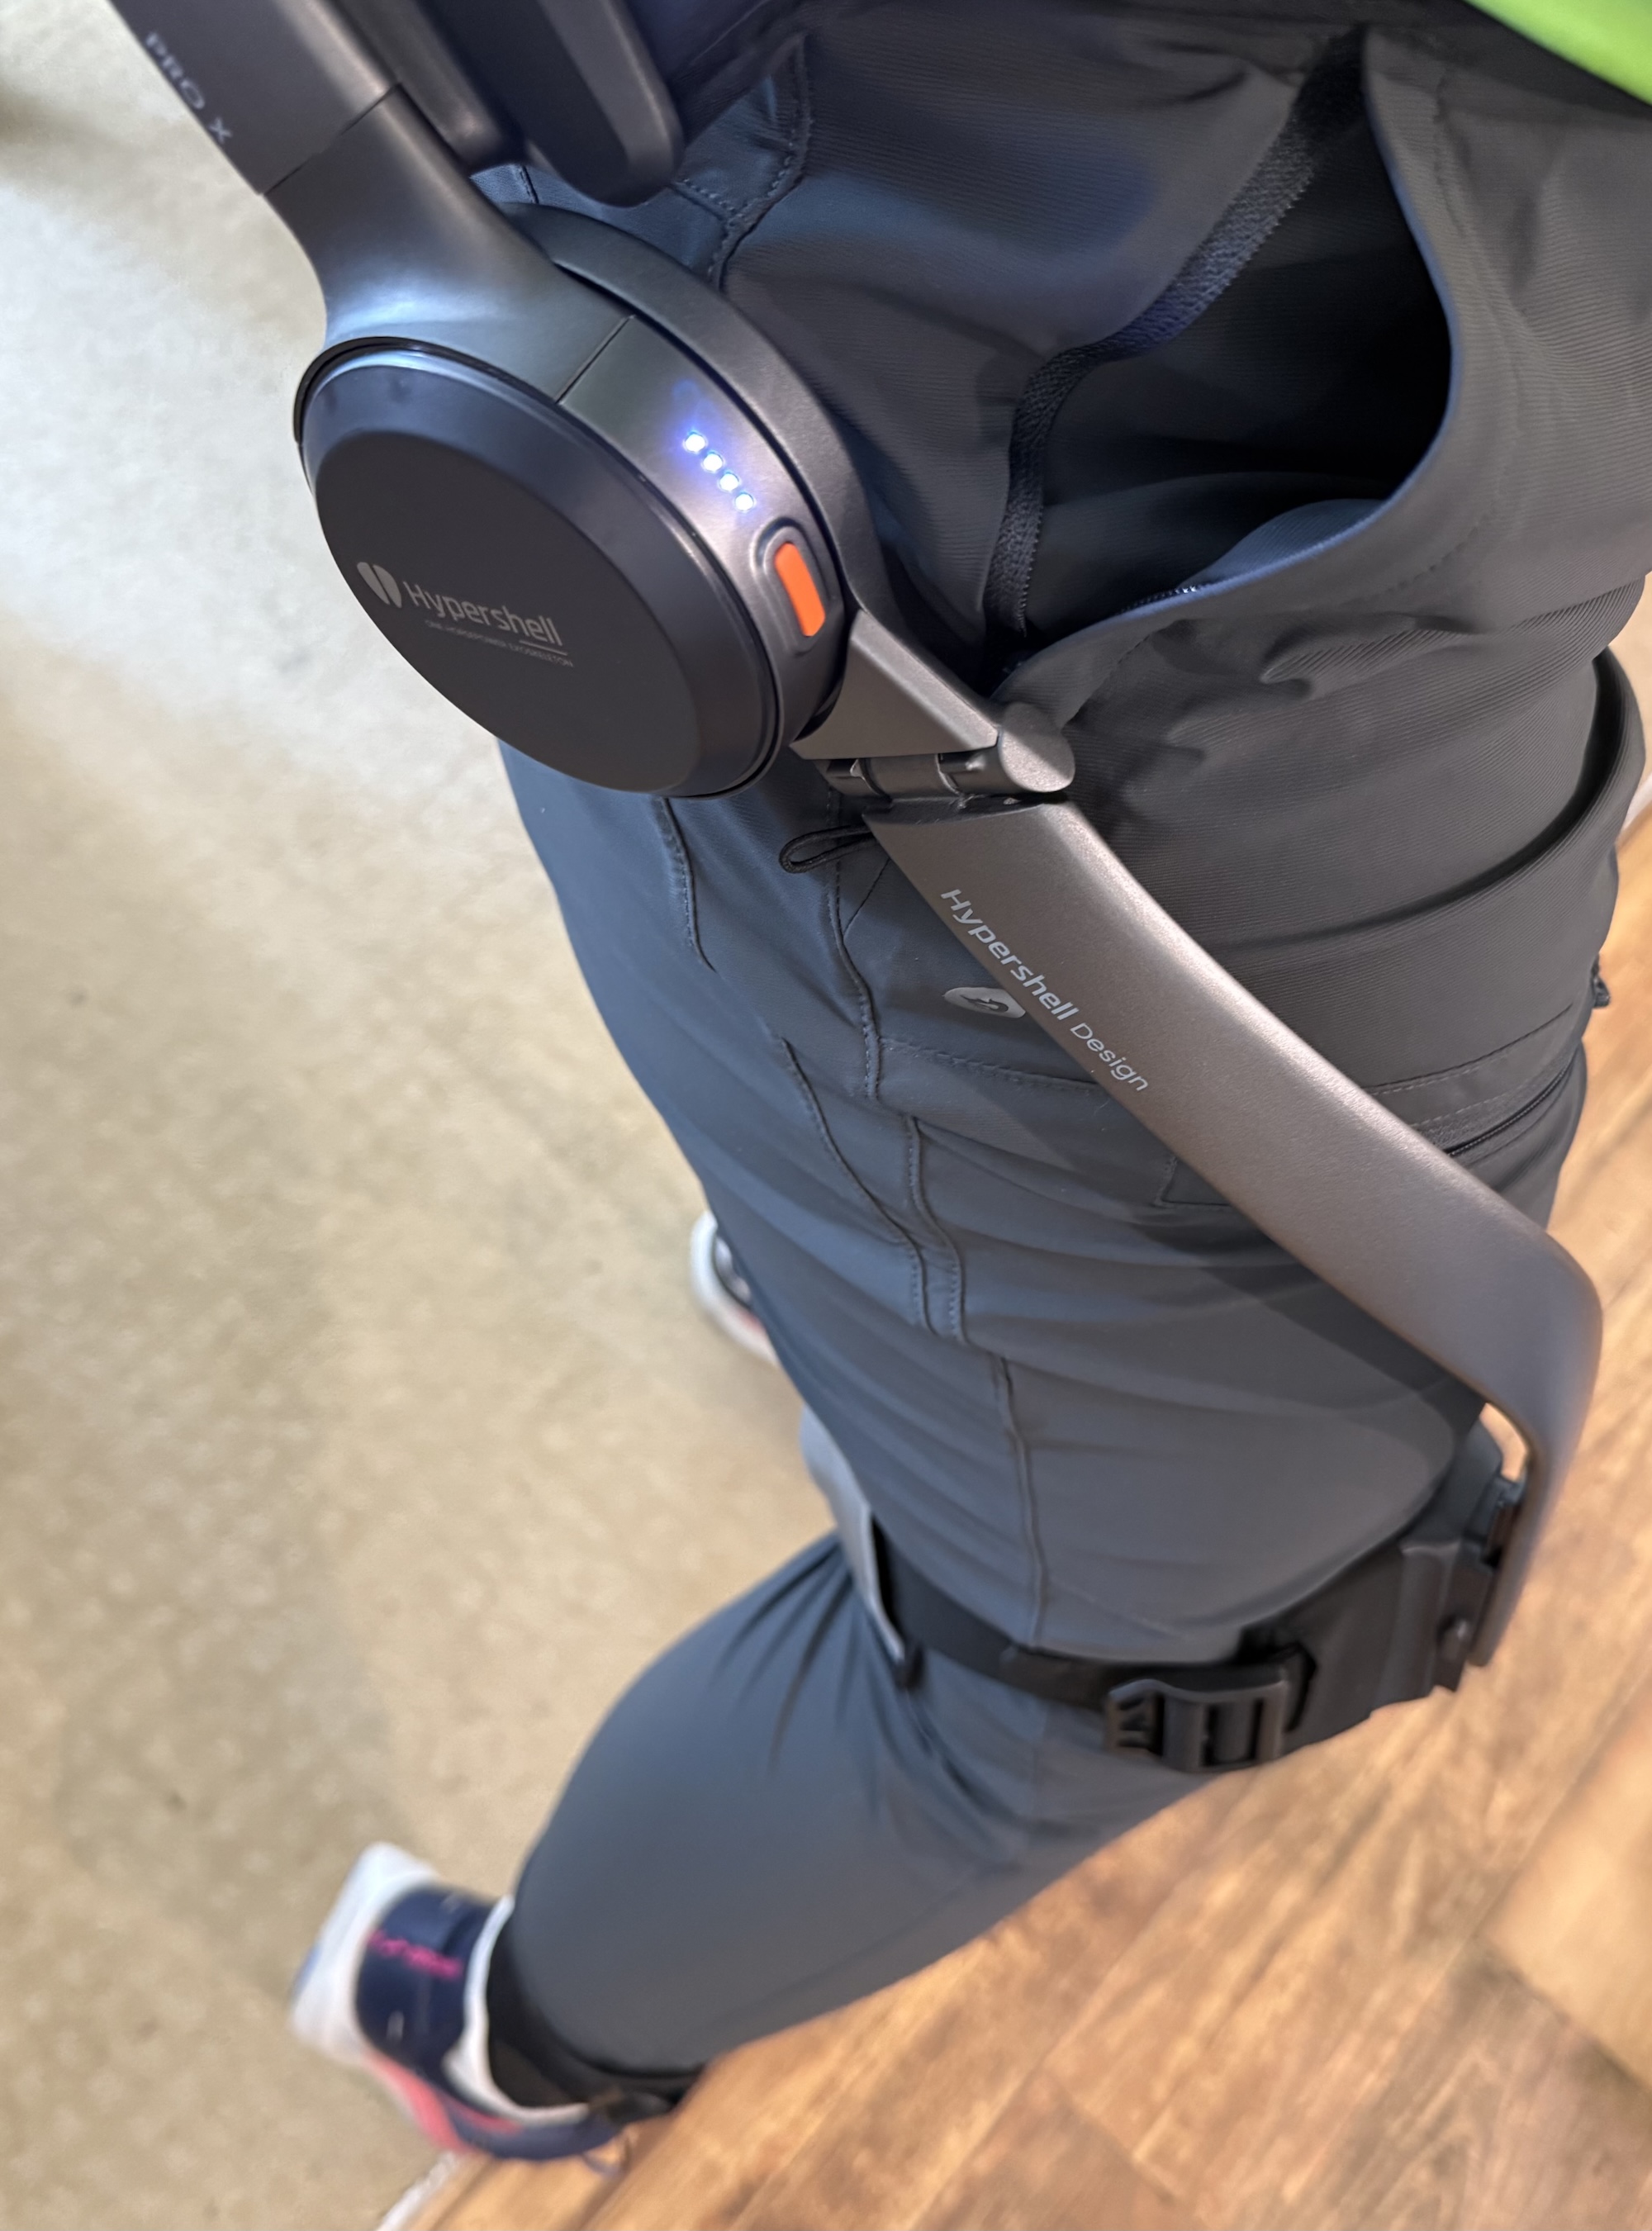 In terms of getting set up and putting it on, it’s very straight forward. It gave me a starting suggestion to use for the waist size. I used that (and have never changed it), tightened up the waist strap and leg straps, and it was good to go from there. Once I got the waist strap tightened, I haven’t had to re-tighten or change that. I have had to tweak the leg straps a little bit here and there, partially because of how it slides around on my leg (see below re: sweating, chafing, and wearing in the summer as opposed to wearing it over a layer of clothing), but it’s quick and easy to tighten the leg strap or loosen it when needed and not a big deal adjustment wise. I did read a few people saying it slips down their hips and they got suspenders to help, but I haven’t had that experience (I’m female, so I have plenty of hip bone for it to rest against, and maybe that’s in part what makes the difference?). The first time I put it on, because I was adjusting straps, I put it on while sitting at the edge of a chair and getting everything set up and tightened, then stood up and tweaked the straps, then turned it on and began using it. Now, I can grab it and put on the waist belt while standing, then slightly lean over and attach each leg strap (so I don’t have to sit down to put it on). Because it carries the battery in the back and the design also has the support bar around the back, it’s not really comfortable to sit with for long if you want to lean back against the back of the chair, but it’s fine if you’re sitting down briefly on something (a chair, a bench, etc) if you’re not trying to lean back or sit up against the back of anything.
My first time using the Hypershell Pro X
I was conservative with my first time using the Hypershell, in part because of users in various groups warning about taking it easy and not overdoing it. (If you have no disease/physical limitation as your reason for wanting to use this, you can probably ignore this.) After it charged fully, I put it on and went for a short mile and a half walk to see how it felt.
I knew from the onboarding experience (where it has you testing different modes) that I didn’t need “hyper” mode turned on to walk. “Eco” mode is the base mode, and you can adjust the power setting either on device (pressing a button twice increases it by 25%, triple pressing it drops it by 25%) or in the app with a slider that allows you to adjust it 5% increments.
I tried 25% power for my first walk, which was enough to feel the lift pulling my thigh and knee up. It felt so good! It made walking feel smooth and easy, especially on the right side where my thigh/hip muscles are more impaired. It felt like it made my walk more balanced in terms of not slogging along on the right side compared to my gait without assistance. I noticed a sensation of a few muscles feeling activation that normally aren’t getting activated (this is probably unique to my situation), but had no soreness or issues right after or the next day as a result of this test walk.
The next day, I did my normal length walk (of about 4 miles) with the Hypershell.
The third day? I took it hiking. And…(more about this below)
Small hiccups with adaptive mode recognition (that may be unique to my gait)
I had my app set to ‘adaptive motion recognition’, which is where it detects what you are doing (e.g. walking, going downhill or down stairs, idling, etc) and adjusts the assist based on the motion. It takes a step to kick in any assist and it takes about 2-3 steps into a new pattern (e.g., starting to go down the stairs) to swap modes. This means if I was walking toward the stairs and starting to go down the stairs, it would be the second or third step down where I would feel it change into downhill mode where I could feel it providing resistance against my thighs, as opposed to lifting my thighs as I stepped down. It was also very noticeable when I got to the landing and would take the 2-3 steps to turn the corner and continue down the flight of stairs. It would feel stiff-legged like I needed to tip toe to walk and then just as it switched to walk mode, I was going down the next flight of stairs and again it took 2-3 stairs before it was back on down hill mode. Not a big deal, but it did make me aware of it. I went down the stairs (carefully) while looking at the app which shows which motion pattern it is detecting, so I was able to see (and not just feel) that it was switching those modes and that’s why it suddenly felt different.
The other hiccup was when I was out walking on the sidewalk, which is flat. It was in walking mode and I was indeed walking, when suddenly it threw a stiff legged resistance at me. Huh?! I looked at the app and it showed “downhill” when I was walking on a flat surface. Weird. It reverted back to walk mode after 2-3 steps. It happened again later on my same walk. I must have something weird about my balance or gait that leans backward (?) or otherwise causes it to sense downhill, so it shifts to downhill mode. It didn’t trip me but it did make me go “woah” and I didn’t love it because I wanted to just be able to forget and walk without thinking about wearing it.
So as a result, I decided to turn off adaptive motion recognition and use it in ‘manual’ mode, rather than having it auto-detect. I’ve used it in “walking” mode ever since as my default mode, and it works great. It also still auto-detects and shows you what motion it detects in the app, but even with over a dozen miles of flat walking, it’s not thrown the downhill resistance in unexpectedly again. And, even in walking mode it still provides enough support and resistance for actually going down the stairs/downhill, regardless! So I get the same benefits without the risk of the sudden incorrect downhill resistance.
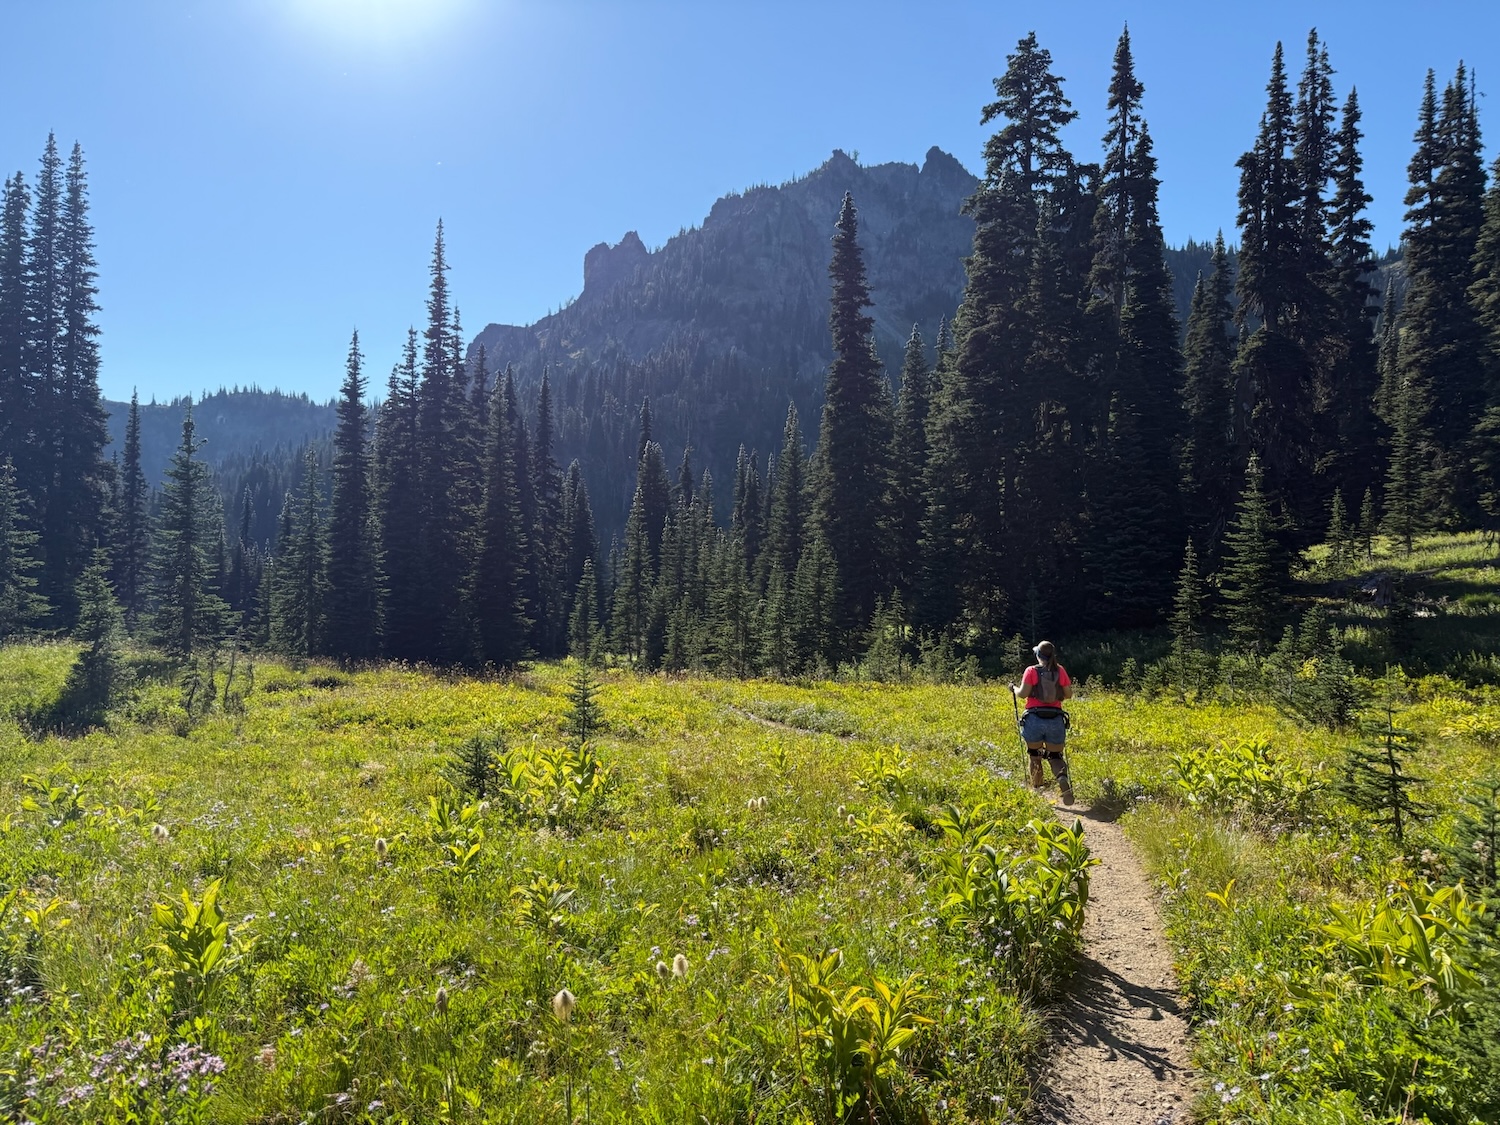
Kicking the tires of the Hypershell Pro X with hiking. A lot of hiking. Three days in a row!
Before using Hypershell, I could still hike. I used to hike three days in a row almost every week, but with this muscle disease, I found myself not being able to easily do it, so I would often hike Friday, rest and do something easier Saturday, then do another hike (maybe) on Sunday. This has been true for the last 6 months (or longer).
But my first hike with the Hypershell was on a Friday, and it went great. I played around with using the adaptive motion recognition and found that I couldn’t tell a big difference in the assist with ‘uphill’ mode versus ‘mountain climbing’ mode versus ‘walking’ mode. Downhill mode was good, but I also tested going downhill while in ‘walking’ mode and found it was good enough. Since all of these mode changes have to be done in the app, and the exoskeleton itself covers my pockets in a way that makes it hard to get my phone in and out of my pocket (plus I’m carrying poles), I decided I would try staying in ‘walking’ mode for everything from flat to uphill to downhill…and it did great. I felt so much more at ease stepping up and over steps and rocks and powering up hills the way I used to, and I also was thrilled that the little bit of resistance to my thighs for downhill made it easier to step and control my downsteps. All of this increased ease and control somehow resulted in me not generating the ‘sick muscle’ feeling I have been getting in my legs and glutes after hiking. In fact, I felt like I hadn’t been hiking at all! I was so thrilled that we decided we would hike again with it on Saturday, a second day in a row.
I did wake up with really tight calves on Saturday…but normal hiking tight calves, the way I used to get after the first few hikes of a new season when my calves are out of shape for climbing. I was thrilled because that meant that I was activating and using my legs MORE (despite the powered assistance of the exoskeleton!) on that first hike. Tightness and all, we decided we would hike again, and we actually chose a longer second-day hike with reasonable elevation now that I felt confident I could handle more of it with the exoskeleton. And I could: the second hike was also great, and I left it in ‘walking’ mode the entire time on the way up, but did find that I wanted to use higher power settings (still in eco) as a baseline and increase it further for hills. I think I used 30-40% as my base power, then would increase it more for bigger inclines. The nice thing is that for downhill, you are using less power, so even with ⅔ or so of the battery used up on my first and uphill half of the hike, I ended up at the bottom of the second hike with just above 10% battery left because the downhill uses so much less battery. (I had it in ‘downhill’ mode for the way down, where it provides resistance on the way down but when you’re on flats it’s not lifting your legs much as it would in walking mode.)
That went so well that…we headed out for a third day in a row. My first three-day weekend in a long time! Again, we chose a long hike with more elevation than we ever would have predicted would be possible for even a second day in a row, let alone a third day. This time, I was feeling more overall fatigue (hello, three days of hiking in a row!) and so I started with 50% power (eco mode) and cranked it up on hills. I finally remembered that I could adjust power with the button on the device, double clicking to add 25% as I went up a hill and triple clicking once I was on a flat (to decrease it back by 25%), without having to pull out my phone and open it and navigate to the app and slide the toggle. That made it easier, because I could still do that with poles in my hand.
Because I was cranking up the power more on this third day in a row, I did run out of battery on this hike. This was in part because there was a pretty steep climb on our return route about 2 miles from the end (of an 8.8 mile hike), and I wanted to crank the power all the way up to 100% (still on eco). I managed to get the battery down to 10% about halfway up that steep climb, and when it hits 10% it still goes but it definitely decreases the output. So we stopped and swapped to the second battery (that I had Scott carrying in his backpack). It’s quick and easy to pop off and swap (I let Scott do it). I powered it on and it instantly reconnected to the app, I put it back on 100%, and cranked my way up the rest of the hill with relative ease. Then I bopped the power back down to 50% for the rest of the hike. One of the reasons I ran down the first battery is because on the downhill/return portion, I kept it in “walking” mode for more assist rather than “downhill” mode. Again, three days in a row meant I was more tired overall and my legs were tired (but normal tired, not disease-tired), so I wanted the extra power to make sure I kept good form and didn’t cause injury by doing an atypical gait in my fatigue.
And I didn’t – I finished the hike, tired (normal tired) and with legs feeling in no way like we had hiked for three days, even though we did.
In three days in a row (which I can’t do without the Hypershell), we hiked 25 miles and over 6000 feet of elevation gain (which I wouldn’t be able to do without the Hypershell).
Instrument of freedom, indeed.
Did I keep the Hypershell Pro or did I return it? Is it worth it?
By the middle of the very first day of hiking, I knew I was keeping the Hypershell.
It works so well for me, and it really is an instrument of freedom for me. I love walking even on my flat paved trails with it, again because it makes my right hip and leg movement so much closer to what I used to experience (before my muscle disease).
Between my daily walks and the first two weekends of hiking, I have put around 60 miles on foot with the Hypershell Pro.
I’m definitely keeping it. It will be interesting to see if I run into any issues with my high-mileage use. The warranty is supposed to last for a year, and the website estimates ‘normal use’ service lifetime is 3000 km (1,900 miles). If I kept up my current pace of use (averaging 60 miles in two weeks) for a year, that would be around 1,560 miles, still under the expected lifetime use. I’d probably run into that life expectancy (which doesn’t mean it’ll stop working but might be when I expect it to run into issues) in about 14-15 months (or less if I increase my mileage).
But given how much it empowers me to move in the ways I want to move… it’s worth it. And I’m excited to see what other exoskeletons are coming to the market in the future, too. There may be more options for me to consider when this one eventually breaks or wears out.
Does it help with downhill or going down the stairs?
One of the things I really was hoping the Hypershell would help with is going downhill. I have trouble exerting power all the way through my foot, which is really noticeable when I am going downhill on looser dirt or rocks, where it feels like my foot is likely to slip sideways and cause me to jolt/lose my balance. As a result, my downhill hiking became as slow as the outbound uphill hikes (instead of faster, which is common for many people and the way it used to be for me) and made me really rely on my poles for balance. Plus it was super stressful and made hiking less fun, and I also skipped a lot of hikes that had a lot of rocky steps or rocky and loose rock downhill gravel terrain. But because of the Hypershell experience on my first hike, I actually chose a pretty rocky hike for the second hike because I was hopeful that it would help my sure-footedness. And it did! So much so that my second weekend of hiking, I chose a 9 mile hike with 3,100 feet of elevation gain that had a two mile stretch of loose rock and loose dirt with a good portion (1800 feet) of the downhill elevation. And I did great, with the Hypershell on.
But I didn’t know it would help when I got it. A lot of people talked about how it ‘didn’t help going down stairs’, so I had low expectations. When I went down stairs the first time, I didn’t notice a big difference, but when I hit the landing and took those 2-3 steps toward the next flight of stairs, I could feel that stiff legged feeling that definitely indicated it was providing resistance! So it was doing SOMETHING, but sometimes it was hard to tell what it was. Over time, with more experimentation on stairs and testing ‘downhill’ and ‘walking’ mode on different downhill terrains while hiking, I realized that I could feel the thigh-based resistance more strongly when in a higher power setting. The way it seems to work is it either provides some kind of down force against the leg as you are stepping down, or it provides resistance against your leg movement. I’m not quite sure which it is, but it results in a bit of pressure against your thigh, and probably some resistance on the sides (to limit lateral movement while stepping down), and it definitely helps me.
The other way I’ve figured out how to notice it is that with higher power modes while walking (and in walking mode), you can feel the lift ‘up’ from the thigh but depending on how quickly your leg is moving you can also feel the bar pushing back down into the down step. So the motor is able to move the bars (and thus your thighs) both up and down, and that’s likely also similar to what’s happening in downhill/stairs mode, but it’s less noticeable because you don’t lift your thigh as high (or at least, I don’t) when stepping down and it’s a much subtler force against your legs. But if you have stairs with landings, that’s a great place to put it in downhill mode and feel that type of sensation when you get to the landing and take a few steps before you do the next flight of stairs down.
There is also a setting you can adjust call “hill descent control” and once you toggle it on, you can adjust it between ‘weak’ and ‘strong’ (defaults to the middle of that range). I turned mine on but haven’t experimented with adjusting the slider to be stronger, but that may be another reason why I notice a benefit on downhills, whereas other people may not have turned that on.
Is it annoying to charge?
You have to charge the battery on the device itself (with a USB-C cord, and as I mentioned a beefy enough wall charger) or in a special hub that doesn’t come with it. The special hub can charge 4 batteries at once, off-device. Mine came with two batteries and since they charge up in an hour-ish, even if I run both batteries down and get home, it’s always going to be 12+ hours before I want to use it again and that’s plenty enough time to re-charge everything, even with swapping to the second battery to recharge.
I can see how if I went to having 3 batteries and using them regularly that I might want to also get the multi-battery charger, but for 1-2 batteries and my usage, it’s generally not a big deal.
Is there anything I don’t like about the Hypershell Pro X?
I have two (ok, three) issues with the Hypershell. All are minor.
For me, the adaptive motion recognition setting triggering ‘downhill’ when I am walking on a flat surface (albeit randomly and only occasionally) is annoying. Again, I don’t know if it is because of my gait or if there’s a bug in the pattern recognition. There is a workaround – putting it in ‘walking’ mode. I have found that it’s totally fine to keep it in ‘walking’ mode when going up or down stairs, up or down hills, on varying terrain, on flat surfaces. It still provides the lift to pull my thigh up just fine, and it also does the ‘resistance’ force for downhill and down stairs the same (or very similar) to the actual downhill setting. If I want to do more, I can easily turn the power up or down using the on-device button and get more force (for either lifting or resisting), and that is faster than trying to swap modes on my phone.
The second issue is chafing against bare skin. Ohhh, the chafing. You’ll notice that all of the pictures on their website and videos are of people wearing it over pants for winter-type activities. Some people hike in pants during the summer, but I got mine in July and I don’t wear long pants to walk or hike, so the straps around my thighs are against bare skin. I didn’t have any issues for the first few walks (which were all around an hour) but my first hike, which was 3 hours, caused some chafing. So on the second day, I covered those spots with bandaids. It wasn’t enough, I ended up with more chafing spots. So on the third day, I tried putting kinesio tape on my legs where I thought spots would chafe or were already chafed. That did help, but because I’m hiking so long (3-4 hours, multiple days in a row), just like ultrarunning in dealing with pack chafing, it’s hard to deal with once you have chafed spots.
The second week, I tried additional solutions. First I tried wrapping the pads themselves with “adhesive bandages” (think ‘vet wrap’, the stretch stuff that can stick to itself). I was trying to see if just covering the back of the front thigh pad would work, because there are seams underneath it. That helped some, but the force of the corner of the pad itself was chafing. I then bought a roll of 5 inch “tubular bandages”. I got 5” because I have more muscular thighs and I wanted to try putting a piece on my leg like a leg sleeve, and then having the pads against that, so it would rub against the bandage and not my skin. It helped some, but it was still digging in at the corners. So then I tried the leg bandage sleeve AND adding a layer of that material over the pad, double wrapping it at the corners. It helped some. But again, because I already had chafing, I don’t quite know what would work best to completely prevent or eliminate chafing. (I also have tried a 4 inch tubular bandage that was black, to better blend in with the leg strap, because the 5″ worked well but really popped in color and drew the eye to my legs, whereas the black better matches the leg bars and leg straps. In terms of functionality, I like the 5″ tan color better for using as a leg sleeve actually on my leg, so I’ll probably use that as a base layer if I’m not taping as described below when I’m not actively chafed, and then use the black on top of the leg pads and around the buckles directly.)
The next thing I have tried is hydrocolloid bandages (example, there are a lot of different brands and sizes and I’ve found no difference between name brand and off brand versions) on top of the biggest already-chafed spots, with the idea that it will provide cushion and also the pad corners will be more likely to slip on that versus digging in at the exact same spot. Because hydrocolloid (“blister” bandages) stick directly on the skin, I added a bit of neosporin on top of the chafing before applying, so that the bandages don’t stick to the slightly raw skin. The challenge with hydrocolloid bandages is that they take up any fluid, like blister fluid, but also sweat – so as you get sweaty, they’re more prone to peeling up or getting rubbed off via the edges. If you have a big enough bandage that’s less of an issue, but don’t expect to be able to cover a tiny area with a tiny hydrocolloid bandage and not have it peel up from the friction of the leg strap/pad itself or have it start to come off from sweat. I also tried applying larger strips of kinesio tape on top of the hydrocolloid bandages that are smaller, and the hydrocolloid seems to provide a nice cushion against the already chafed spots and the kinesio tape helps prevent it from rubbing the hydrocolloid bandage off.
It’ll be better in winter, when I’m wearing it on top of a layer of pants, and it’s not a reason to stop using it. In fact, most people probably won’t wear it long enough even in hot weather to experience it, but I wanted to document some of the solutions I tried in case anyone else does run into it.
UPDATE: the best solution I found is:
1) as soon as I notice the chafing begin in any spot, I stop and put a strip of kinesio tape in that area. (I pre-cut kinesio tape strips and carry them in my pack).
2) if I miss preventing a chafing spot and something has rubbed, I do a combined strategy of first putting a piece of hydrocolloid tape (I bought a roll so I could cut strips rather than using bandaid-sized – it’s cheaper and easier to apply different shapes) AND then putting a piece of kinesio tape over it. Why? Because as noted above, the hydrocolloid will collect sweat and fluid under the skin and start to come up during an activity, unless it’s anchored – and it’s best to do that when you apply it. That double strategy (hydrocolloi+kinesio, applied when your skin is dry) lasts for several days or longer (I’ve had it last up to a full week, even with multiple showers per day and using the exoskeleton every day), and it both heals up the chafed raw spots and protects subsequent spots from building up. So that’s a great solution during multi-hour bare-legged hike/activity season.
We’ve now also gotten to fall and I can confirm that chafing is not an issue at all when wearing it over long pants.
The third minor issue is accessing my pockets. The motor is on the outside of my hips and although the bars curve around down the front of my thighs, the access to my side pockets on my shorts is blocked. This is where I typically store fast-acting carbs on one side (because I have type 1 diabetes) and my phone on the other side, but I basically have to stop walking and pause and really finagle my hand in under the motor and bar to access something in my pocket. It’s annoying, so I actually stopped carrying my phone in my pocket while wearing it. I decided to get a phone carrying case that mounts to a backpack strap – or in my case, a Hypershell waist strap! It lives on the strap and I’m able to slip my phone into the 4 corners whenever I want to. I also like that the webbed strap comes out of the case, so I can pull my phone off it and use it (while it’s still in the straps) and then quickly put it back on the belt mount. There’s a little more friction to the experience than without the Hypershell, but it’s 5x easier than finagling my phone out of my pocket under the Hypershell.
If you want a referral code for a Hypershell, here is a referral code.
Right after I bought my Hypershell, I automatically got an email for a referral program. If you use this code, and you buy a Hypershell, it gets you $30 off. It’s not a lot, but it’s better than nothing. Sometimes they run deals where you can get accessories for free or some dollars off particular accessories. The ones I’ve seen are usually for more than the value of the referral code – e.g. they might offer an additional battery which is a $99 value instead of the $30 off. Depending on your situation, you may like one or the other better. I mention it because it doesn’t seem like it’s compatible to use the $30 off referral code at the same time as the other deals (or it wasn’t at the time that I tried to use someone else’s referral code at the time of my purchase).
Referral code (click this to generate the $30 off code which you use at checkout on Hypershell’s site): https://hypershelltechglob.refr.cc/referral30/u/danalewis
Should you get a Hypershell? Why or why not?
My experiences above are as someone living with an autoimmune disease that is affecting my muscles. But now that I’ve gotten it and tried it, I think I would love it even without the need for assistance with my muscle disease. Why? It’s like an e-bike for the legs. Not in the sense that it can do all the work (it can’t, it can only provide up to 20-30% assistance: you’re still doing a lot of work), but because it is an equalizer.
My husband and I have had e-bikes for years. We loved them, because of the equalizing effect. I can bike longer with e-bikes than I would without an e-bike. In fact, before we got e-bikes, we didn’t have bikes and would only sporadically ride (rentals), because biking wasn’t my thing. When we got e-bikes, we biked for dozens of miles at a time, together. I could bike at whatever power assist level I needed or wanted for the day, and he could use less assist and get more of a workout, but it enabled us to bike together (and to WANT to bike together) in ways that we couldn’t or wouldn’t otherwise.
An exoskeleton is the same situation, roughly, as e-biking in this sense. I talk to several people who ask questions when I’m out walking or hiking with the Hypershell on. Sometimes people ask about it for bad knees (I don’t have knee problems but I can imagine it would help – if you have knee issues and Hypershell experience, please share in a comment below!), but a few people have asked about it for backpacking experiences. One couple immediately said “I wonder if this would help for backpacking” and I said probably, yes – because the company advertises it to be able to do more for longer, especially with gear (e.g. they show people hiking with photography gear or big backpacks). So even without medical conditions, I could see getting a lot of use out of it when you have a pair of people who have different capabilities or range who want to go adventuring together. Especially if you’re a set of people (or an individual) who like to put in a lot of miles throughout the year…just like I am. I’ve already done 5 hikes in two weeks (plus a bunch of paved walks) and just hiking alone, that takes the per-hike cost down to $240, and will drop further each time I use it – remember that I wouldn’t have done some of these hikes at all (either because I couldn’t do them in subsequent days or I couldn’t do particular terrain at all). That per-hike cost will continue to drop over the course of the year (or more) of use that I expect to get out of this Hypershell Pro X.
How much work are you really doing when you wear a Hypershell exoskeleton? Doesn’t it do all the work for you?
Each of the two Hypershell batteries I have are 72 Wh (5000 mAh). That’s…actually not that much. It’s the equivalent to ~62 kcal if you’re thinking about food calories as a comparison. If you could continuously run the motors at full power, it would d only last 5-6 minutes. (That’s why I ran it down fast on 100% power on a really steep hill at the end of my third hike). With less power output, it goes longer time/mileage (e.g. the around 10 miles range estimation on lower power setting in eco mode), but it’s still only 62 calories of total energy, whereas I might be burning the equivalent of 1000+ calories of active energy in the course of a 3-4 hour hike. Yes, it provides power, but it’s targeted power to your legs (and there’s also heat loss), and you do a LOT of other work controlling your trunk, hips, core, arms, balance, etc. so it maybe contributes to 10-20% of energy savings. But again, you’re likely to do more – remember the e-bike analogy – and burn a lot more than you would without the Hypershell by doing more, well above and beyond anything you saved by using the Hypershell. You still do 90% of the work, for longer time and longer mileage and more elevation, resulting in more effort overall. You will still do plenty of work, but it will be easier to go further, longer, etc.
—
TLDR: I got a Hypershell Pro, I love it, and it’s enabling me to do more than I could before (in my unique situation with a muscle-related autoimmune disease). I do recommend it, for a variety of different situations, whether or not you have any physical limitations. It’s an instrument of freedom for anyone who wants it.
Feel free to ask any questions below. I can’t answer questions specifically about whether it would work for your specific setup or medical condition, but I can try my best to generalize from my experience & what I’ve read from others online.
PS – are you curious about the latest version, the Hypershell X Ultra? I was able to try one, and here’s a separate post about my experiences with the Hypershell X Ultra and my comparison to the Hypershell X Pro.
 If you have any feedback (for example, if it’s been helpful or not), you can email me any time (Dana+EPI-PEI-SS@OpenAPS.org). I’d also love to collaborate, if you’re interested in partnering on any research studies. We have some ongoing studies in different countries (US, Ireland, New Zealand, Australia) in different populations (general population; people with diabetes; people with pancreatic cancer; etc) and I’m looking forward to partnering with other researchers on additional validation studies and exploring if and how the EPI/PEI-SS can help us address some of the gaps of real-world clinical practice and life with EPI.
 Here are the top questions I see about exocrine pancreatic insufficiency (EPI / PEI), especially when someone is newly diagnosed.
 AI often gives us new capabilities to do these things, even if it’s different from the way someone might do it manually or without the disability. And for us, it’s often not a choice of “do it manually or do it differently” but a choice of “do, with AI, or don’t do at all because it’s not possible”. Accessibility can be about creating equitable opportunities, and it can also be about preserving energy, reducing pain, enhancing dignity, and improving quality of life in the face of living with a disability (or multiple disabilities). AI can amplify our existing capabilities and super powers, but it can also level the playing field and allow us to do more than we could before, more easily, with fewer barriers.
 Not everyone finds IUD insertions or replacement to be excruciating. If you don’t, I’m so glad for you. But my experience was that it’s the most painful thing I’ve ever experienced. Over half the people I talk to with personal experience also say it is incredibly painful. So if you are one of the people, like me, who find IUD insertions or IUD replacements to be a terrible, painful experience…ask about a paracervical block. It makes an incredible difference and I’m now not dreading the replacement or future removal.
 These are actionable, doable, practical things we can all be doing, today, and not just gnashing our teeth. The sooner we course correct with improved data availability, the better off we’ll all be in the future, whether that’s tomorrow with better clinical care or in years with AI-facilitated diagnoses, treatments, and cures.
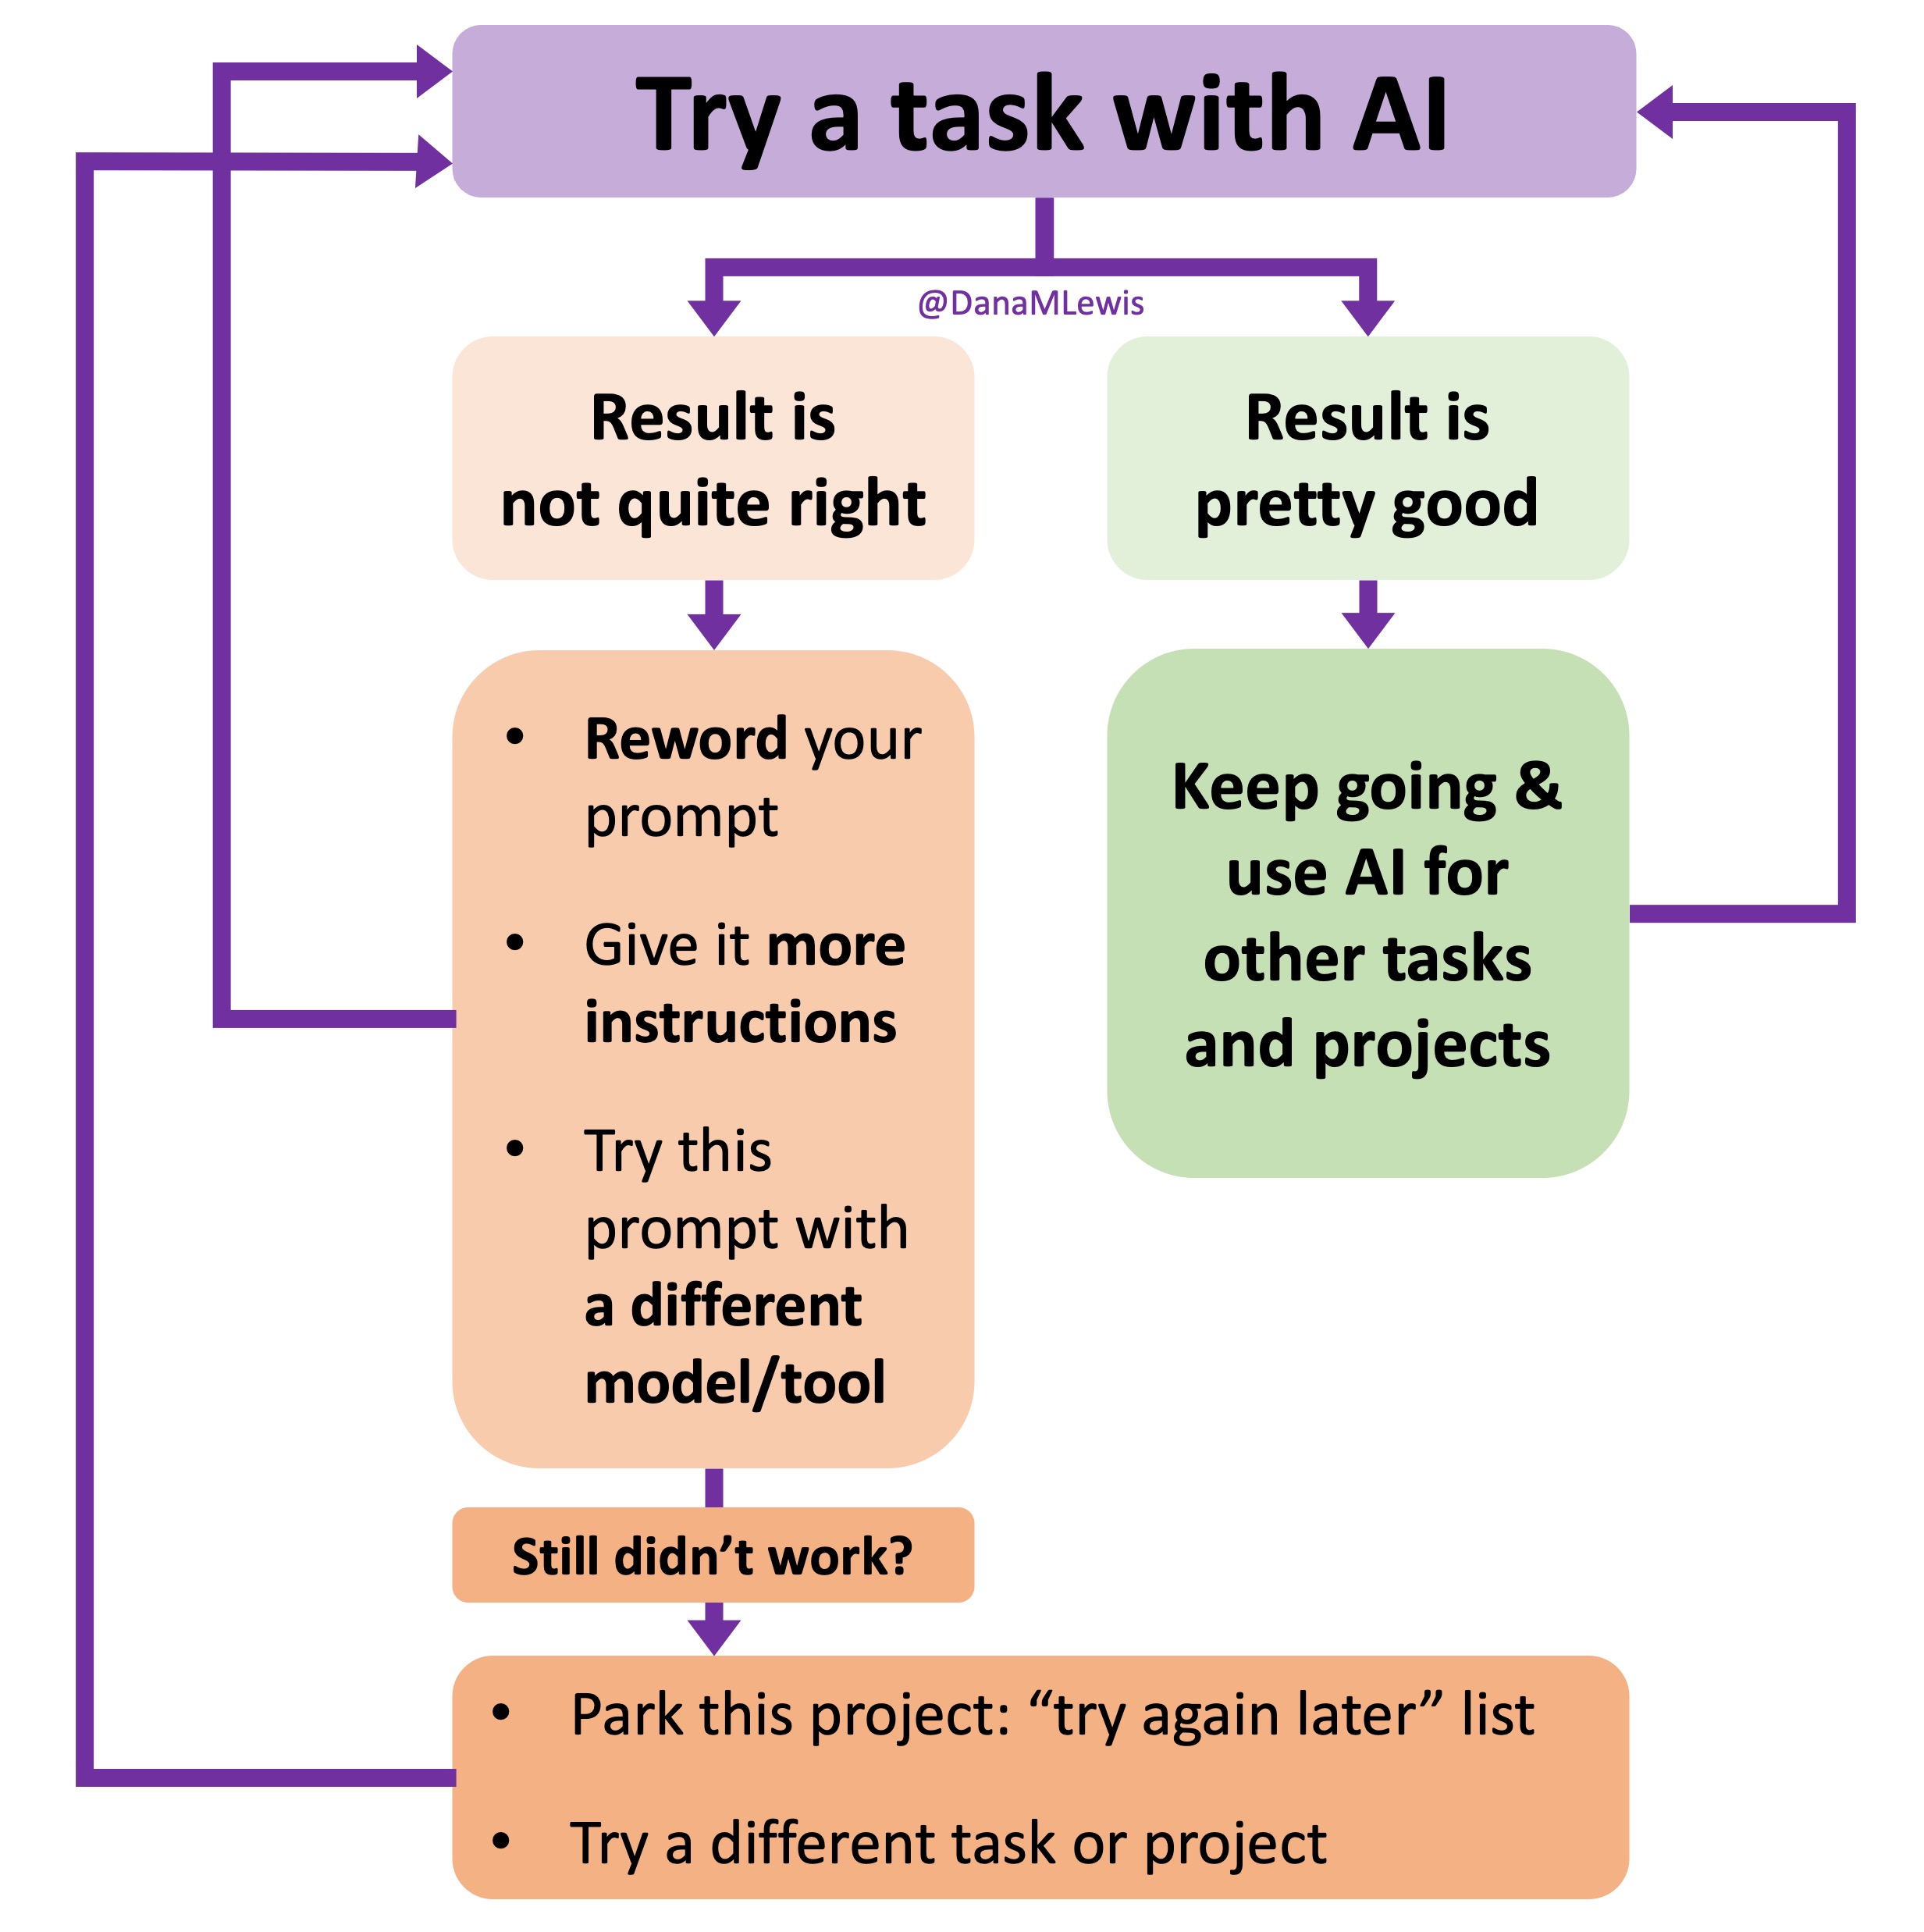 I’ve started making a list of projects or tasks I want to work on where the AI isn’t quite there yet and/or I haven’t figured out a good setup, the right tool, etc. A good example of this was
 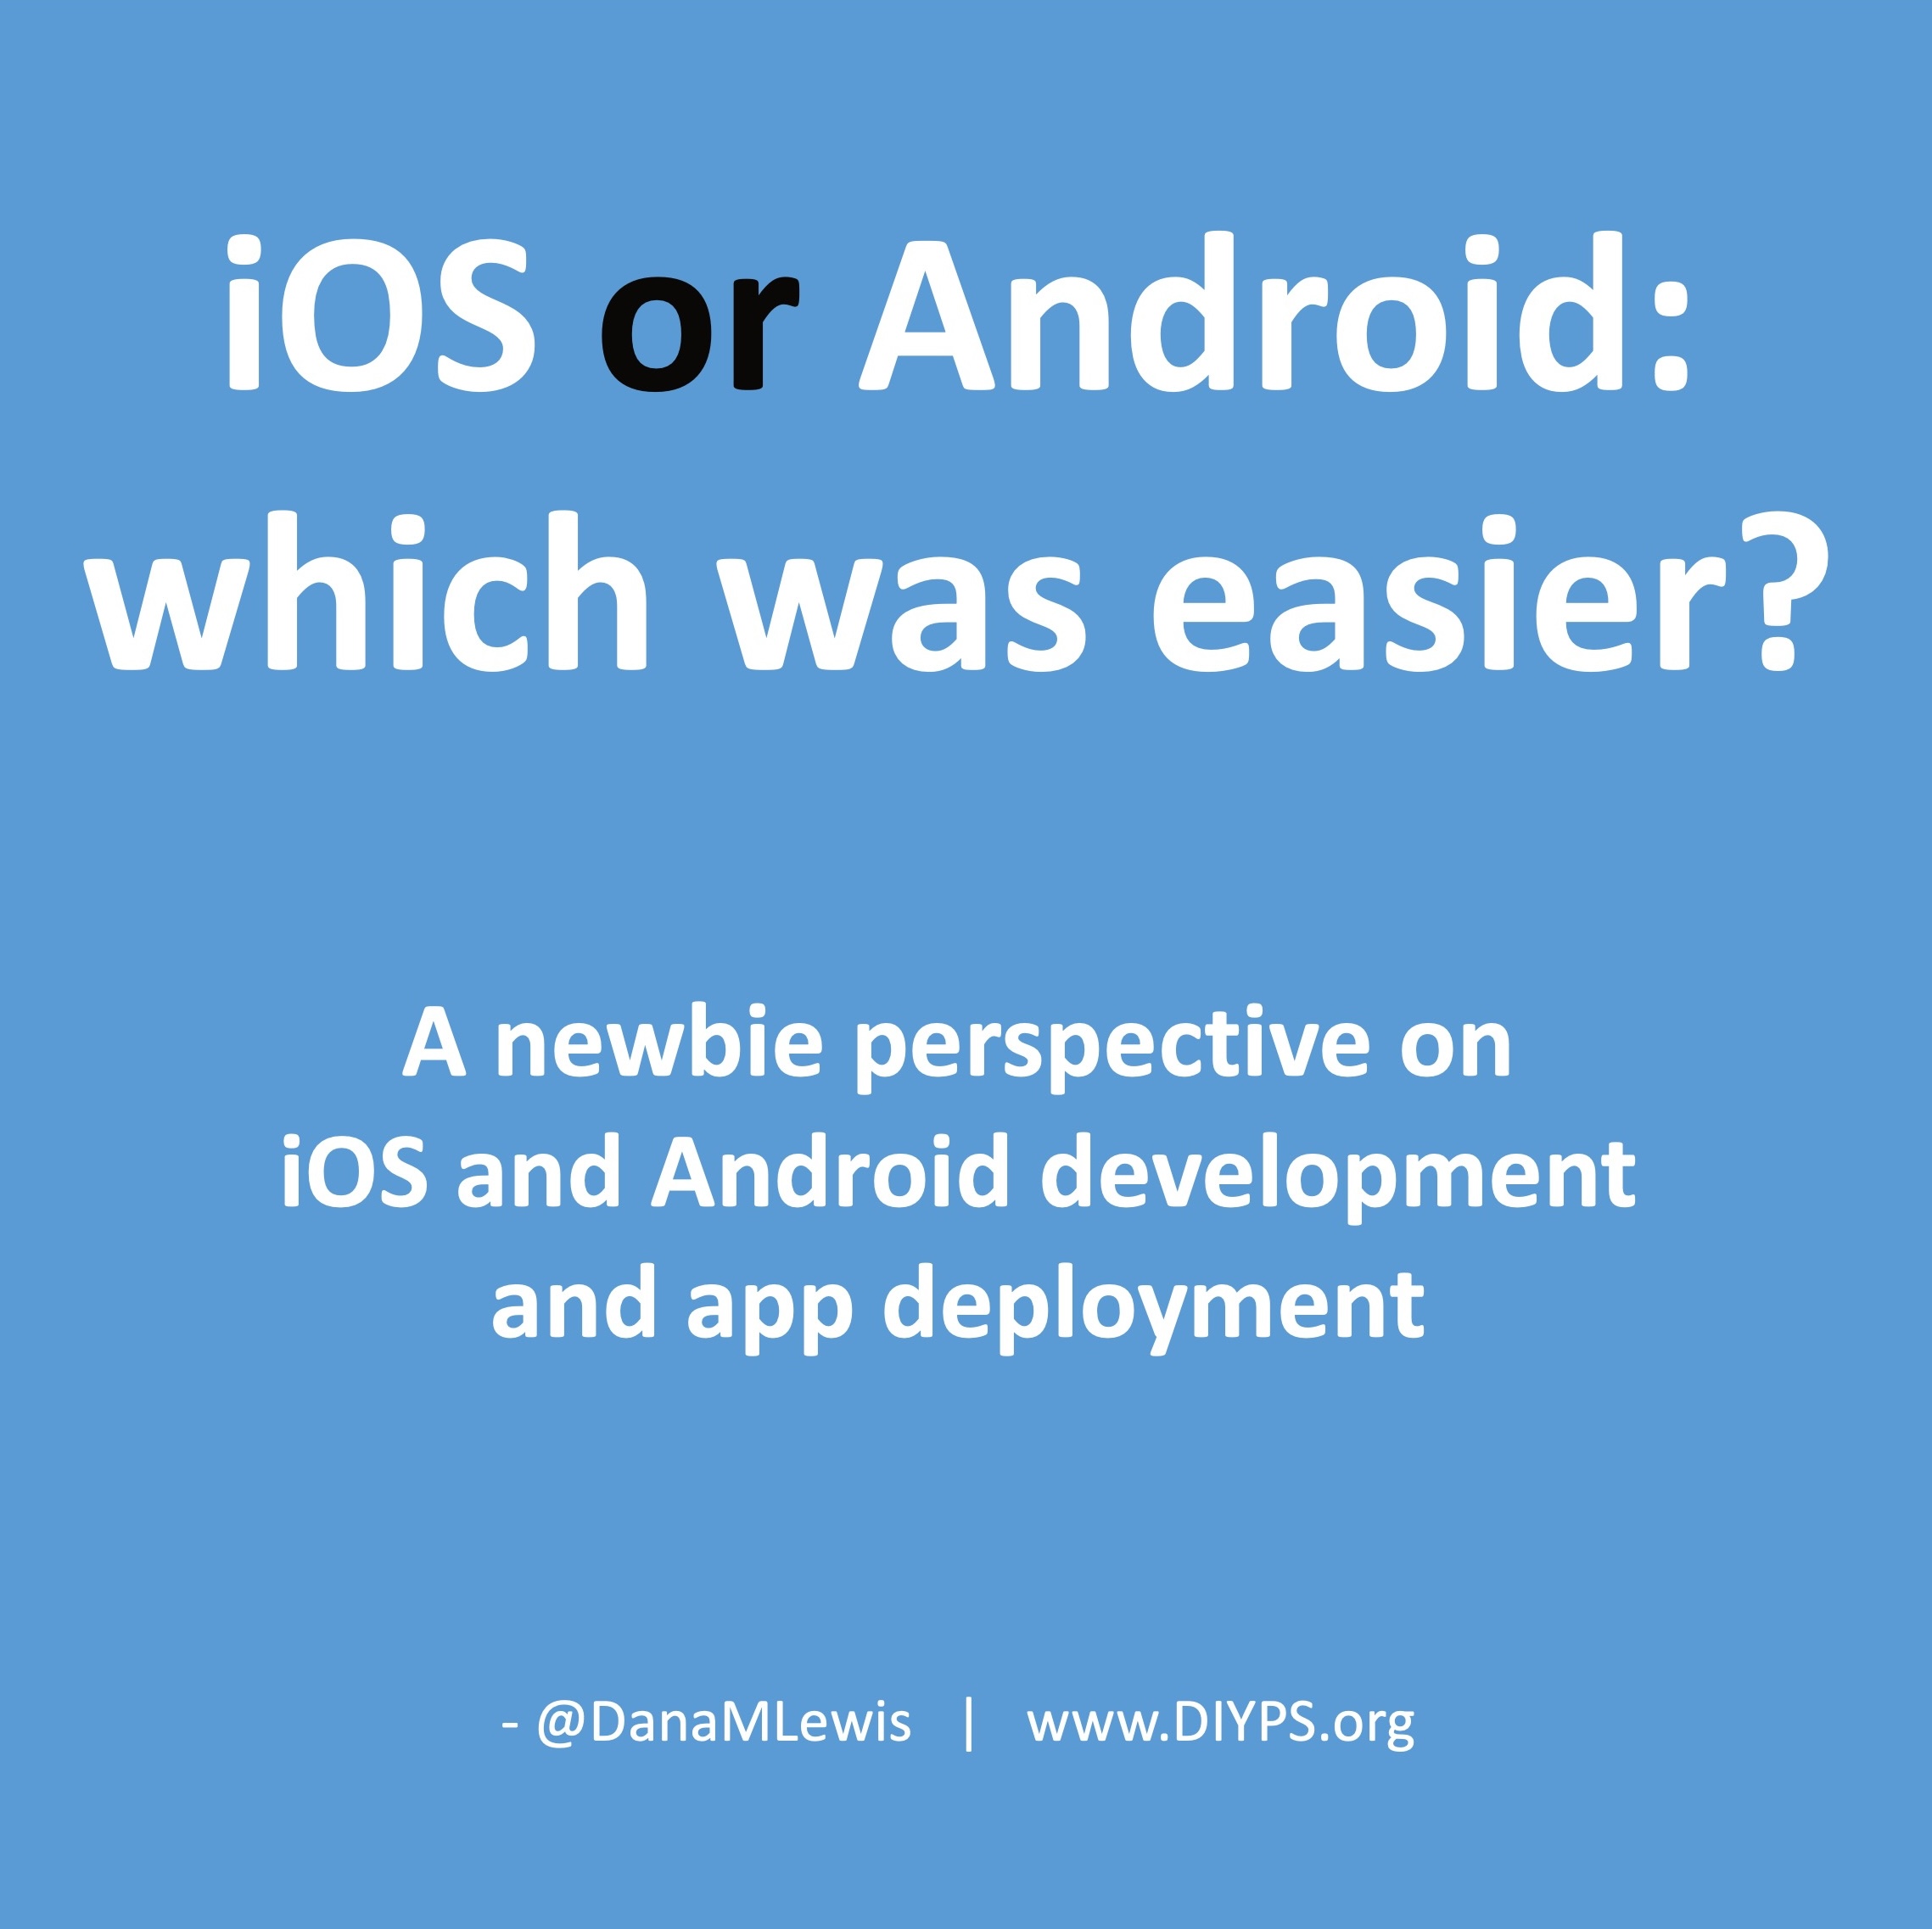 TL;DR: as more and more people are going to vibe code their way to having Android and/or iOS apps, it’s very feasible for people with less experience to do both and to distribute apps on both platforms (iOS App Store and Google Play Store for Android). However, there’s an up front higher cost to iOS ($99/year) but a slightly easier, more intuitive experience for deploying your apps and getting them reviewed and approved. Conversely, Android development, despite its lower entry cost ($25 once), involves navigating a more complicated development environment, less intuitive deployment processes, and opaque requirements for app approval. You pay with your time, but if you plan to eventually build multiple apps, once you figure it out you can repeat the process more easily. Both are viable paths for app distribution if you’re building iOS and Android apps in the LLM-era of assisted coding, but don’t be surprised if you hit bumps in the road for deploying for testing or production.
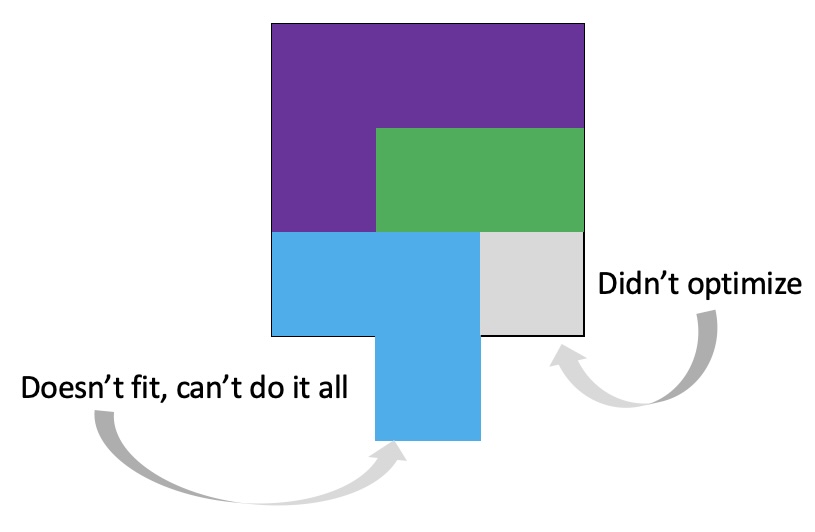
 As things change in my body (I have several autoimmune diseases and have gained more over the years), my ‘budget’ on any given day has changed, and so have my priorities. During times when I feel like I’m struggling to get everything done that I want to prioritize, it sometimes feels like I don’t have enough energy to do it all, compared to other times when I’ve had sufficient energy to do the same amount of daily activities, and with extra energy left over. (

 It’s important to remember that even if the total amount of time is “a lot”, it doesn’t have to be done all at once. Historically, a lot of us might work 8 hour days (or longer days). For those of us with desk jobs, we sometimes have options to split this up. For example, working a few hours and then taking a lunch break, or going for a walk / hitting the gym, then returning to work. Instead of a static 9-5, it may look like 8-11:30, 1:30-4:30, 8-9:30.
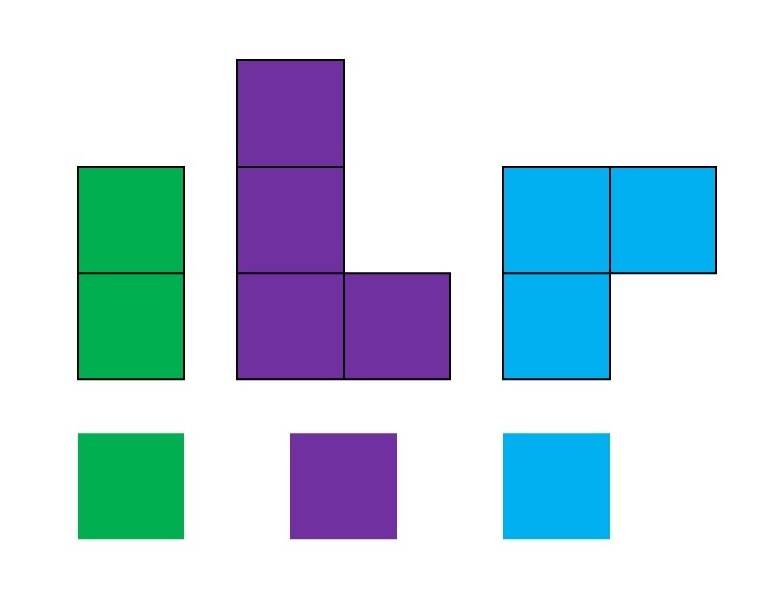


Recent Comments