Academic and medical literature often is like the game of “telephone”. You can find something commonly cited throughout the literature, but if you dig deep, you can watch the key points change throughout the literature going from a solid, evidence-backed statement to a weaker, more vague statement that is not factually correct but is widely propagated as “fact” as people cite and re-cite the new incorrect statements.
First off, no one has done a study on the overall population of EPI and the breakdown of the most common co-conditions.
Secondly, I did research for my latest article on exocrine pancreatic insufficiency in Type 1 diabetes and Type 2 diabetes and was looking to contextualize the size of the populations. For example, I know overall that diabetes has a ~10% population prevalence, and this review found that there is a median prevalence of EPI of 33% in T1D and 29% in T2D. To put that in absolute numbers, this means that out of 100 people, it’s likely that 3 people have both diabetes and EPI.
How does this compare to the other “most common” causes of EPI?
First, let’s look at the prevalence of EPI in these other conditions:
In people with cystic fibrosis, 80-90% of people are estimated to also have EPI
In people with chronic pancreatitis, anywhere from 30-90% of people are estimated to also have EPI
In people with pancreatic cancer, anywhere from 20-60% of people are estimated to also have EPI
Now let’s look at how common these conditions are in the general population:
People with cystic fibrosis are estimated to be 0.04% of the general population.
This is 4 in every 10,000 people
People with chronic pancreatitis combined with all other types of pancreatitis are also estimated to be 0.04% of the general population, so another 4 out of 10,000.
People with pancreatic cancer are estimated to be 0.005% of the general population, or 1 in 20,000.
What happens if you add all of these up: cystic fibrosis, 0.04%, plus all types of pancreatitis, 0.04%, and pancreatic cancer, 0.005%? You get 0.085%, which is less than 1 in 1000 people.
This is quite a bit less than the 10% prevalence of diabetes (1 in 10 people!), or even the 3 in 100 people (3%) with both diabetes and EPI.
Let’s also look at the estimates for EPI prevalence in the general population:
General population prevalence of EPI is estimated to be 10-20%, and if we use 10%, that means that 1 in 10 people may have EPI.
Here’s a visual to illustrate the relative size of the populations of people with cystic fibrosis, chronic pancreatitis (visualized as all types of pancreatitis), and pancreatic cancer, relative to the sizes of the general population and the relative amount of people estimated to have EPI:
What you should take away from this:
Yes, EPI is common within conditions such as cystic fibrosis, chronic pancreatitis (and other forms of pancreatitis), and pancreatic cancer
However, these conditions are not common: even combined, they add up to less than 1 in 1000!
Therefore, it is incorrect to conclude that any of these conditions, individually or even combined, are the most common causes of EPI.
You could say, as I do in this paper, that EPI is likely more common in people with diabetes than all of these conditions combined. You’ll notice that I don’t go so far as to say it’s the MOST common, because I haven’t seen studies to support such a statement, and as I started the post by pointing out, no one has done studies looking at huge populations of EPI and the breakdown of co-conditions at a population level; instead, studies tend to focus on the population of a co-condition and prevalence of EPI within, which is a very different thing than that co-condition’s EPI population as a percentage of the overall population of people with EPI. However, there are some great studies (and I have another systematic review accepted and forthcoming on this topic!) that support the overall prevalence estimates in the general population being in the ballpark of 10+%, so there might be other ‘more common’ causes of EPI that we are currently unaware of, or it may be that most cases of EPI are uncorrelated with any particular co-condition.
—
(Need a citation? This logic is found in the introduction paragraph of a systematic review found here, of which the DOI is 10.1089/dia.2023.0157. You can also access a full author copy of it and my other papers here.)
I’ve spent enough time now collecting real-time data on air quality (via a proxy of CO2 levels) that I think it would be useful to share for other people to consider the retrospective data for THEIR decision making.
You may not want (or be able to afford) a CO2 monitor, and you may not want to mask inside all the time, but the below outlines the general scenarios in which air quality tends to be better or worse and when you would get the most benefit from situational masking in response to those situations.
(Think about situational masking indoors like you think about situational masking for smoke and poor air quality outside. Most of the time, you likely don’t mask outside. But if you’re on the east coast right now or have lived through a previous west coast US summer with a “smoke season”, you’ve probably experienced multi-day air quality outside that was so poor that you considered or did wear a high-quality (N95/K95) mask outside or limit your time exposed to that outdoor air.)
Air quality assessment via CO2 monitoring
In the last few years, Scott and I acquired two different CO2 monitors. The first was cheap, required to be plugged into a battery pack to run it, and was simply viewable on the device display. It was useful to start to get a sense for what the CO2 levels were in indoor spaces as compared to outdoor air.
Later, we decided to invest in an Aranet CO2 monitor, which runs on two AA batteries and lasts months on a single pair of batteries. You can view the data on the device display AND see a retrospective and realtime graph of the data in your phone, because it connects via Bluetooth. You can see not only CO2 but also temperature, humidity, and air pressure.
We have found this useful because CO2 is something that we all produce when we breathe out. The more we breathe out, and the more people that are breathing out, the higher the CO2 levels. The more of that air that is replaced with low-CO2 outside air, the lower the CO2 levels. Measuring the CO2 then helps us understand the ventilation (how much air is flowing through the space and how often it is being cleared out) and the risks of being in that space. A higher CO2 level means more people and/or less air being cleared out of the space, meaning you are more likely to be breathing in what someone else is breathing out.
How we evaluate CO2 levels
An outdoor CO2 level would be around ~450 ppm in urban areas, or as low as 400 ppm out in nature. Since a perfectly-ventilated space would be 100% outside air, we want to compare any indoor air CO2 reading to outdoor air.
For example, at home in our enclosed apartment with 2 people (and 2 cats), we typically run around 700 ppm, which means ~250 ppm above outdoor air levels. When we open our door or a window, it drops to ~500 ppm, or only ~50 ppm above outdoor air levels. Given that we have confirmed our air intake into our HVAC system for our apartment is outdoor air, this means the ~250 ppm we are sharing between the two of us is just our (and the cats) exhalations, rather than anyone outside our household. So those levels are acceptable to us, but our choice of interventions would change if we were sharing air with other people, especially random strangers. (Stranger danger is one way to think about air, further contextualized below with data.)
In a shared space with random strangers, your risk of COVID aerosol-based transmission is proportional to how elevated the CO2 level is above that of outside air, and the amount of time spent in that space. So a CO2 reading of 650 ppm, which is ~200 ppm over outside air, would be half as risky as a reading of 850 ppm, or ~400 ppm over outside air. And timing matters, so a 1 hour bus ride or the hour you spend boarding and waiting for takeoff on your plane when CO2 levels are highest and the air filtration (see below) is off will be of greater risk than short exposure to the same levels.
Now, we’ve also used our CO2 monitors in many other places, such as in airports and on planes and other public transportation, and other indoor shared spaces like grocery stores etc.
Here’s what we’ve learned about where CO2 levels trend (based on our repeated but n=1 testing).
Trains, buses, and rideshare (e.g. Uber, Lyft, etc) = BAD NEWS BEAR AIR
Public transportation, in every location and every country we have been in, has much higher CO2 levels.
What do I mean by much higher? Often 1000-1500 ppm easily (and sometimes >2000 ppm), which is anywhere from 500-1500 ppm above outdoor air quality.
Trains/metros/light rail where the doors are constantly opening and closing to outdoor air would seem like they would be better, but sometimes they still have (due to the density of riders) >1500 ppm.
Buses where you can’t open the window can be as high of CO2 levels as planes, without the benefit of air exchange or HEPA filtration of the air. Our recent 20 minute bus ride was up to >2500 ppm on a full bus.
Watch out for rideshares, too. Often times we get in a rideshare and the driver intentionally or accidentally has “recirc” or “recirculating air” on, meaning the air isn’t exchanged outside and the driver and riders are re-breathing each other’s air over and over and over and over again..yikes. Specifically looking at the console when you get in the car is useful: if you see the recirc button lit up, ask the driver to turn it off. If they don’t understand or refuse, or you don’t want to try to explain it, opening a window helps immensely to reduce the CO2 levels and the amount of re-breathing air. (The recirc icon usually looks like a car with a U-shaped arrow on it).
Planes (including airports, during boarding, in flight, and during landing/deplaning) = ALSO BAD NEWS BEAR AIR
Airports sometimes have better-ventilated spaces: you can often find less crowded corners of a terminal and see CO2 readings of <900 ppm. However, it’s still pretty common to be in the airport and see >1000 ppm, meaning that the CO2 is >500 ppm above outdoor air quality, and it is air from a whole assortment of random strangers coming and going, so it’s less safe than the air you’d be breathing in at home or in private spaces.
When boarding, both standing close in line with other people but also on the jet bridge and while you are on the plane, is usually even HIGHER CO2 levels than the airport. The typical air for a plane (that they tout with HEPA filters and high air exchange rates) is not turned on until you start to take off, and then it takes some time to exchange all of the air. This means there is a MUCH higher rate of re-breathing other people’s air while boarding and until you are in the air.
Now, we have measured CO2 levels during all of these times. If indoor airport air is around 900 ppm, it usually jumps to 1100-1300 on the jetbridge (if you’ve got a backed up line) and when you’re sitting on the plane watching other people board, it can go up to 2500+. And then it continues to go up as you have a full flight of people breathing in this enclosed space. During flight, we’ve seen CO2 levels hover between 1700-3000 ppm, and in some cases have gone up to ~4000 ppm. This is a lot of CO2! However, there are HEPA filters cleaning the ~half of the air that is recirculated instead of replaced. So, it’s harder to say when the airplane air systems ARE running (during most of the flight) whether the risk is as high (for infectious disease transmission) as it is in other environments that aren’t studiously exchanging and HEPA-filtering any recirculated air.
Note that when they spin down the engines after landing and all the way through taxiing, deplaning, and getting back into the airport – the CO2 level again tends to rise because they again change the air flow when they’re on the ground. So like standing in line to get on or waiting for other people to board, standing in line to get off/waiting for everyone to get off produces high CO2 levels *without the benefit of in-flight air exchange*, so it’s likely higher risk during those times than in the air during the middle of the flight, even if CO2 levels are equally high during flight.
Indoor spaces like grocery stores or conference rooms/meeting halls
Indoor spaces can vary quite a bit, and often by country or venue.
For example, most indoor spaces in the US we’ve found to often have a fairly high (e.g. 900+ ppm) indoor CO2 level, even without a huge density of people. For example, we quickly went into a grocery store the other day and the CO2 was high-800s without being around many people in the aisles, across the entire store. For not having people actively occupying the space, this is fairly high and less optimal.
In contrast, we recently were in Sweden for a conference and were honestly gobsmacked when we got off the plane and found the CO2 levels to be <600 ppm in the airport! And in the hotel lobby! And in the hotel elevator! And at the local grocery store!
(Seriously, it shocked us, because we’ve also recently been in the UK with our CO2 monitor and found US-like CO2 levels typically around 900-1000 ppm or higher, and also in Spain last year where we similarly found it to be >900 ppm even when not densely occupied. The exception to optimal air quality in Sweden was our ~20 minute bus ride where CO2 levels were >2500 ppm).
So, the CO2 levels may vary quite a bit and this is why measuring is helpful. Because you can’t assume that one country/one room means that all of the rooms in that country or even that venue will be the same.
Case in point? Conference rooms/halls or meeting rooms.
In Barcelona, Spain in April 2022, I spoke at a conference. The CO2 levels in the hallways and in the meeting room before the session started were around 800-900 ppm when not occupied. Again, a little high for not having people actively in the spaces. Then, when the conference started, Scott watched the CO2 monitor and saw it rise..and rise…and rise. Within 45 minutes, the CO2 levels were around 2000 ppm (>1500 ppm over outdoor air quality)! He went to the back of the room and opened the doors to try to get some air circulating in the room, although it didn’t make a big difference. That room did not have a high number of air exchanges per hour and was not successfully clearing out the air people were breathing out.
In Sweden (May 2023, where the CO2 was <600 in a lot of public indoor spaces), we found the same challenge in a high ceiling, large meeting hall. With 300 people, the start of the session had about 950 ppm (as opposed to the <600 ppm of less occupied hallways). Not too bad given 300 people in the space. However, by the end of the session, the CO2 level had risen to ~1350! And it continued to rise even as people had exited the room; we didn’t see a drop in CO2 levels until we went out in the hallway to continue talking to people, and it took another ~25 minutes before CO2 levels in the hallway were back down <600 ppm.
Again, we were surprised, because this venue (the hallways, lobby, elevator, etc) all had really great otherwise indoor air quality with CO2 <600 ppm!
But the challenge is the space (and the infrastructure for filtration and air exchanges); the number of people filling the space; and the amount of time, in terms of what happens to the CO2 levels.
The takeaway from this? Conference halls, meeting rooms, and anywhere where you are sitting with a group of people over a period of time is going to have a much higher CO2 level and it will increase in proportion to the time that you are occupying that space (e.g. a 30 minute or 1 hour session is going to have a much higher CO2 buildup than a 10 minute talk where the audience is turning over and leaving the room and it clears out some before the next session).
So what should you do about this information? Consider situational masking.
I really have found a CO2 monitor helpful, because even my best guesses about air quality (e.g. thinking Sweden’s conference hall would have good air quality given the size of the room and ceilings) aren’t always accurate. But if you don’t want to invest in a CO2 monitor, here’s where you can get the biggest bang for your buck with situational masking.
What do I mean by situational masking? Maybe you don’t think you’re at very high risk for COVID or other infectious illnesses, but you are interested in reducing the likelihood that you spread anything you get to other people (thanks!). But you don’t want to have to think about it, and maybe you’ve chosen previously to drop masking so you don’t have to think about it. Here’s a set of easy rules/situations in which, like learning to dump your liquids out before going through airport security, you can get into a habit of doing and not have to think about it much.
Public/shared transportation.
Riding a bus, train, metro, or a car with a stranger and especially with multiple strangers – these have high CO2 levels.
Airports, boarding a plane and during takeoff, and during descent/landing/deboarding the plane. This is when the CO2 levels are highest and the air exchanges/HEPA filtration is not running.
Think of it like the seatbelt sign. You board the plane and put your seatbelt on, then eventually once you’ve reached cruising altitude the seatbelt sign goes off. If you’re standing in a line of people (to board or deplane) OR if the seatbelt sign is ON, that’s a huge ROI for wearing a high-quality (N95 or KN95) mask. When the seatbelt sign first turns off during the flight (or you hear the 10k-feet chime) and you want to take and leave it off, or take it off a while to eat or drink – that’s less risky during those times due to the HEPA filtration and air exchanges during flight. But when the seatbelt sign goes on for the plane’s final descent? The air quality is going down, too, so putting your seatbelt AND your mask back on is a higher ROI thing to do.
(You do you inside the airport, too, but see below about density of people and temperature as a guide for whether you might want to consider situational masking in airports when you’re not eating/drinking.)
Conferences or meetings where you are sitting for more than a few minutes and there are many people in the room. Even with super big rooms and super high ceilings, so far every conference space I’ve presented in during the last several years has high CO2 levels even before the talk starts, and is even higher (>500-1000 ppm added) by the end of the session). If you’re not presenting or eating and drinking and are just sitting there listening and engaging in the session…it’s a low hassle opportunity to pop a high-quality mask on so you’re not breathing so much of the air around you from everyone else. When you’re done with the session and head out and want to socialize? Like leaving the plane, you’ll be around fewer people, and the CO2 levels (and risk) goes down. But sitting there quietly is a great time to wear a good mask and reduce your intake of other people’s exhalations.
You might find yourself in situations where the room feels hot and stuffy, or in the case of conferences and meetings, the air feels FREEZING cold. It runs freezing cold because the room gets hot and stuffy with so many people, indicating this space is not well ventilated, so they pump the AC to change the temperature. But that is a compensation for a too-low rate of air exchanges, and pre-cooling doesn’t prevent CO2 and aerosol buildup, so a room that either gets freezing cold or hot and stuffy should be a signal that the air quality likely isn’t ideal.
So a good rule of thumb is, if you’re in a space that feels hot and stuffy OR freezing cold, that’s an indicator that the air quality might be non-optimal. Consider masking in those situations even if you don’t have a CO2 monitor to evaluate the air.
It would be great if we could get 10x people to consider situational masking like this. Avoid the worst of the bad-news-bear-air of public and shared transportation and indoor spaces, which would cut down on a lot of transmission, even if people otherwise are still socializing and eating in indoor spaces and doing whatever it is they want to do. The choice to situationally mask might occasionally protect them but would also protect everyone around them in those situations when their exhalations have the greatest risk of doing the most damage.
A good way to think about it is at a conference. You might be willing to go to bars and socialize, but someone who is higher risk may be choosing not to attend those indoor dining scenarios. That’s fine: you each get to make your own choices! But when you go and sit down next to that person in a conference session, your choices then influence that person by every breath you take in that conference session.
That’s why situational masking – knowing that a situation is low-hassle to wear a high-quality mask (sitting quietly in a session) but high-risk (due to the poor air quality) means you have a high ROI to pull a mask out of your pocket/bag and throw it on – can help the people around you very effectively with little hassle and thought on your part.
You can get in the habit of masking in the bad-news-bear-air situations/locations, and you don’t have to think much about it. You’ll make things a bit safer for yourself and for the people around you, for far less hassle than avoiding buying a drink before you go through airport security because you know you need to dump liquids out.
In exocrine pancreatic insufficiency (EPI/PEI/PI), people are responsible for self-dosing their medication every time they eat something.
Doctors prescribe a starting dose, but a person with EPI determines each and every time they eat or drink something how many enzyme pills (of pancreatic enzyme replacement therapy, known as PERT) to take. Doctors often prescribe a low starting dose, and people have to try experimenting with multiple pills of the small size, and eventually work with their doctors to change their prescription to get a bigger pill size (so they can take fewer pills per meal) and the correct number of pills per day to match their needs.
For example, often people are prescribed one 10,000 unit pill per meal. The 10,000 units represents the amount of lipase (to help digest fat). There are also two other enzymes (protease, for protein digestion, and amylase, for carbohydrate digestion). They may be prescribed 1 pill per meal, which means 10,000 units of lipase per meal. But most dosing guidelines recommend starting at a dose of 40,000-50,000 units of lipase per meal (and people often need more), so it wouldn’t be surprising that someone prescribed one 10,000 pill per meal would need 4-5 pills of the 10,000 size pill PER MEAL, and times three meals per day (let alone any snacks), to get acceptable GI outcomes.
Mathematically, this means the initial prescription wouldn’t last long. The initial prescription for 1 pill per meal, with 3 meals a day, means 3 pills per day. 3 pills per day across a 30 day month is 90 pills. But when the pills per meal increase, that means the prescription won’t cover the entire month.
In fact, it would last a lot less than a month; closer to one week!
Let’s repeat: with a too-small prescription pill size (e.g. 10,000 starting dose size) and count (e.g. 3 pills per day to cover 1 per meal) and with a person with EPI titrating themselves up to the starting dose guidelines in all of the medical literature, they would run out of their prescription WITHIN ONE WEEK.
So. If you have EPI, you need to be prepared to adjust your dosing yourself; but you also need to be ready to reach out to your doctor and talk about your need for more enzymes and a changed prescription.
PERT (enzymes) come in different sizes, so one option is to ask for a bigger pill size and/or a different amount (count) per meal/day. Depending on the brand and the number of pills you need per meal, it could be simply going up to a bigger pill size. For example, if you need 3 pills of the 10,000 PERT size, you could move to a 36,000 pill size and take one per meal. If you find yourself taking 5 pills of the 10,000 PERT size, that might mean 2 pills of the 25,000 size. (Brands differ slightly, e.g. one might be 24,000 instead of 25,000, so the math may work out slightly differently depending on which brand you’re taking.)
Don’t be surprised if you need to do this within a week or two of starting PERT. In fact, based on the math above, especially if you’re on a much lower dose than starting guidelines (e.g. 40,000-50,000 units of lipase per meal), you should expect within a few days to need an updated prescription to make sure that you don’t run out of PERT.
If you do find yourself running out of PERT before you can get your prescription updated, there is an alternative you can consider: either substituting or adding on over the counter enzymes. The downsides include the fact that insurance doesn’t cover them so you would be paying out of pocket; plus there are no studies with these so you can’t (shouldn’t) rely on these as full 1:1 substitutes for prescription PERT without careful personal testing that you can do so. That being said, there is anecdotal evidence (from me, as well as hundreds of other people I’ve seen in community groups) that it is possible to use OTC enzymes if you can’t afford or can’t get a PERT prescription; or if you need to “top off”/supplement/add to your PERT because your prescription won’t last a full month and you can’t get a hold of your doctor or they won’t update your prescription.
For me, I generally evaluate the units of lipase (e.g. this kind is 17,000 units of lipase per pill) but then factor in for the lack of reliability for OTC and really treat it like it contains 13-15,000 units of lipase when choosing to take it. Similarly for another lipase-only OTC option (that has ~6,000 units per pill), I assume it acts like it only has ~5,000 units. Unlike insulin, there is little downside to taking a little too much of enzymes; but there is a LOT of downside to not taking enough, so my personal approach is that if in doubt, or on the fence, to round up (especially with OTC pills, which cost somewhere between $0.08/pill (lipase-only) to $0.34/pill (for the larger and multiple enzyme pill)).
So how do you talk to your doctor about needing more PERT?
It helps if you bring data and evidence to the conversation, especially if your doctor thinks by default that you don’t need more than what they initially prescribed. You can bring your personal data (more on that below and how to collect and present that), but you can also cite relevant medical literature to show if your dose is below standard starting guidelines.
Below I’ve shared a series of citations that show that the typical starting dose for people with EPI should be around 40,000-50,000 units of lipase per meal.
Important note that this is the STARTING DOSE SIZE, and most of these recommend further increasing of dose to 2-3 times this amount as needed. Depending on the starting dose size, you can see the chart I built below that illustrates with examples exactly how much this means one might need to increase to. Not everyone will need the upper end of the numbers, but if a doctor starts someone on 10,000 and doesn’t want to get them up to 40,000 (the lower end of starting doses) or go beyond 40,000 because it’s the starting dose, I’ve found this chart useful to show that numerically the range is a lot larger than we might assume.
Example of Titrating According to Common Dose Guidelines, Before Adding PPI
Here are some citations that back up my point about 40,000-50,000 units of lipase being the typically recommended starting dose, including across different conditions (e.g. regardless of whether you have EPI + any of (chronic pancreatitis, diabetes, celiac, etc)).
Forsmark et al, 2020, defined appropriate dose of PERT as >=120,000 units of lipase per day (e.g. 40,000 units of lipase per meal).
Whitcomb et al, 2022, in a joint American Gastroenterology Association and PancreasFest symposium paper, concur on 40,000 units as a starting dose and that “This dose should be titrated up as needed to reduce steatorrhea or gastrointestinal symptoms of maldigestion “
2021 UK guidelines for EPI management suggest 50,000 units as the starting dose and emphasize that “all guidelines endorse dose escalation if the initial dose is not effective”
There are also many guidelines and research specific for EPI and different co-conditions supporting the ballpark of 40-50,000 units of lipase starting dose:
(If you’re looking for a particular co-condition, feel free to email me (Dana@OpenAPS.org) and I’m happy to help find the most up to date research (if there is any)).
It is also worth noting that these guidelines also point out that after titrating 2-3x above the starting dose, PPI (proton pump inhibitors, to suppress acid) should be added if gastrointestinal symptoms are still not resolved. Anecdotally, it seems a lot of doctors are not aware that PPIs should be added if 3x the starting dose is not effective, so make sure to bring this up as well.
How to Share Your Personal PERT Data To Show How Much You Need
PERT Pilot lets you track how many grams of fat each pill of your current prescription has been used for, so you can see with red and green coloring the relationship between meals that you’ve had symptoms after (in red) vs. when you recorded no symptoms (green). If you have a “convergence zone” of green and red in the same area, that may help you decide to change your ratio (e.g. dose more) around that amount, until you can comfortably and repeatedly get green results (no symptoms when you eat).
How you might use this to talk to your doctor
You can take a screenshot of your PERT Pilot graph and share it with your doctor to show them how many grams of fat your prescription size (e.g. pill size) effectively “covers” for you, and how many meals that you’ve tested it with.
For example, I was initially prescribed an enzyme dose that was one pill per meal (and no snacks), so I had 3 pills per day. But I quickly found myself needing two pills per meal, based on what I was typically eating. I summarized my data to my doctor, saying that I found one pill typically covered up to ~30 grams of fat per meal, but most of my meals were >30 grams of fat, so that I wanted to update my prescription to have an average of 2 pills per meal of this prescription size. I also wanted to be able to eat snacks, so I asked for 2 pills per meal, 1 per snack, which meant that my prescription increased to 8 pills per day (of the same size), to cover 2 pills x 3 meals a day (=6) plus up to 2 snacks (=2). I also had weeks of data to show that my average meal was >30 grams of fat to confirm that I need more than the amount of lipase I was originally prescribed. My doctor was happy to increase my prescription as a result, and this is what I’ve been using successfully for over a year ever since.
So in summary, the data that would be useful to share is:
How much one pill ‘covers’ (which is where the PERT Pilot graph can be used)
How many pills per meal you’ve been taking and how big your meals typically are
Whether you are struggling with the number of pills per meal: if so, ask whether there’s a larger pill size in your current brand that you could increase to, in order to reduce the number of pills per meal (and/or snack) you need to take every time
If you are told that you shouldn’t need “that much”, remember the above section and have those resources ready to discuss that the starting dose is often 40,000-50,000 per meal and that the guidelines say to titrate up to 3x that before adding PPI. Therefore, it would be expected for some people to need upwards of 600,000 units of lipase per day (50,000 starting dose, increased 3x per meal and half of the dose used per snack). Depending on what people eat, this could be even higher (because not everyone eats the same size meal and snack and many of us adjust dose based on what we eat).
Also, it is worth noting that the dosing guidelines never mention the elastase levels or severity of EPI: so PERT prescriptions should not be based on whether you have “moderate” or “severe” EPI and what your elastase level is (e.g. whether it’s 45 or 102 or 146 or even 200, right on the line of EPI – all of those elastase levels would still get the same starting dose of PERT, based on the clinical guidelines for EPI).
It is common and you are not alone if you’ve not been giving the starting dose of PERT that the guidelines recommend.
There are numerous studies showing most people with EPI are initially underdosed/underprescribed PERT. For example, in 2020 Forsmark et al reported that only 8.5% of people with chronic pancreatitis and EPI received an adequate prescription for PERT: and only 5.5% of people with pancreatic cancer and EPI received an adequate prescription dose of PERT. Other studies in chronic pancreatitis and EPI from 2014, 2016, and 2020 report that undertreatment often occurs in EPI and CP; and I’ve found studies in other conditions as well showing undertreatment compared to guidelines, although it’s most studied in CP and cancer (which is true of all types of EPI-related research, despite the prevalence in many other conditions like diabetes, celiac, etc.).
You may need to advocate for yourself, but know that you’re not alone. Again, feel free to comment or email privately (Dana@OpenAPS.org) if you need help finding research for another co-condition and EPI that I haven’t mentioned here.
—
PS – if you haven’t seen it, I have other posts about EPI at DIYPS.org/EPI
As I have been working on adding additional features to PERT Pilot, the app I built (now available on the App Store for iOS, and here for Android users) for people like me who are living with exocrine pancreatic insufficiency, I’ve been thinking about all the things that have been challenging with managing pancreatic enzyme replacement therapy (PERT). One of those things was estimating the macronutrients – meaning grams of fat and protein and carb – in what I was eating.
I have 20+ years practice on estimating carbs, but when I was diagnosed with EPI, estimating fat and protein was challenging! I figured out methods that worked for me, but part of my PERT Pilot work has included re-thinking some of my assumptions about what is “fine” and what would be a lot better if I could improve things. And honestly, food estimation is still one of those things I wanted to improve! Not so much the accuracy (for me, after a year+ of practice I feel as though I have the hang of it), but the BURDEN of work it takes to develop those estimates. It’s a lot of work and part of the reason it feels hard to titrate PERT every single time I want to eat something.
So I thought to myself, wouldn’t it be nice if we could use AI tools to get back quick estimates of fat, protein, and carbs automatically in the app? Then we could edit them or otherwise use those estimates.
And so after getting the initial version of PERT Pilot approved and in the App Store for users to start using, I submitted another update – this time with meal estimation! It’s now been live for over a week.
Here’s how it works:
Give your meal a short title (which is not used by the AI but is used at a glance by us humans to see the meal in your list of saved meals).
Write a simple description of what you’re planning to eat. It can be short (e.g. “hot dogs”) or with a bit more detail (e.g. “two hot dogs with gluten free buns and lots of shredded cheddar cheese”). A little more detail will get you a somewhat more accurate estimates.
Hit submit, and then review the generated list of estimated counts. You can edit them if you think they’re not quite right, and then save them.
Here’s a preview of the feature as a video. I also asked friends for examples of what they’d serve if they had friends or family coming over to dinner – check out the meal descriptions and the counts the app generated for them. (This is exactly how I have been using the app when traveling and eating takeout or eating at someone’s house.)
The original intent of this was to aid people with EPI (PEI/PI) in estimating what they’re eating so they can better match the needed enzyme dosing to it. But I realized…there’s probably a lot of other people who might like a meal estimation app, too. Particularly those of us who are using carb counts to dose insulin several times a day!
I pulled the AI meal estimation idea out into a second, separate app called Carb Pilot, which is also now available on the App Store.
Carb Pilot is designed to make carb counting easier and to save a bunch of clicks for getting an estimate for what you’re eating.
What does Carb Pilot do?
Like PERT Pilot, Carb Pilot has the AI meal estimation feature. You can click the button, type your meal description (and a meal title) and get back AI-generated estimates.
You can also use voice entry and quickly, verbally describe your meal.
You can also enter/save a meal manually, if you know what the counts are, or want to make your own estimates.
Carb Pilot integrates with HealthKit, so if you want, you can enable that and save any/all of your macronutrients there. HealthKit is a great tool for then porting your data to other apps where you might want to see this data along with, say, your favorite diabetes app that contains CGM/glucose data (or for any other reason/combination).
Speaking of “any/all”, Carb Pilot is designed to be different from other food tracking apps.
As a person with diabetes, historically I *just* wanted carb counts. I didn’t want to have to sift through a zillion other numbers when I just needed ONE piece of information. If that’s true for you – whether it’s carbs, protein, calories, or fat – during onboarding you can choose which of these macronutrients you want to display.
Just want to see carbs? That’s the default, and then in the saved meals you’ll ONLY see the carb info! If you change your mind, you can always change this in the Settings menu, and then the additional macronutrients will be displayed again.
It’s been really fun to build out Carb Pilot. Scott has been my tester for it, and interestingly, he’s turned into a super user of Carb Pilot because, in his words, “it’s so easy to use” and to generate macronutrient estimates for what he’s eating. (His use case isn’t for dosing medicine but matching what he’s eating against his energy expenditure for how much exercise/activity he’s been doing.) He’s been using it and giving me feedback and feature requests – I ended up building the voice-entry feature much more quickly than I expected because he was very interested in using it, which has been great! He also requested the ability to display meals in reverse chronological order and to be able to copy a previous meal to repeat it on another day (swipe on a meal and you can copy the description if you want to tweak and use it again, or simply repeat the meal as-is). We also discovered that it supports multiple languages as input for the AI meal estimation feature. How? Well, we were eating outside at a restaurant in Sweden and Scott copied and pasted the entree description from the menu – in Swedish – into Carb Pilot. It returned the counts for the meal, exactly as if he had entered them in English (our default language)!
I’m pointing this out because if you give Carb Pilot a try and have an idea for a feature/wish you could change the app in some way, I would LOVE for you to email me and tell me about it. I have a few other improvements I’m already planning to add but I’d love to make this as useful to as many people who would find this type of app helpful.
TLDR:
– PERT Pilot has been updated to include the new meal estimation feature!
– People without EPI can use Carb Pilot for carb, protein, fat, and/or calorie tracking (of just one or any selection of those) tracking, also using the new AI meal estimation features!
Introducing PERT Pilot, the first iOS app designed for people with exocrine pancreatic insufficiency (EPI / PEI) and the only iOS app for specifically recording pancreatic enzyme replacement therapy (PERT) dosing!
But, that still isn’t the most user-friendly way to enable people to do this.
What else could I do, though? I wasn’t sure.
More recently, though, I have been experimenting with various projects and using ‘large language model’ (LLM) tools like GPT-4 to work on various projects. And a few weeks ago I realized that maybe I could *try* to build an iOS app version of my idea. I wanted something to help people log what they are eating, record their PERT dosing, and more easily see the relationship in what they are eating and what enzymes they are dosing. This would enable them to use that information to more easily adjust what they are dosing for future meals if they’re not (yet) satisfied with their outcomes.
PERT Pilot is designed to help people living with Exocrine Pancreatic Insufficiency (EPI or PEI) more easily deal with pancreatic enzyme replacement therapy (PERT). Aka, “taking enzymes”.
PERT Pilot enables you to log the PERT that you are taking along with a meal, how many pills you take for it, and whether this dosing seems to work for you or not. You can also edit this any time and add any symptoms you may experience after the meal.
Don’t know what your meal is? You can put in a plain language description to the AI meal estimation feature and get back estimates for “a plate of spaghetti” or “two chicken breasts with vegetables” or “two gluten free hot dogs with buns” (or anything else that you eat or drink!).
PERT Pilot then shows you the relationship between how much PERT you have been taking and what you are eating, supporting you as you fine-tune your enzyme intake.
PERT Pilot enables you to share what’s working – and what might not be working – with your healthcare provider. PERT Pilot not only lists every meal you’ve entered, but also has a visual graph so you can see each meal and how much fat and protein from each meal were dosed by one pill – and it’s color coded by the outcome you assigned that meal! Green means you said that meal’s dosing “worked”; orange means you were “unsure”, and red matches the meals you said “didn’t work” for that level of dosing.
You can press on any meal and edit it, and you can swipe to delete a meal.
You can also use the EPI/PEI-SS to track your symptoms over time, recording the frequency and severity, to help you gauge overall progress with EPI symptom management and understanding if your enzyme dosing is working and helping you reduce your symptoms.
Why use PERT Pilot if you have EPI or PEI or PI?
PERT Pilot is the first and only specific app for those of us living with EPI (PEI or PI). People who use the approach in PERT Pilot of adapting their PERT dosing to what they are eating for each meal or snack often report fewer symptoms. PERT Pilot was designed and built by someone with exocrine pancreatic insufficiency, just like you!
With PERT Pilot you can:
Log your meals and PERT dosing. No other app specifically is designed for PERT dosing.
Edit or adjust your meal entry at any time – including if you wake up the next morning and realize your last dose from the day before ‘didn’t work’.
Review your dosing and see all of your meals, dosing, and outcomes – including a visual graph that shows you, for each meal, what one pill ‘covered’ so you can see where there are clusters of dosing that worked and if there are any clear patterns in what didn’t work for you.
You can also export your data if you want to analyze your data elsewhere, or share it with your doctor.
Your data is your data, period. No one has access to your dosing data, symptom data, or outcome data, and nothing you enter into PERT Pilot leaves your device – unless you decide to export your data or share your anonymized EPI/PEI-SS symptom data. No identifying information is ever collected in the app. (See more in the PERT Pilot Privacy Policy.)
Note: this app was not funded by nor has any relationship to any pharmaceutical or medical-related companies. It’s simply built by a person with EPI for other people with EPI.
Here is a quick demonstration of PERT Pilot in action:
You can share your feedback about PERT Pilot:
Feel free to email me (Dana+PERTPilot@OpenAPS.org) any time.
I’d love to hear what works or is helpful, but also if something in the app isn’t yet working as expected.
And, you can share your feature requests! I’m planning to build more features soon (see below).
You’ve probably heard about new AI (artificial intelligence) tools like ChatGPT, Bard, Midjourney, DALL-E and others. But, what are they good for?
Last fall I started experimenting with them. I looked at AI art tools and found them to be challenging, at the time, for one of my purposes, which was creating characters and illustrating a storyline with consistent characters for some of my children’s books. I also tested GPT-3 (meaning version 3.0 of GPT). It wasn’t that great, to be honest. But later, GPT-3.5 was released, along with the ChatGPT chat interface to it, which WAS a big improvement for a lot of my use cases. (And now, GPT-4 is out and is an even bigger improvement, although it costs more to use. More on the cost differences below)
So what am I using these AI tools for? And how might YOU use some of these AI tools? And what are the limitations? This is what I’ve learned:
The most frequent way I use these AI tools is for getting started on a project, especially those related to writing.
You know the feeling of staring at a blank page and not knowing where to start? Maybe it’s the blank page of a cold email; the blank page of an essay or paper you need to write; the blank page of the outline for a presentation. Starting is hard!
Even for this blog post, I had a list of bulleted notes of things I wanted to remember to include. But I wasn’t sure how I wanted to start the blog post or incorporate them. I stuck the notes in ChatGPT and asked it to expand the notes.
What did it do? It wrote a few paragraph summary. Which isn’t what I wanted, so I asked it again to use the notes and this time “expand each bullet into a few sentences, rather than summarizing”. With these clear directions, it did, and I was able to look at this content and decide what I wanted to edit, include, or remove.
Sometimes I’m stuck on a particular writing task, and I use ChatGPT to break it down. In addition to kick-starting any type of writing overall, I’ve asked it to:
Take an outline of notes and summarize them into an introduction; limitations section; discussion section; conclusion; one paragraph summary; etc.
Take a bullet point list of notes and write full, complete sentences.
Take a long list of notes I’ve written about data I’ve extracted from a systematic review I was working on, and ask it about recurring themes or outlier concepts. Especially when I had 20 pages (!) of hand-written notes in bullets with some loose organization by section, I could feed in chunks of content and get help getting the big picture from that 20 pages of content I had created. It can highlight themes in the data based on the written narratives around the data.
A lot of times, the best thing it does is it prompts my brain to say “that’s not correct! It should be talking about…” and I’m able to more easily write the content that was in the back of my brain all along. I probably use 5% of what it’s written, and more frequently use it as a springboard for my writing. That might be unique to how I’m using it, though, and other simple use cases such as writing an email to someone or other simplistic content tasks may mean you can keep 90% or more of the content to use.
2. It can also help analyze data (caution alert!) if you understand how the tools work.
Huge learning moment here: these tools are called LLMs (large language models). They are trained on large amounts of language. They’re essentially designed so that, based on all of those words (language) it’s taken in previously, to predict content that “sounds” like what would come after a given prompt. So if you ask it to write a song or a haiku, it “knows” what a song or a haiku “looks” like, and can generate words to match those patterns.
It’s essentially a PATTERN MATCHER on WORDS. Yeah, I’m yelling in all caps here because this is the biggest confusion I see. ChatGPT or most of these LLMs don’t have access to the internet; they’re not looking up in a search engine for an answer. If you ask it a question about a person, it’s going to give you an answer (because it knows what this type of answer “sounds” like), but depending on the amount of information it “remembers”, some may be accurate and some may be 100% made up.
Why am I explaining this? Remember the above section where I highlighted how it can start to sense themes in the data? It’s not answering solely based on the raw data; it’s not doing analysis of the data, but mostly of the words surrounding the data. For example, you can paste in data (from a spreadsheet) and ask it questions. I did that once, pasting in some data from a pivot table and asking it the same question I had asked myself in analyzing the data. It gave me the same sense of the data that I had based on my own analysis, then pointed out it was only qualitative analysis and that I should also do quantitative statistical analysis. So I asked it if it could do quantitative statistical analysis. It said yes, it could, and spit out some numbers and described the methods of quantitative statistical analysis.
But here’s the thing: those numbers were completely made up!
It can’t actually use (in its current design) the methods it was describing verbally, and instead made up numbers that ‘sounded’ right.
So I asked it to describe how to do that statistical method in Google Sheets. It provided the formula and instructions; I did that analysis myself; and confirmed that the numbers it had given me were 100% made up.
The takeaway here is: it outright said it could do a thing (quantitative statistical analysis) that it can’t do. It’s like a human in some regards: some humans will lie or fudge and make stuff up when you talk to them. It’s helpful to be aware and query whether someone has relevant expertise, what their motivations are, etc. in determining whether or not to use their advice/input on something. The same should go for these AI tools! Knowing this is an LLM and it’s going to pattern match on language helps you pinpoint when it’s going to be prone to making stuff up. Humans are especially likely to make something up that sounds plausible in situations where they’re “expected” to know the answer. LLMs are in that situation all the time: sometimes they actually do know an answer, sometimes they have a good guess, and sometimes they’re just pattern matching and coming up with something that sounds plausible.
In short:
LLM’s can expand general concepts and write language about what is generally well known based on its training data.
Try to ask it a particular fact, though, and it’s probably going to make stuff up, whether that’s about a person or a concept – you need to fact check it elsewhere.
It can’t do math!
But what it can do is teach you or show you how to do the math, the coding, or whatever thing you wish it would do for you. And this gets into one of my favorite use cases for it.
3. You can get an LLM to teach you how to use new tools, solve problems, and lower the barrier to entry (and friction) on using new tools, languages, and software.
It’s now so easy to generate code for scripts, regardless of which language you have previous experience with. I used to write all of my code as bash scripts, because that’s the format I was most familiar with. But ChatGPT likes to do things as Python scripts, so I asked it simple questions like “how do I call a python script from the command line” after I asked it to write a script and it generated a python script. Sure, you could search in a search engine or Stack Overflow for similar questions and get the same information. But one nice thing is that if you have it generate a script and then ask it step by step how to run a script, it gives you step by step instructions in context of what you were doing. So instead of saying “to run a script, type `python script.py’”, using placeholder names, it’ll say “to run the script, use ‘python actual-name-of-the-script-it-built-you.py’ “ and you can click the button to copy that, paste it in, and hit enter. It saves a lot of time for figuring out how to take placeholder information (which you would get from a traditional search engine result or Stack Overflow, where people are fond of things like saying FOOBAR and you have no idea if that means something or is meant to be a placeholder). Careful observers will notice that the latest scripts I’ve added to my Open Humans Data Tools repository (which is packed with a bunch of scripts to help work with big datasets!) are now in Python rather than bash; such as when I was adding new scripts for fellow researchers looking to check for updates in big datasets (such as the OpenAPS Data Commons). This is because I used GPT to help with those scripts!
It’s really easy now to go from an idea to a script. If you’re able to describe it logically, you can ask it to write a script, tell you how to run it, and help you debug it. Sometimes you can start by asking it a question, such as “Is it possible to do Y?” and it describes a method. You need to test the method or check for it elsewhere, but things like uploading a list of DOIs to Mendeley to save me hundreds of clicks? I didn’t realize Mendeley had an API or that I could write a script that would do that! ChatGPT helped me write the script, figure out how to create a developer account and app access information for Mendeley, and debug along the way so I ended up within an hour and a half of having a tool that easily saved me 3 hours on the very first project that I used it with.
I’m gushing about this because there’s probably a lot of ideas you have that you immediately throw out as being too hard, or you don’t know how to do it. It takes time, but I’m learning to remember to think “I should ask the LLM this” and ask it questions such as:
Is it possible to do X?
Write a script to do X.
I have X data. Pretend I am someone who doesn’t know how to use Y software and explain how I should do Z.
Another thing I’ve done frequently is ask it to help me quickly write a complex formula to use in a spreadsheet. Such as “write a formula that can be used in Google Sheets to take an average of the values in M3:M84 if they are greater than zero”.
It gives me the formula, and also describes it, and in some cases, gives alternative options.
Other things I’ve done with spreadsheets include:
Ask it to write a conditional formatting custom formula, then give me instructions for expanding the conditional formatting to apply to a certain cell range.
Asking it to check if a cell is filled with a particular value and then repeating the value in the new cell, in order to create new data series to use in particular charts and graphs I wanted to create from my data.
Help me transform my data so I could generate a box and whisker plot.
Ask it for other visuals that might be effective ways to illustrate and visualize the same dataset.
Explain the difference between two similar formulas (e.g. COUNT and COUNTA or when to use IF and IFS).
This has been incredibly helpful especially with some of my self-tracked datasets (particularly around thyroid-related symptom data) where I’m still trying to figure out the relationship between thyroid levels, thyroid antibody levels, and symptom data (and things like menstrual cycle timing). I’ve used it for creating the formulas and solutions I’ve talked about in projects such as the one where I created a “today” line that dynamically updates in a chart.
It’s also helped me get past the friction of setting up new tools. Case in point, Jupyter notebooks. I’ve used them in the web browser version before, but often had issues running the notebooks people gave me. I debugged and did all kinds of troubleshooting, but have not for years been able to get it successfully installed locally on (multiple of) my computers. I had finally given up on effectively using notebooks and definitely given up on running it locally on my machine.
However, I decided to see if I could get ChatGPT to coax me through the install process.
I told it:
“I have this table with data. Pretend I am someone who has never used R before. Tell me, step by step, how to use a Jupyter notebook to generate a box and whisker plot using this data”
(and I pasted my data that I had copied from a spreadsheet, then hit enter).
It outlined exactly what I needed to do, saying to install Jupyter Notebook locally if I hadn’t, gave me code to do that, installing the R kernel, told me how to do that, then how to start a notebook all the way down to what code to put in the notebook, the data transformed that I could copy/paste, and all the code that generated the plot.
However, remember I have never been able to successfully get Jupyter Notebooks running! For years! I was stuck on step 2, installing R. I said:
“Step 2, explain to me how I enter those commands in R? Do I do this in Terminal?”
It said “Oh apologies, no, you run those commands elsewhere, preferably in Rstudio. Here is how to download RStudio and run the commands”.
So, like humans often do, it glossed over a crucial step. But it went back and explained it to me and kept giving more detailed instructions and helping me debug various errors. After 5-6 more troubleshooting steps, it worked! And I was able to open Jupyter Notebooks locally and get it working!
All along, most of the tutorials I had been reading had skipped or glossed over that I needed to do something with R, and where that was. Probably because most people writing the tutorials are already data scientists who have worked with R and RStudio etc, so they didn’t know those dependencies were baked in! Using ChatGPT helped me be able to put in every error message or every place I got stuck, and it coached me through each spot (with no judgment or impatience). It was great!
I was then able to continue with the other steps of getting my data transformed, into the notebook, running the code, and generating my first ever box and whisker plot with R!
This is where I really saw the power of these tools, reducing the friction of trying something new (a tool, a piece of software, a new method, a new language, etc.) and helping you troubleshoot patiently step by step.
Does it sometimes skip steps or give you solutions that don’t work? Yes. But it’s still a LOT faster than manually debugging, trying to find someone to help, or spending hours in a search engine or Stack Overflow trying to translate generic code/advice/solutions into something that works on your setup. The beauty of these tools is you can simply paste in the error message and it goes “oh, sorry, try this to solve that error”.
Because the barrier to entry is so low (compared to before), I’ve also asked it to help me with other project ideas where I previously didn’t want to spend the time needed to learn new software and languages and all the nuances of getting from start to end of a project.
Such as, building an iOS app by myself.
I have a ton of projects where I want to temporarily track certain types of data for a short period of time. My fall back is usually a spreadsheet on my phone, but it’s not always easy to quickly enter data on a spreadsheet on your phone, even if you set up a template with a drop down menu like I’ve done in the past (for my DIY macronutrient tool, for example). For example, I want to see if there’s a correlation in my blood pressure at different times and patterns of inflammation in my eyelid and heart rate symptoms (which are symptoms, for me, of thyroid antibodies being out of range, due to Graves’ disease). That means I need to track my symptom data, but also now some blood pressure data. I want to be able to put these datasets together easily, which I can, but the hardest part (so to speak) is finding a way that I am willing to record my blood pressure data. I don’t want to use an existing BP tracking app, and I don’t want a connected BP monitor, and I don’t want to use Apple Health. (Yes, I’m picky!)
I decided to ask ChatGPT to help me accomplish this. I told it:
“You’re an AI programming assistant. Help me write a basic iOS app using Swift UI. The goal is a simple blood pressure tracking app. I want the user interface to default to the data entry screen where there should be three boxes to take the systolic, diastolic blood pressure numbers and also the pulse. There should also be selection boxes to indicate whether the BP was taken sitting up or laying down. Also, enable the selection of a section of symptom check boxes that include “HR feeling” and “Eyes”. Once entered on this screen, the data should save to a google spreadsheet.”
This is a completely custom, DIY, n of 1 app. I don’t care about it working for anyone else, I simply want to be able to enter my blood pressure, pulse, whether I’m sitting or laying down, and the two specific, unique to me symptoms I’m trying to analyze alongside the BP data.
And it helped me build this! It taught me how to set up a new SwiftUI project in XCode, gave me code for the user interface, how to set up an API with Google Sheets, write code to save the data to Sheets, and get the app to run.
(I am still debugging the connection to Google Sheets, so in the interim I changed my mind and had it create another screen to display the stored data then enable it to email me a CSV file, because it’s so easy to write scripts or formulas to take data from two sources and append it together!)
Is it fancy? No. Am I going to try to distribute it? No. It’s meeting a custom need to enable me to collect specific data super easily over a short period of time in a way that my previous tools did not enable.
Here’s a preview of my custom app running in a simulator phone:
I did this in a few hours, rather than taking days or weeks. And now, the barrier to entry to creating more custom iOS is reduced, because now I’m more comfortable working with XCode and the file structures and what it takes to build and deploy an app! Sure, again, I could have learned to do this in other ways, but the learning curve is drastically shortened and it takes away most of the ‘getting started’ friction.
That’s the theme across all of these projects:
Barriers to entry are lower and it’s easier to get started
It’s easier to try things, even if they flop
There’s a quicker learning curve on new tools, technologies and languages
You get customized support and troubleshooting without having to translate through as many generic placeholders
PS – speaking of iOS apps, based on building this one simple app I had the confidence to try building a really complex, novel app that has never existed in the world before! It’s for people with exocrine pancreatic insufficiency like me who want to log pancreatic enzyme replacement therapy (PERT) dosing and improve their outcomes – check out PERT Pilot and how I built it here.
4. Notes about what these tools cost
I found ChatGPT useful for writing projects in terms of getting started, even though the content wasn’t that great (on GPT-3.5, too). Then they came out with GPT-4 and made a ChatGPT Pro option for $20/month. I didn’t think it was worth it and resisted it. Then I finally decided to try it, because some of the more sophisticated use cases I wanted to use it for required a longer context window, and in addition to a better model it also gave you a longer context window. I paid the first $20 assuming I’d want to cancel it by the end of the month.
Nope.
The $20 has been worth it on every single project that I’ve used it for. I’ve easily saved 5x that on most projects in terms of reducing the energy needed to start a project, whether it was writing or developing code. It has saved 10x that in time cost recouped from debugging new code and tools.
GPT-4 does have caps, though, so even with the $20/month, you can only do 25 messages every 3 hours. I try to be cognizant of which projects I default to using GPT-3.5 on (unlimited) versus saving the more sophisticated projects for my GPT-4 quota.
For example, I saw a new tool someone had built called “AutoResearcher”, downloaded it, and tried to use it. I ran into a bug and pasted the error into GPT-3.5 and got help figuring out where the problem was. Then I decided I wanted to add a feature to output to a text file, and it helped me quickly edit the code to do that, and I PR’ed it back in and it was accepted (woohoo) and now everyone using that tool can use that feature. That was pretty simple and I was able to use GPT-3.5 for that. But sometimes, when I need a larger context window for a more sophisticated or content-heavy project, I start with GPT-4. When I run into the cap, it tells me when my next window opens up (3 hours after I started using it), and I usually have an hour or two until then. I can open a new chat on GPT-3.5 (without the same context) and try to do things there; switch to another project; or come back at the time it says to continue using GPT-4 on that context/setup.
Why the limit? Because it’s a more expensive model. So you have a tradeoff between paying more and having a limit on how much you can use it, because of the cost to the company.
—–
TLDR:
Most important note: LLMs don’t “think” or “know” things the way humans do. They output language they predict you want to see, based on its training and the inputs you give it. It’s like the autocomplete of a sentence in your email, but more words on a wider range of topics!
Also, the LLM can’t do math. But they can write code. Including code to do math.
(Some, but not all, LLMs have access to the internet to look up or incorporate facts; make sure you know which LLM you are using and whether it has this feature or not.)
Ways to get started:
The most frequent way I use these AI tools is for getting started on a project, especially those related to writing.
Ask it to help you expand on notes; write summaries of existing content; or write sections of content based on instructions you give it
It can also help analyze data (caution alert!) if you understand the limitations of the LLM.
The most effective way to work with data is to have it tell you how to run things in analytical software, whether that’s how to use R or a spreadsheet or other software for data analysis. Remember the LLM can’t do math, but it can write code so you can then do the math!
You can get an LLM to teach you how to use new tools, solve problems, and lower the barrier to entry (and friction) on using new tools, languages, and software.
Build a new habit of asking it “Can I do X” or “Is it possible to do Y” and when it says it’s possible, give it a try! Tell it to give you step-by-step instructions. Tell it where you get stuck. Give it your error messages or where you get lost and have it coach you through the process.
—
What’s been your favorite way to use an LLM? I’d love to know other ways I should be using them, so please drop a comment with your favorite projects/ways of using them!
I’ve been training for a big goal of mine: running a 100k in a specific amount of time. Yes, I’ve run farther than that before: last year I ran ~82 miles. However, I had someone in my family network who ran 100k last year, and I realized their time made a reasonable goal for me. I’m competitive, so the extra motivation of striving for a certain time is helpful for channeling my “racing”, even if I’m “racing” someone virtually (who ran a year ago!).
Like last year, I decided I would run my 100k (which is 62+ miles) as a solo or DIY ultramarathon. I originally plotted five laps of various lengths, then figured out I could slightly alter my longest route by almost a mile, making it so I would do 2 laps of the same length, a third lap of my original longest length, and then a fourth lap of a shorter length that’s also one of my preferred running routes. Only four laps would be mentally easier than doing five laps, even though it would end up being exactly the same distance. Like last year, I leveraged extensive planning (most of it done last year) to plan my electrolytes, enzymes, and fueling in advance. I had a lot less work to do this year, because I simply refreshed the list of gear and prep work from last year, shortened of course to match the length of my expected race (less than 18 hours vs ~24+ hours). The main thing I changed in terms of preparation is that while I set out a few “just in case” supplies, most of them I left in their places, figuring they’d be easy enough to find in the house by Scott (my husband) if I needed to ask him to bring out anything in particular. The few things I laid out were emergency medical supplies like inhaled insulin, inhaled glucagon, a backup pump site, etc. And my usual piles of supplies – clothes, fuel to refill my vest, etc – for each lap.
One thing that was different for my 100k was my training. Last year, I was coming back from a broken toe and focused on rebuilding my feet. I found that I needed to stick with three runs per week. This year, I was back up to 4-5 runs per week and building up my long runs beginning in January, but in early February I felt like my left shin was getting niggle-y and I backed down to 3 runs a week. Plus, I was also more active on the weekends, including most weekends where we were cross-country skiing twice, often covering 10-15 miles between two days of skiing, so I was getting 3+ extra hours of “time on legs”, albeit differently than running. Instead of just keeping one longer run, a medium run, and two shorter runs (my original plan), I shifted to one long run, one medium long run (originally 8 and then jumping to 13 miles because it matched my favorite route), and the big difference was making my third run about 8 miles, too. This meant that I carried my vest and fueled for all three runs, rather than just one or two runs per week. I think the extra time training with the weight of my vest paid off, and the miles I didn’t do or the days I didn’t run didn’t seem to make a difference in regard to recovering during the weeks of training or for the big run itself. Plus, I practiced fueling every week for every run.
I also tapered differently. Once I switched to three runs a week, my shin felt a lot better. However, in addition to cross country skiing, Scott and I also have access now to an outdoor rock climbing wall (so fun!) and have been doing that. It’s a different type of workout and also helps with full body and upper body strength, while being fun and not feeling like a workout. I bring it up mostly because three weeks ago, I think I hurt the inside of my hip socket somehow by pressing off a foothold at a weird angle, and my hip started to be painful. It was mostly ok running, but I backed off my running schedule and did fewer miles for a week. The following week I was supposed to do my last longest long run – but I felt like it wouldn’t be ideal to do with my hip still feeling intermittently sore. Sometimes it felt uncomfortable running, other times it didn’t, but it didn’t feel fully back to normal. I decided to skip the last long run and stick with a week of my medium run length (I did 13, 13, and 8). That felt mostly good, and it occurred to me that two shorter weeks in a row were essentially a taper. If I didn’t feel like one more super long run (originally somewhere just under a 50k) was necessary to prepare, then I might as well consider moving my ‘race’ up. This is a big benefit of DIY’ing it, being able to adjust to injury or schedule – or the weather! The weather was also forecasted to be REALLY nice – no rain, high 50s F, and so I tentatively aimed to do a few short runs the following week with my 100k on the best weather day of the weekend. Or if the weather didn’t work out, I could push it out another week and stick with my original plan.
My taper continued to evolve, with me running 4 easy miles on Monday (without my vest) to see how my hip felt. Mostly better, but it still occasionally niggled when walking or running, which made me nervous. I discussed this endlessly with Scott, who as usual thought I was overcomplicating it and that I didn’t need to run more that week before my 100k. I didn’t like the idea of running Monday, then not running again until (Friday-Sunday, whenever it ended up being), but a friend unexpectedly was in town and free on Wednesday morning, so I went for a walk outside with her and that made it easy to choose not to run! It was going to be what it was going to be, and my hip would either let me run 100k or it would let me know to make it a regular long run day and I could stop at any time.
So – my training wasn’t ideal (shifting down to 3 runs a week) and my taper was very unexpected and evolved differently than it usually does, but listening to my body avoided major injury and I woke up feeling excited and with a good weather forecast for Friday morning, so I set off at 6am for my 100k.
(Why 6am start, if I was DIYing? My goal was to finish by 11:45pm, to beat the goal time of 11:46pm, which would have been 17 hours and 46 minutes. I could start later but that would involve more hours of running at night and keeping Scott awake longer, so I traded for an hour of running before it got light and finishing around midnight for a closer to normal bedtime for us both.)
*One other major thing I did to prep was that as soon as I identified that I wanted to shift my race up a week, I went in and started scheduling my bedtimes, beginning with the night before the race. If I raced at 6 from home, I would wake up at 5 to get ready, so I wanted to be sleeping by 9pm at the latest in order to get close to a normal night of sleep. Ideally it would be closer to 8-8:30. I set my bed time and each night prior, marked the bedtime 15 minutes later, so that when I started I was trying to push my bedtime from ~11pm to 10:45 pm then the next night 10:30pm etc. It wasn’t always super precise – I’ve done a better job achieving the goal bedtimes previously, but given that I did an early morning cross country ski race on the morning of daylight saving time the week before (ouch), it went pretty ok, and I woke up at 5am on race morning feeling rested and better than I usually do on race days. 7 hours and 45 minutes of sleep is an hour to an hour and a half less than usual, but it’s a LOT better than the 4-5 hours of sleep I might have otherwise gotten without shifting my schedule.
THE START (MILES 0-17)
I set out at 6am, It was 33 degrees (F), so I wore shorts and a short sleeve shirt, with a pair of fleece lined pants over my shorts and a long sleeve shirt, rain jacket, ear cover, and gloves on my hand. It was dry, which helped. I was the only one out on the trail in the dark, and I had a really bright waist lamp and was running on a paved trail, so I didn’t have issues seeing or running. I felt a bit chilly but within 3 minutes could tell I would be fine temperature wise. As I got on the trail, I glanced up and grinned – the stars were out! That meant I could “check” something off my experience list at the very start. (I make a list of positive and less great experiences to ‘check off’ mentally, everything from seeing the stars or seeing bunnies or other wildlife to things like blisters, chafing, or being cold or tired or having out of whack glucose levels – to help me process and “check them off” my list and move on after problem solving, rather than dwelling on them and getting myself into a negative mood). The other thing I chuckled about at the start was passing the point where, about a half mile in to my 82 miles, I had popped the bite valve off of my hydration hose and gotten water everywhere and couldn’t find the bite valve for 3 minutes. That didn’t happen this time, phew! So this run was already off to a great start, just by nothing wild like that happening within the first few minutes. I peeled off my ear cover at 0.75 miles and my gloves at a mile. My jacket then peeled off to tie around my waist by the second mile, and I was surprised when my alarm went off at 6:30am reminding me to take in my first fuel. My plan calls for fuel every 30 minutes, which is why I like starting at the top of the hour (e.g. 6:00am) so I can use the alarm function on my phone to have alarms pre-set for the clock times when I need to fuel. As I continued my run/walk, just like I do in all my training runs, I pulled my enzymes out of my left pocket, swallowed them, put them away, grabbed my fuel out of my right pocket (starting with chili cheese Fritos), then also entered it into my fuel tracking spreadsheet so I could keep an eye on rolling calorie and sodium consumption throughout my run. (Plus, Scott can also see it and keep an eye on it as an extra data point that I’m doing well and following all planned activities, as well as having live GPS tracking and glucose tracking capabilities). I carried on, and as the sky began to lighten, I could see frost covering the ground beside the trail – brrr! It actually felt a little bit colder as the sun rose, and I could see wafts of fog rolling along the river. I started to see more people out for early morning runs, and I checked my usual irritation at people who were likely only out for (3? 5? 10? Psh!) short morning runs while I was just beginning an all day slog.
I was running well and a little ahead of my expected pace, closer to my usual long run/walk paces (which have been around 14:30-14:50 min/mi lately). I was concerned it was too fast and I would burn out as so many people do, but I did have wiggle room in my paces and had planned for an eventual slow down regardless. I made it to the first turnaround, used the trail bathroom there, and continued on, noting that even with the bathroom stop factored in, I was still on or ahead of schedule. I texted Scott to let him know to check my paces earlier than he might otherwise, and also stopped in my tracks to take a picture of a quail-like bird (which Scott thinks was a pheasant) that I’d never seen before. Lap 1 continued well, and I was feeling good and maintaining an overall sub-15 pace while I had been planning for a 15:10/ish average pace, so although Scott told me he didn’t need me to warn him about being particular miles away for aid station stops, I saw he was still at home by the time I was less than a mile out, and texted him. He was finishing a work call and had to rush to finish packing and come meet me. It wouldn’t have been a big deal if he had “missed” me at the expected turnaround spot, because there’s other benches and places where we could have met after that, but I think he was still stressed out (sorry!) about it, although I wasn’t. However, he biked up to me right at the turnaround spot, grabbed my vest and headed back to our normal table for refueling, while I used the bathroom and then headed out to meet him.
The other thing that might have stressed him out a little – and did stress me out a little bit – was my glucose levels. They were running normal levels for me during a run, around ~150mg/dL in the first 2-3 hours of my run. This is higher than I normally like to be for non-running times but is reasonable for long runs. I usually run a bit higher at the start and then settle in around 120-130mg/dL, because the risk of having too much insulin at the start from breakfast is prone to causing lows in the first hour; therefore I let myself reduce insulin prior to the run so that the first hour or so runs higher. However, instead of coming down as usual from the start of my run, I started a steady rise from 150 to 180. That was weird, but maybe it was a physiological response to the stress? I issued a correction, but I kept rising. I crossed 200 when I should have been beginning to flatten, and it kept going. What on earth? I idly passed my hand over my abdomen to check my pump site, and couldn’t feel my pump site. It had come unclipped!!! This was super frustrating, because it means I didn’t know how much insulin was in my body or when it had come unclipped. (Noteworthy that in 20+ years of using an insulin pump, this has NEVER happened before until this month, and it has now happened twice, so I need to record the batch/lot numbers and report it – this batch of sites is easily coming unclipped with a tug on the tubing, which is clearly dangerous because you can’t feel it come unclipped and don’t know until you see rising glucose levels.) “Luckily” though, this was when I was within 30 minutes or so of being back to Scott, so I texted him and told him to grab the inhaled insulin baggie I had set out, and I would use that at the aid station to more quickly get my body back into a good state (both in terms of feeling the insulin action as well as normalizing glucose levels more quickly. For those who don’t know, injected/pump insulin takes ~45 minutes to peak activity in the body, whereas inhaled insulin is much faster in the ballpark of ~15-20 minutes peak action, so in situations like this I prefer to, when possible, use inhaled insulin to normalize how my body is feeling while also resuming/fixing the pump site for normal insulin from then on).
As planned, at every aid station stop he brought water and ice to refill my camelback, which he did while I was at the bathroom. When I came up to the table where he was, I quickly did some inhaled insulin. Then I sat down and took off my socks and shoes and inspected my feet. My right foot felt like it had been rubbing on the outside slightly, so I added a piece of kinesiology tape to the outer edge of my foot. I already had pieces on the bottom of my feet to help prevent blisters like I got during my 82, and those seemed to be working, and it was quick and easy to add a straight piece of tape, re-stick pieces of lamb’s wool next to each big toe (to prevent blisters there), put fresh socks on, and put a fresh pair of shoes on. I also changed my shirts. It was now 44 F and it was supposed to warm up to 61 F by the end of this next lap. I stood up to put my pack on again and realized I had forgotten to peel off my pants! Argh. I had to unlace my shoes again, which was the most annoying part of my stop. I peeled off the pants (still wearing my shorts under), put my shoes back on and laced them again, then put my vest back on. I removed the remaining trash from my vest pockets, pulled out the old enzyme and electrolyte baggies, and began to put the new fuel supply and enzyme and electrolyte supply in the front vest pockets. Last time for my 82, I had Scott do the refilling of my vest, but this time I just had him set out my gallon bag that contained all of these, so that I could place the snacks how I like best and also have an idea of what I had for that lap. I would need to double check that I had enzymes and electrolytes, anyway, so it ended up being easier for me to do this and I think I’ll keep doing this moving forward. Oh, and at each aid station stop we popped my (non-ultra) Apple Watch on a watch charger to top off the charge, too. I also swapped in a new mini battery to my pack to help keep my phone battery up, and then took off. All this, including the bathroom time, took about 15 minutes! I had budgeted 20 minutes for each stop, and I was pleased that this first stop was ahead of schedule in addition to my running slightly ahead of schedule, because that gave me extra buffer if I slowed down later.
A 24 hour view of my CGM graph to show my glucose levels before (overnight), during the run including marks where my pump site likely unclipped, where I reclipped it, and how my glucose was in range for the remainder of the run.
LAP 2 (MILES 18-34)
The next lap was the same route as the first, and felt like a normal long run day. It was mid 40s and gradually warmed up to 63 F and actually felt hot for the second half! It hadn’t been 60+ degrees in Seattle since October (!) so my body wasn’t used to the “heat”. I was still feeling good physically and running well – in fact, I was running only ~10s slower than my average pace from lap 1! If I kept this up and didn’t fall off the pace much in the second lap, I would have a very nice buffer for the end of the race. I focused on this lap and only thought about these 16-17 miles. I did begin to squirt water from my camelback on to the ‘cooling’ visor I have, which evaporates and helps your head feel cooler – especially since I wasn’t used to the heat and was sweating more, that felt good. The end of the second lap, I started to feel like I was slightly under my ideal sodium levels. I’m pretty sensitive to sodium; I also drink a lot (I was carrying 3-3.5L for every 17 mile lap!); and I’m a salty sweater. Add increased heat, and even though I was right on track with my goal of about ~500mg/hour of sodium intake between my fuel and additional electrolyte pills, I felt a bit under, and so the next while I added an extra electrolyte pill to increase my sodium intake, and the feeling went away as expected.
(My glucose levels had come back down nicely within the first few miles of this lap, dipped down but as I was fueling every 30 minutes, came nicely into range and stayed 100% in range with no issues for the next ~12 hours of the run!)
This time, Scott was aware that I was ahead of expected paces and had been mapping my paces. He told me that if I stayed at that pace for the lap, I would be able to slow down to a 16 min/mi pace for lap 3 (16 miles) and down further to a 17 min/mi pace for the last (almost 13 miles) lap and still beat my goal time. That sounded good to me! He ended up biking out early to meet me so he could start charging my watch a few minutes early, and I ended up taking one of my next snacks – a warmed up frozen waffle – for my ‘last’ snack of the lap because it was time for a snack and there was no reason to wait even though it was part of the ‘next’ lap’s fuel plan. So I got to eat a warm waffle, which was nice!
Once we got almost there, Scott took my vest and biked ahead to begin the camelback process. I hit the turnaround, made another quick bathroom stop, and ran over to the table. This time, since it was 60s and I would finish my next lap while it was still above 50 degrees and light, I left my clothing layers as-is, other than a quick shirt switch to get rid of my sweaty shirt. I decided not to undo my shoes and check my feet for blisters; they felt fine and good. Because I didn’t need a shoe change or have anything going on to troubleshoot, I was in and out in 5 minutes! Hooray, that gave me another 10 minute buffer (in addition to 5 before, plus all my running ahead of schedule). I took off for lap 3, but warned Scott I would probably be slowing down.
LAP 3 (MILES 35-50)
The third lap was almost the same route, but shorter by a little less than a mile. I was originally concerned, depending on how much I had slowed down, that I would finish either right around sunset or after sunset, so that Scott might need to bring me out a long sleeve shirt and my waist lamp. However, I was ahead of schedule, so I didn’t worry about it, and again set out trying to not fall off my paces too much. I slowed down only a tiny bit on the way out, and was surprised at the turnaround point that I was now only slightly above a 15 min/mi pace! The last few miles I felt like slowing down more, but I was motivated by two thoughts: one was that I would finish this lap and essentially be at 50 miles. This meant, given my excellent pacing, that I would be “PR”ing my 50 mile pace. I’ve not run a standalone 50 miles before, just as part of my 82 mile when I wasn’t paying attention to pace at all (and ran 2-3 min/mi slower as a result), so I was focused on holding my effort level to be close to the same. Plus, after this lap, I “only” had a ~13 mile single lap left. That was my usual route, so it would be mentally easier, and it’s my last lap, so I knew I would get a mental boost from that. Psychologically, having the 50 mile mark to PR here really helped me hold my pace! I ended up only slowing down ~13s average pace compared to the ~10s deterioration between laps 1 and 2. I was pretty pleased with that, especially with hitting 50 miles then!
At this aid station stop, I was pretty cheerful even though I kept telling Scott I would be slowing down. I took ~10 minutes at this stop because I had to put my jacket back on around my waist and put my double headlamp on (which I wear around my waist) for when it got dark, plus do the normal refueling. I changed my short sleeve shirt again so I had a dry shirt, and debated but went ahead and put my fresh long sleeve shirt on and rolled up the sleeves. I figured I’d be putting it on as soon as it got dark, and I didn’t want to have to hassle with getting my vest on and off (while moving) in order to get the shirt on, especially because I’d also have to do that with my jacket later, so I went with the long sleeve shirt on and rolled up the sleeves for now. I had originally planned to put my long pants back on over my shorts, but it was still 63 degrees and the forecast was only going to get down to 45 degrees by midnight, and I seemed ahead of schedule and should finish by then. If I did get really cold, Scott could always bike out early and bring me more layers, but even 45 degrees in the dark with long sleeves, jacket, ear cover, and two pairs of gloves should be fine, so I went without the pants.
Speaking of ahead of schedule, I was! I had 5 minutes from the first aid station, 15 minutes from the second aid station, 5 minutes from this last aid station…plus another ~15 minutes ahead of what I thought my running time would have been at this point. Woohoo!
LAP 4 (MILES 51-63)
However, as soon as I walked off with my restocked vest, I immediately felt incredibly sore thighs. Ouch! My feet also started complaining suddenly. I did an extra walk interval and resumed my run/walking and my first mile out of the aid station stop was possibly my slowest mile (barring any with a bathroom stop) for the entire race, which is funny, because it was only about a 16:30 pace. But I figured it would be downhill from there and I’d be lucky to hold a sub 17 pace for these last 13 miles, especially because most of them would be in the dark and I naturally move a bit slower in the dark. Luckily, I was so far ahead that I knew that even a 17 min/mi average pace (or even slower) would be fine. However, I had joked to Scott coming into the end of lap 3 that I was tempted to just walk lap 4 (because I was finally starting to be tired) but then I’d have to eat more snacks, because I’d be out there longer. Sounds funny, but it was true – I was eating ok but occasionally I was having trouble swallowing my enzyme pills. Which is completely reasonable, I had been swallowing dozens of those (and electrolyte pills) all day and putting food down my throat for ~12+ hours consistently. It wasn’t the action of swallowing that was a problem, but I seemed to be occasionally mistiming how I would get the pills washed to the back of my mouth at the top of my throat to be able to swallow them down. Once or twice I had to take in some extra water, so it really wasn’t a big deal, but it was a slight concern that if I stopped being able to enzyme, I couldn’t fuel (because I have EPI) and I’d either have to tough it out without fueling (bad idea) or stop (not a fun idea). So I had that little extra motivation to try to keep run/walking!
Luckily, that first mile of the last lap was the worst. My thighs were still sore but less so and my feet stopped yelling at me and were back to normal. I resumed a reasonable run/walk pace, albeit at closer to a 15:30+ pace, which was a bigger jump from my previous lap average pace. I didn’t let it stress me out, but I was wishing I felt like fighting harder. But I didn’t, and focused on holding that effort level. I texted Scott, telling him I was averaging sub-16 pace (barely) at miles 4 and 5, then asking him to check my assumption that if I didn’t completely walk it in, I could maybe be an hour ahead of schedule? He confirmed that I “only” needed 16:53 average pace for the lap to come in at 10:30pm (75 minutes ahead of goal) and that if I kept sub-16 I could come in around 10:19pm. Hmmm, that was nice to hear! I didn’t think I would keep sub-16 because it was getting dark and I was tired, ~55 miles into the run, but I was pretty sure I’d be able to be sub 17 and likely sub 16:53! I carried on, turning my light on as it got dark. I was happily distracted by checking happy experiences off my mental list, mostly seeing bunnies beside and darting across the trail in the dark!
I hit the almost-halfway mileage point of the last lap, but even though it wasn’t halfway in mileage it felt like the last big milestone – it was the last mini-hill I had to climb to cross a bridge to loop around back to finish the lap. Hooray! I texted Scott and told him I coudn’t believe that, with ~7 miles left, I would be done in <2 hours. It was starting to sink in that I’d probably beat my goal of 11:45 and not doubt that it was real, and that I’d beat it by more than a few minutes. I then couldn’t resist – and was also worried Scott wouldn’t realize how well I was moving and be prone to coming out too late – and texted him again when I was <5 miles out and then 4 miles out. But by the time I was at 3 miles, he replied to ask if I needed anything else other than the bag I had planned for him to bring to the finish. Nope, I said.
At that point, I was back on my home turf, as I think about the last 2-3 miles that I run or walk on most days of the week. And I had run these miles 3 times already (in each direction, too), but it was pretty joyful getting to the point where I know not only every half mile marker but every tenth of a mile. And when I came up under the last bridge and saw a bright light biking toward me, it was Scott! He made it out to the 1.75 mile mark and rode in with me, which was fun. I was still holding just under sub-16 pace, too. I naturally pick up the pace when he’s biking with me – even when I’ve run 60+ miles! – and I was thinking that I’d be close but a few minutes under an hour and a half of schedule. It didn’t really matter exactly, but I like even numbers, yet I didn’t feel like I had tons of energy to push hard to the end – I was pleased enough to still be moving at a reasonable speed at this point!
Finally, about a half mile out, Scott biked ahead to set up the finish for me. (Purple painter’s tape and a sign I had made!) I glanced at my watch as I rounded the last corner, about .1 mile away, and though “oh, I was so close to beating the goal by over an hour and a half, too bad I didn’t push harder a few minutes ago so I could come in by 10:16 and be an hour and a half ahead”. I ran a tiny bit more but didn’t have much speed, walked a few last steps, then ran the rest of the way so Scott could video me coming into the finish. I could see the light from his bike’s light glowing on the trail, and as I turned the corner to the finish I was almost blinded by his waist light and his head lamp. I ran through the finish tape and grinned. I did it! He stopped videoing and told me to stop my trackers. I did but told him it didn’t matter, because I was somewhere under an hour and a half. We took a still picture, then picked up my tape and got ready to head home. I had done it! I had run 100k, beat my goal time…and it turns out I DID beat it by over an hour and a half! We checked the timestamp on the video Scott took of the finish and it has me crossing at 10:16pm, so that makes it a 16 hour and 16 minute finish – woohoo!
My last lap ended up being ~37 seconds average pace slower, so I had :10, :13, and :37 differences between the laps. Not too bad for that distance! I think I could’ve pushed a little harder, but I honestly didn’t feel like it psychologically, since I was already exceeding all of my goals, and I was enjoying focusing on the process meta-goals of trying to keep steady efforts and paces. Overall, my average pace was 15:36 min/mi which included ~30 min of aid station stops; and my average moving pace (excluding those 30 minutes of aid station time but did include probably another ~8-10 min of bathroom stops) was 15:17 min/mi. I’m pleased with that!
FUN STATS
One of the things I do for all training runs but also races is input my fueling as I go, because it helps me make sure I’m actually fueling and spot any problems as they start to develop. As I mentioned, at one point I felt a tiny bit low on sodium and sure enough, I had dipped slightly below 500mg/hr in the two hottest hours of the day when I had also been sweating more and drinking more than I had been previously. Plus, it means I have cool post-run data to see how much I consumed and figure out if I want to adjust my strategy. This time, though? I wouldn’t change a thing. I nailed it! I averaged 585 mg/hour of sodium across all ~16 hours of my run. I also averaged ~264 calories/hour, which is above my ~250/hr goal. I did skip – intentionally – the very last snack at the top of the 16th hour, and it still meant that I was above goal in all my metrics. I don’t set goals for carb intake, but in case you were wondering, I ended up averaging 29.9 grams of carbs/hour (min 12, max 50, and the average snack is 15.4 carbs), but that’s totally coincidental. Overall, I consumed 3,663 calories, which was 419 carbs, 195 g of fat, and 69 grams of protein.
With EPI, as I mentioned that means I have to swallow enzyme pills with every snack, which was every 30 minutes. I swallowed 71 OTC enzyme pills (!) to match all that fuel, plus 26 electrolyte pills…meaning I swallowed 97 pills in 16 hours. You can see why I get tired of swallowing!
Here’s a visual where you can see my consumption of calories, sodium, (and carbs) over the course of my race. The dip at the end is because I intentionally skipped the second snack of the hour 16 because I was almost done. Up to 15 hours (excluding the last hour), I had a slightly rolling increase in sodium/hr and a very slight decrease in calories/hr, with carbs/hr slightly increasing. Including the 16th hour (with a skipped snack intentionally), this changed the trends to slight rolling decrease in sodium/hr; the slight decrease trend in calories/hr continued; but it flattened the carbs/hr trend line to be neutral.
In contrast to my 82 mile where I had more significant fluctuations in sodium (and really felt it), I’m glad I was able to keep my sodium consumption at goal levels and also more easily respond when the conditions changed (hotter weather causing more sweat and more water intake than previous hours) so I could keep myself from getting into a hole sodium-wise. Overall, I feel like I get an A+ for executing my fueling and sodium strategy as planned. GI-wise, I get an A+++ because I had ZERO GI symptoms during and after the run! That’s really rare for any ultrarunners, let alone those of us with GI conditions (in my case, exocrine pancreatic insufficiency). Plus, despite the unclipped pump site and BG rise that resulted, I resumed back to typical running glucose levels for me and achieved 100% TIR 70-180 after that and I think likely 100% TIR for a more narrow range like 70-140, too, although I haven’t bothered to run those stats because I don’t care exactly what the numbers are. More importantly, I never went low, I never had any big drops or rises, and other than the brief 30 minutes of annoyance due to an unclipped pump site, diabetes did not factor any more into my thinking than blister management or EPI pill swallowing or sodium did – which is great!
Here’s a view of what I had leftover after my run. I had intentionally planned for an extra snack for every lap, plus I ran faster so I needed fewer overall. I also had packed extra enzymes and electrolytes for every lap, hoping I would never need to stress about running out on any individual lap – and I didn’t, so those amounts worked well.
POST-RUN RECOVERY
As soon as I stopped running and took a picture at the finish line, we got ready to head home. My muscles froze up as soon as I stopped, just like always, so I moved like a tin person for a few steps before I loosened back up and was able to walk normally. I got home, and was able to climb into the shower (and out!) without too much hardship. I climbed into bed, hydrated, and was able to go to sleep pretty normally for about 5 hours. I woke up at 5am pretty awake, which possibly was also due to the fact that I had been sleep shifting my sleep schedule, but I also felt really stiff and used the opportunity to point and flex my ankles. I slept every 20-30 minutes off and on for another few hours before I finally got up at 8am and THEN felt really sore and stiff! My right lower shin was sore and had felt sore just a tiny bit in the last few miles of my run, so it wasn’t surprising that it was sore. My right hip, which is the one I had been watching prior to the race, was sore again. I hobbled around the house and started to loosen up, enough that I decided that I would put shoes on and try to go for a short easy walk. Usually, I can’t psychologically fathom putting shoes on my feet after an ultra, but my feet felt really decent! I had some blisters, sure, but I hadn’t even noticed them running and they didn’t hurt to walk on. My hip and ankle were more noticeable. I didn’t try to take the stairs and used the elevator, then began hobbling down the sidewalk. Ouch. My hip was hurting so much that I stopped at the first bench and laid down on it to stretch my hip out. Then I walked .3 miles to the next bench and again stretched my hip. A little better, so we went out a bit farther with the plan to turn around, but my hip finally loosened up after a half mile where I could mostly walk normally! Hooray. In total, I managed 1.5 miles or so of a walk, which is pretty big for me the day after an ultra run.
Meaningfully, overnight, I still had 100% time in range (ideal glucose levels). I did not have to do any extra work, thanks to OpenAPS and autosensitivity which adjusts automatically to any increases and later return to normal insulin sensitivity from so much activity!
The next night, I slept even better, and didn’t notice any in-bed stiffness, although again on the second morning I felt stiff getting out of bed, but was able to do my full 5k+ walk route with my hip loosening up completely by a mile so that I didn’t even think about it!
On day 3, I feel 90% back to normal physically. I’m mostly fatigued,which Scott keeps reminding me is “as one should be” after runnning 100k! The nice change is that with previous ultras or long runs, I’ve felt brain fog for days or sometimes weeks – likely due to not fueling enough. But with my A+ fueling, my brain feels great – and good enough that it’s annoyed with my body still being a little bit tired. Interestingly, my body is both tired but also itching for more activity and new adventures. My friend compared it to “sea legs” where the brain has learned that the body should always be in motion, which is a decent analogy.
WHAT I HAVE LEARNED
I wouldn’t change anything in terms of my race pacing, execution, aid station stops, fueling, etc. for this run.
What I want to make sure I do next time includes continuing to adapt my training to listen to my body, rather than sticking to my pre-decided plan of how much to run. I feel like I can do that both because I now have 3000+ miles on my body of lifetime running (that I didn’t have for my first ultra); and I now have two ultras (last year’s 82 miles post-broken toe and this year’s 100k with minor hiccups like a sore shin and a hip at different times) where I was forced to or chose to adapt training, and it turned out just as good as I would have expected. For my 100k, I think the adaptation to 3 runs per week, all with my vest, ended up working well. This is the first run where I didn’t have noticeable shoulder soreness from my pack!
Same goes for taper: I don’t think, at my speed/skill level, that exact taper strategy makes a difference, and this experience confirmed it, doing DIY ultras and being able to flex a week forward or back based on how I’m physically feeling and when the best weather will be is now my preferred strategy for sure.
—-
If you’re new to ultras and haven’t read any of my other posts, consider reading some of the following, which I’ve alluded to in my post and directly contribute to the above situation being so positive:
Feel free to leave questions if you have any, either about slow ultra running in general or any other aspects of ultra running! I’m a places-from-last kind of ultra runner, but I’m happy to share my thinking process if it helps anyone else plan their own adventures.
Eating gluten free for the rest of your life, because you were diagnosed with celiac disease? Heard that response (I could never do that) for going on 14 years.
Inject yourself with insulin or fingerstick test your blood glucose 14 times a day? Wear an insulin pump on your body 24/7/365? Wear a CGM on your body 24/7/365?
Yeah, I’ve heard you can’t do that, either. (For 20 years and counting.) Which means I and the other people living with the situations that necessitate these behaviors are…doing this for fun?
We’re not.
More recently, I’ve heard this type of comment come up about tracking what I’m eating, and in particular, tracking what I’m eating when I’m running. I definitely don’t do that for fun.
—
I have a 20+ year strong history of hating tracking things, actually. When I was diagnosed with type 1 diabetes, I was given a physical log book and asked to write down my blood glucose numbers.
“Why?” I asked. They’re stored in the meter.
The answer was because supposedly the medical team was going to review them.
And they did.
And it was useless.
“Why were you high on February 22, 2003?”
Whether we were asking this question in March of 2003 or January of 2023 (almost 20 years later), the answer would be the same: I have no idea.
BG data, by itself, is like a single data point for a pilot. It’s useless without the contextual stream of data as well as other metrics (in the diabetes case, things like what was eaten, what activity happened, what my schedule was before this point, and all insulin dosed potentially in the last 12-24h).
So you wouldn’t be surprised to find out that I stopped tracking. I didn’t stop testing my blood glucose levels – in fact, I tested upwards of 14 times a day when I was in high school, because the real-time information was helpful. Retrospectively? Nope.
—
I didn’t start “tracking” things again (for diabetes) until late 2013, when we realized that I could get my CGM data off the device and into the laptop beside my bed, dragging the CGM data into a CSV file in Dropbox and sending it to the cloud so an app called “Pushover” would make a louder and different alarm on my phone to wake me up to overnight hypoglycemia. The only reason I added any manual “tracking” to this system was because we realized we could create an algorithm to USE the information I gave it (about what I was eating and the insulin I was taking) combined with the real-time CGM data to usefully predict glucose levels in the future. Predictions meant we could make *predictive* alarms, instead of solely having *reactive* alarms, which is what the status quo in diabetes has been for decades.
At the beginning of 2020, my life changed. Not because of the pandemic (although also because of that), but because I began to have serious, very bothersome GI symptoms that dragged on throughout 2020 and 2021. I’ve written here about my experiences in eventually self-diagnosing (and confirming) that I have exocrine pancreatic insufficiency, and began taking pancreatic enzyme replacement therapy in January 2022.
What I haven’t yet done, though, is explain all my failed attempts at tracking things in 2020 and 2021. Or, not failed attempts, but where I started and stopped and why those tracking attempts weren’t useful.
Once I realized I had GI symptoms that weren’t going away, I tried writing down everything I ate. I tried writing in a list on my phone in spring of 2020. I couldn’t see any patterns. So I stopped.
A few months later, in summer of 2020, I tried again, this time using a digital spreadsheet so I could enter data from my phone or my computer. Again, after a few days, I still couldn’t see any patterns. So I stopped.
I made a third attempt to try to look at ingredients, rather than categories of food or individual food items. I came up with a short list of potential contenders, but repeated testing of consuming those ingredients didn’t do me any good. I stopped, again.
When I first went to the GI doctor in fall of 2020, one of the questions he asked was whether there was any pattern between my symptoms and what I was eating. “No,” I breathed out in a frustrated sigh. “I can’t find any patterns in what I’m eating and the symptoms.”
So we didn’t go down that rabbit hole.
At the start of 2021, though, I was sick and tired (of being sick and tired with GI symptoms for going on a year) and tried again. I decided that some of my “worst” symptoms happened after I consumed onions, so I tried removing obvious sources of onion from my diet. That evolved to onion and garlic, but I realized almost everything I ate also had onion powder or garlic powder, so I tried avoiding those. It helped, some. That then led me to research more, learn about the categorization of FODMAPs, and try a low-FODMAP diet in mid/fall 2021. That helped some.
Then I found out I actually had exocrine pancreatic insufficiency and it all made sense: what my symptoms were, why they were happening, and why the numerous previous tracking attempts were not successful.
You wouldn’t think I’d start tracking again, but I did. Although this time, finally, was different.
When I realized I had EPI, I learned that my body was no longer producing enough digestive enzymes to help my body digest fat, protein, and carbs. Because I’m a person with type 1 diabetes and have been correlating my insulin doses to my carbohydrate consumption for 20+ years, it seemed logical to me to track the amount of fat and protein in what I was eating, track my enzyme (PERT) dosing, and see if there were any correlations that indicated my doses needed to be more or less.
My spreadsheet involved recording the outcome of the previous day’s symptoms, and I had a section for entering multiple things that I ate throughout the day and the number of enzymes. I wrote a short description of my meal (“butter chicken” or “frozen pizza” or “chicken nuggets and veggies”), the estimate of fat and protein counts for the meal, and the number of enzymes I took for that meal. I had columns on the left that added up the total amount of fat and protein for the day, and the total number of enzymes.
It also helped me see that within the first month, I was definitely improving, but not all the way – in terms of fully reducing and eliminating all of my symptoms. So I continued to use it to titrate my enzyme doses.
Then it helped me carefully work my way through re-adding food items and ingredients that I had been avoiding (like onions, apples, and pears) and proving to my brain that those were the result of enzyme insufficiency, not food intolerances. Once I had a working system for determining how to dose enzymes, it became a lot easier to see when I had slight symptoms from slightly getting my dosing wrong or majorly mis-estimating the fat and protein in what I was eating.
It provided me with a feedback loop that doesn’t really exist in EPI and GI conditions, and it was a daily, informative, real-time feedback loop.
As I reached the end of my first year of dosing with PERT, though, I was still using my spreadsheet. It surprised me, actually. Did I need to be using it? Not all the time. But the biggest reason I kept using it relates to how I often eat. I often look at an ‘entree’ for protein and then ‘build’ the rest of my meal around that, to help make sure I’m getting enough protein to fuel my ultrarunning endeavors. So I pick my entree/main thing I’m eating and put it in my spreadsheet under the fat and protein columns (=17 g of fat, =20 g of protein), for example, then decide what I’m going to eat to go with it. Say I add a bag of cheddar popcorn, so that becomes (=17+9 g of fat) and (=20+2 g of protein), and when I hit enter, those cells now tell me it’s 26 g of fat and 22 g of protein for the meal, which tells my brain (and I also tell the spreadsheet) that I’ll take 1 PERT pill for that. So I use the spreadsheet functionally to “build” what I’m eating and calculate the total grams of protein and fat; which helps me ‘calculate’ how much PERT to take (based on my previous titration efforts I know I can do up to 30g of fat and protein each in one PERT pill of the size of my prescription)
Essentially, this has become a real-time calculator to add up the numbers every time I eat. Sure, I could do this in my head, but I’m usually multitasking and deciding what I want to eat and writing it down, doing something else, doing yet something else, then going to make my food and eat it. This helps me remember, between the time I decided – sometimes minutes, sometimes hours in advance of when I start eating and need to actually take the enzymes – what the counts are and what the PERT dosing needs to be.
I have done some neat retrospective analysis, of course – last year I had estimated that I took thousands of PERT pills (more on that here). I was able to do that not because it’s “fun” to track every pill that I swallow, but because I had, as a result of functional self-tracking of what I was eating to determine my PERT dosing for everything I ate, had a record of 99% of the enzyme pills that I took last year.
I do have some things that I’m no longer entering in my spreadsheet, which is why it’s only 99% of what I eat. There are some things like a quick snack where I grab it and the OTC enzymes to match without thought, and swallow the pills and eat the snack and don’t write it down. That maybe happens once a week. Generally, though, if I’m eating multiple things (like for a meal), then it’s incredibly useful in that moment to use my spreadsheet to add up all the counts to get my dosing right. If I don’t do that, my dosing is often off, and even a little bit “off” can cause uncomfortable and annoying symptoms the rest of the day, overnight, and into the next morning.
So, I have quite the incentive to use this spreadsheet to make sure that I get my dosing right. It’s functional: not for the perceived “fun” of writing things down.
–
It’s the same thing that happens when I run long runs. I need to fuel my runs, and fuel (food) means enzymes. Figuring out how many enzymes to dose as I’m running 6, 9, or 25 hours into a run gets increasingly harder. I found that what works for me is having a pre-built list of the fuel options; and a spreadsheet where I quickly on my phone open it and tap a drop down list to mark what I’m eating, and it pulls in the counts from the library and tells me how many enzymes to take for that fuel (which I’ve already pre-calculated).
It’s useful in real-time for helping me dose the right amount of enzymes for the fuel that I need and am taking every 30 minutes throughout my run. It’s also useful for helping me stay on top of my goal amounts of calories and sodium to make sure I’m fueling enough of the right things (for running in general), which is something that can be hard to do the longer I run. (More about this method and a template for anyone who wants to track similarly here.)
–
The TL;DR point of this is: I don’t track things for fun. I track things if and when they’re functionally useful, and primarily that is in real-time medical decision making.
These methods may not make sense to you, and don’t have to.
It may not be a method that works for you, or you may not have the situation that I’m in (T1D, Graves, celiac, and EPI – fun!) that necessitates these, or you may not have the goals that I have (ultrarunning). That’s ok!
But don’t say that you “couldn’t” do something. You ‘couldn’t’ track what you consumed when you ran or you ‘couldn’t’ write down what you were eating or you ‘couldn’t’ take that many pills or you ‘couldn’t’ inject insulin or…
You could, if you needed to, and if you decided it was the way that you could and would be able to achieve your goals.
I’ve been using Google Sheets for tracking and illustrating data for a number of reasons, such as tracking macronutrient and enzyme consumption patterns to help me understand my experiences with exocrine pancreatic insufficiency (EPI). It took me a while to figure out there was an easy way to display slope, though, to quantify what the trendline was.
Once you have a chart with your data, you can go into the “Customize” tab on the right and scroll down. Under “Series”, you can select which series you want, then scroll down and click “Trendline” to make the trendline appear. The customize menu then expands with trendline options.
I had never noticed this before, but “Label” is set to default to “Custom”. This creates a label that defaults to “Trendline __YourSeriesName___”. In the example I’m showing here, I have series A labeled as “Var A”, so if I turn the Trendline on, it defaults to adding the “Custom” label of Trendline Var A.
But you can change this!
Click the dropdown where it says “Custom” and select “Use Equation”.
Now it will show the label as the y=mx+b equation, so you can find out the slope (m) of your trendline.
In my example this means the slope of the Var A green line is 0.267.
You can modify this name, though, and get the best of both worlds. Click on the equation in the legend, and you will get an editable text box. I like to put the series name (e.g., Var A) in front of the equation so I can more easily see at a glance which series trend line it is explaining:
In my particular case, I want a quick glance of the slope, so I modify mine to read (Var A) 0.267 and (Var B) 0.061.
The only downside to this is the custom names will not automatically update. So if your brain can handle seeing the full mx+B equation, it might be better to leave it with the default equation as the trendline label name without modifying it at all, so it hopefully updates if you update the data on your graph. Otherwise, you’ll want to make a mental note to come back and update this manually by re-toggling the variable to equation and then editing it again to show the updated slope.
I’ve had exocrine pancreatic insufficiency (EPI or PEI) for a full year now and have been taking pancreatic enzyme replacement therapy (PERT) ever since diagnosis.
In 365 days of pancreatic enzyme replacement therapy, I have consumed (at least) 3,277 pills.
That’s an average of 8.98 pills per day!
As I previously wrote, the number of pills is in part because I’m trying to lower the total costs (to everyone involved in paying for it) of my PERT by taking a mix of prescription PERT and OTC enzymes to try to balance effective dosing, cost, and the number of pills I swallow. I take one pill with my standard breakfast, so the remaining ~8 average pills are usually split between lunch, dinner, and/or a snack if I have one. (This is also influenced by my ultrarunning where I typically take ~2 pills every 30 minutes with my snacks/fuel for running, so long training days of 4 hours would involve 8 or more pills just for running fuel; obviously longer runs would involve even more, which drives the pills/day average higher.) If I wanted to reduce the total number of pills, I could by driving up the cost by using bigger, prescription PERT pills in lieu of some of the OTC options. However, most of the time, 3-4 pills per meal mixed between prescription and OTC is doable for me. I typically would choose to round up more PERT and reduce OTC pill count when I’m less certain about the macronutrient content of the meal or I want more confidence in better outcomes.
Speaking of better outcomes – is PERT effective?
For me, yes!
Overall, I feel so much better. Most of the time, I hardly ever have ANY symptoms (such as gas, bloating, or feeling icky) let alone my more extreme symptoms of “disrupting” my GI system. In the year of taking PERT, 78% of the time I had no disruption or any noticeable symptoms.
The average length of time between days with noticeable symptoms was 5.37 days.
And, if you look at the second half of the year, this increased quite a bit: 88% of the time I had no noticeable symptoms and the streak length of days between symptom days increased to 6.81 average days! The max streak is now 28 days (and counting)!
That’s approaching a full month without any GI symptoms (woohoo) of any kind, and means less than 1 or 2 instances of symptoms per month for me in the last several months. That’s probably better than average for most people, even people without known GI conditions, and getting a lot closer back to my personal level of “normal”.
And obviously, this is continuing to increase over time as I improve my PERT dosing strategy.
This is pretty meaningful to think about.
PERT made a difference overall straight away, but I was also starting with very small portions of food and a very restricted diet. (This is because before I realized I had EPI I had done all kinds of behavioral gymnastics to try to eliminate foods like onion, garlic, and other foods that seemed to cause issues). So first I figured out PERT successfully for what I was eating; then carefully expanded my portion sizes back to typical quantities of food; then slowly expanded my diet to cover all the foods I used to eat before I started having all my GI problems.
It very much felt like I had three phases this year:
Phase 1: Use PERT to cover small quantities of small varieties of food. Figure out what foods I could eat that could “fit” into one PERT pill.
Phase 2: Start to figure out what quantities of food I wanted to eat, and get the PERT to match the food.
Phase 3: Finish expanding out my food choices to cover everything I was eating before and tackling all my “firsts” with PERT.
You can see this evolution in my diet, too, when you look at the relative changes in the amount of fat and protein I have eaten over the course of the year. (The one big obvious outlier on the graph in October is my 82 mile ultramarathon where I ate every 30 minutes for 25 hours!) There’s been a slight increase in my fat consumption over the course of the year, and protein consumption has stayed relatively flat as I’ve been making a very conscious effort to eat enough protein to fuel my ultrarunning endeavors throughout the year.
You can then see the relationship with increased number of pills (albeit pills with different amounts of lipase) over the course of the year, relative to the fat and protein consumed.
(Note that the pills per day is using a hidden right axis, whereas the fat and protein share the same left axis numbers, also not shown)
For anyone who is new (just diagnosed or recently diagnosed within a few weeks or months) to EPI, here’s what I would hope you take away:
PERT works, but it needs to match what you are eating. Come up with a strategy (here’s mine – you can use it!) to adjust your dosing to match what you are eating. What you eat changes, and so should your PERT dosing.
Things will improve over time, and you will get more effective at matching your dosing to what you are eating. You should be able to have more and more “streaks” of days without symptoms, or with reduced symptoms. However, this may take a few months, because you’ll likely also be – at the same time – re-expanding your variety of foods that you’re eating. The combination of eating more and different foods AND tweaking your dosing can make it take a little bit longer to figure it all out.
If you’re not seeing success, talk with your doctor. There are different sizes of PERT pills – if you’re struggling to take X number of pills, you may be able to take fewer pills of a bigger size. There are different brands of PERT – so if one isn’t working for you (after you match your dosing to how much fat and protein is in each meal), you can switch and try another brand. There are also OTC options, which you can use to “top off” your prescription PERT or substitute, but you need to have an effective strategy for adjusting your dose that you can translate to your OTCs to be sure that they’re working.

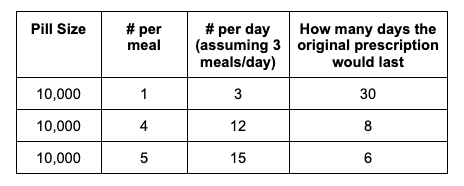
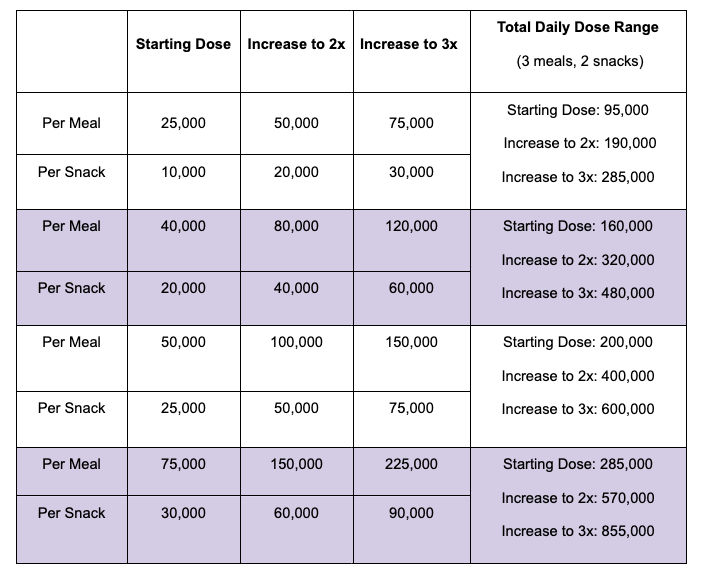
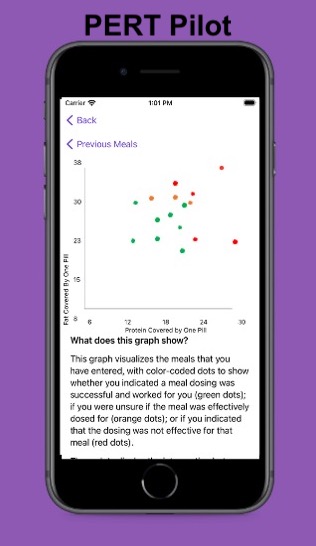 For example, I was initially prescribed an enzyme dose that was one pill per meal (and no snacks), so I had 3 pills per day. But I quickly found myself needing two pills per meal, based on what I was typically eating. I summarized my data to my doctor, saying that I found one pill typically covered up to ~30 grams of fat per meal, but most of my meals were >30 grams of fat, so that I wanted to update my prescription to have an average of 2 pills per meal of this prescription size. I also wanted to be able to eat snacks, so I asked for 2 pills per meal, 1 per snack, which meant that my prescription increased to 8 pills per day (of the same size), to cover 2 pills x 3 meals a day (=6) plus up to 2 snacks (=2). I also had weeks of data to show that my average meal was >30 grams of fat to confirm that I need more than the amount of lipase I was originally prescribed. My doctor was happy to increase my prescription as a result, and this is what I’ve been using successfully for over a year ever since.
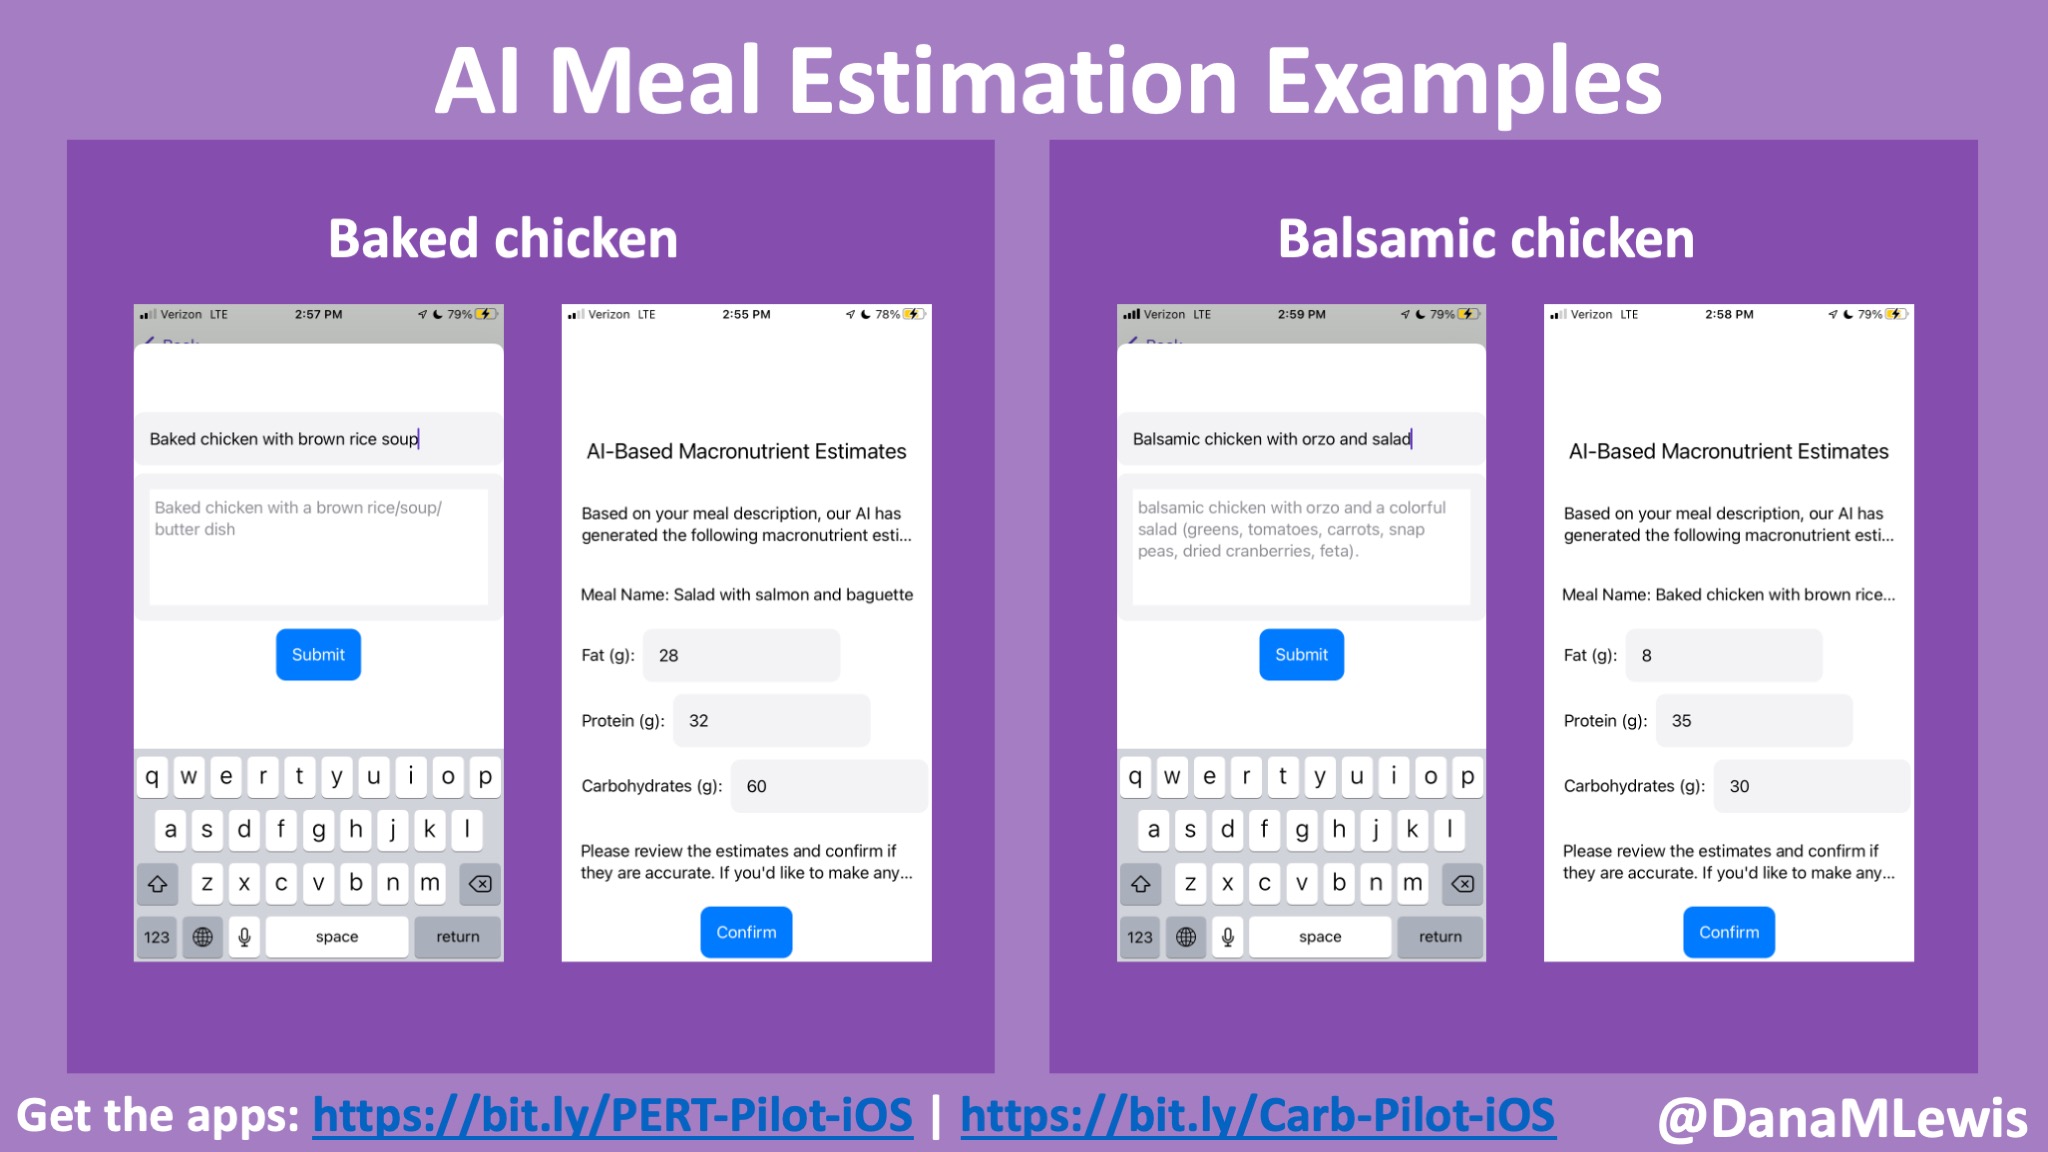
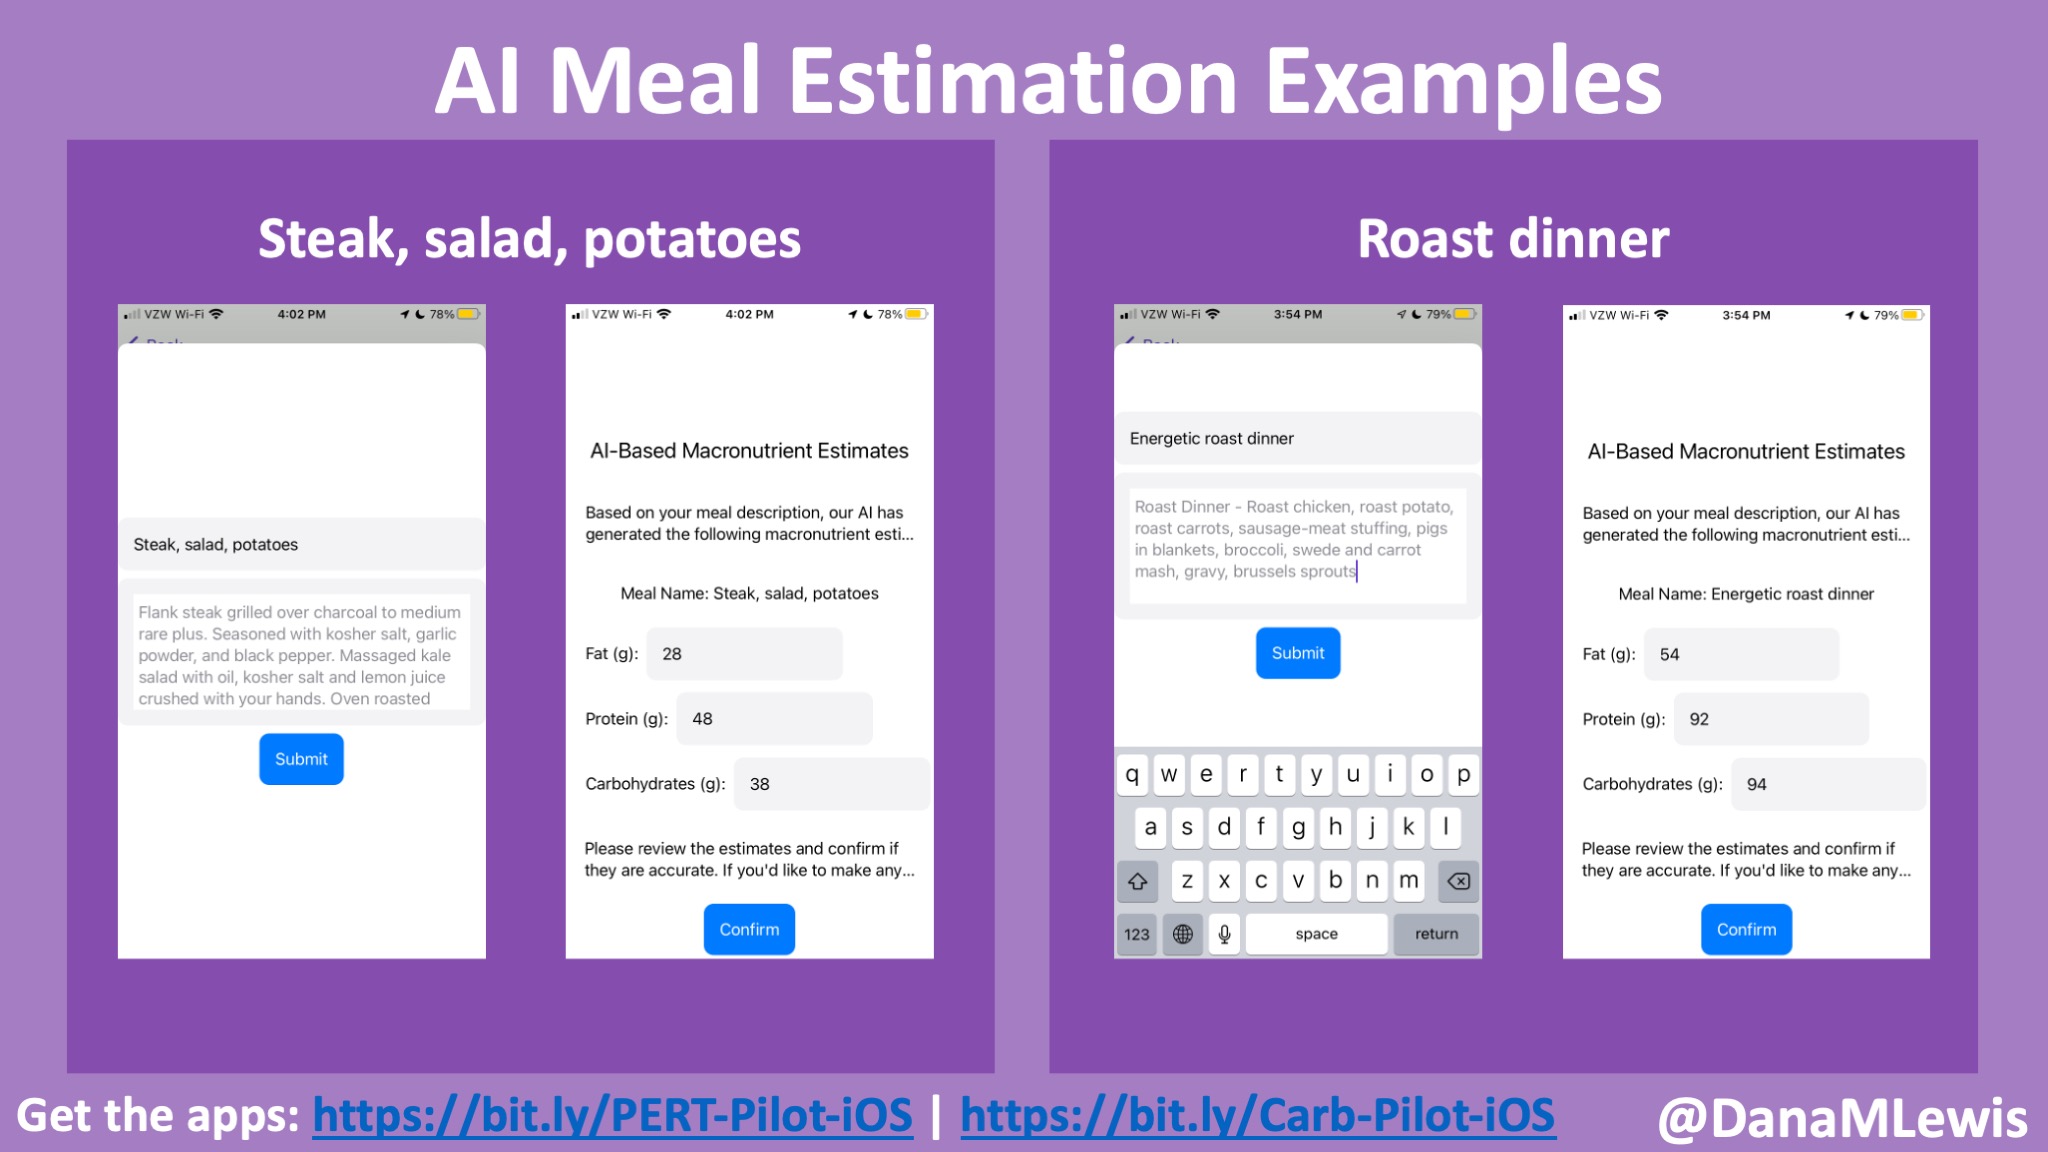
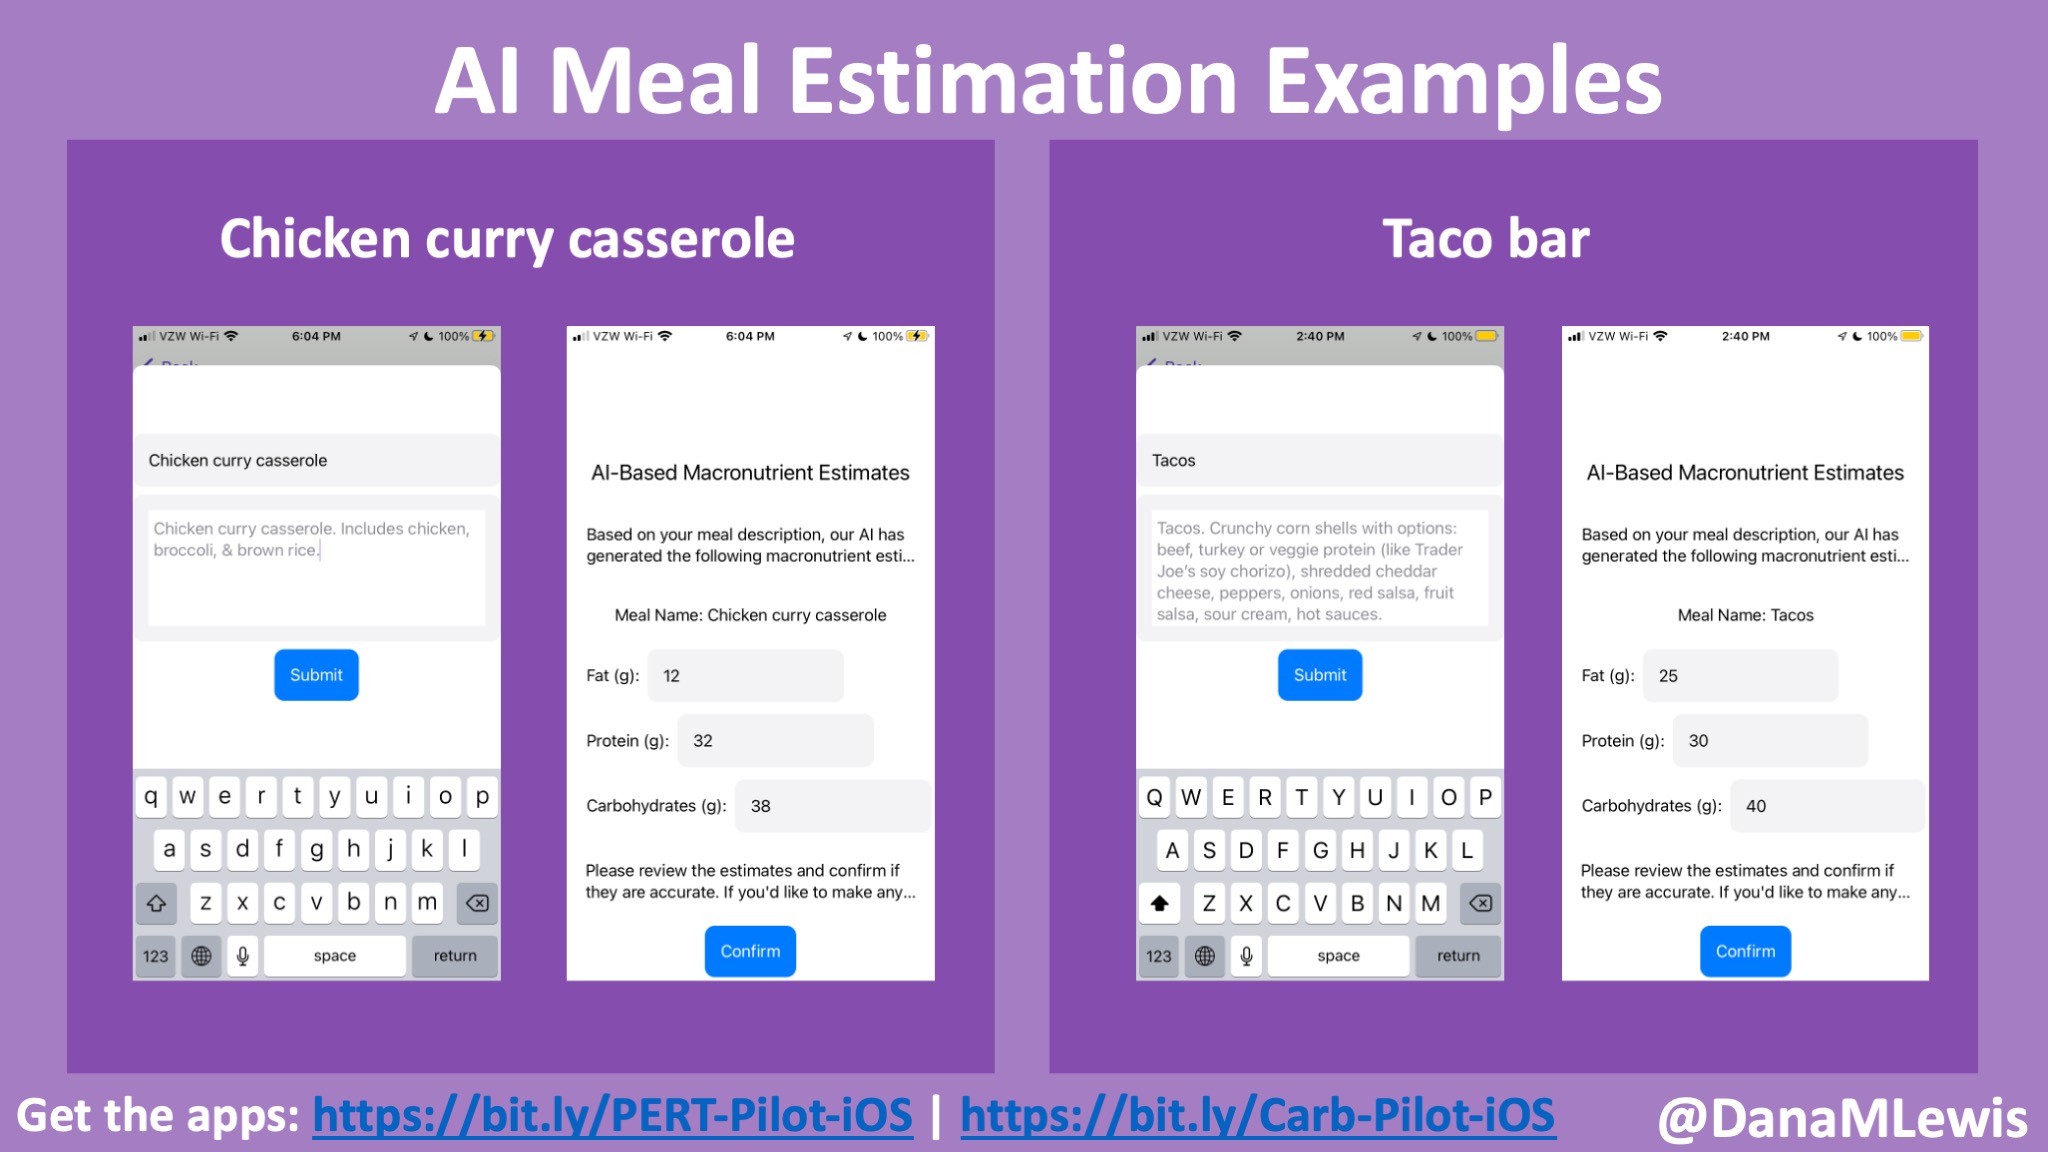
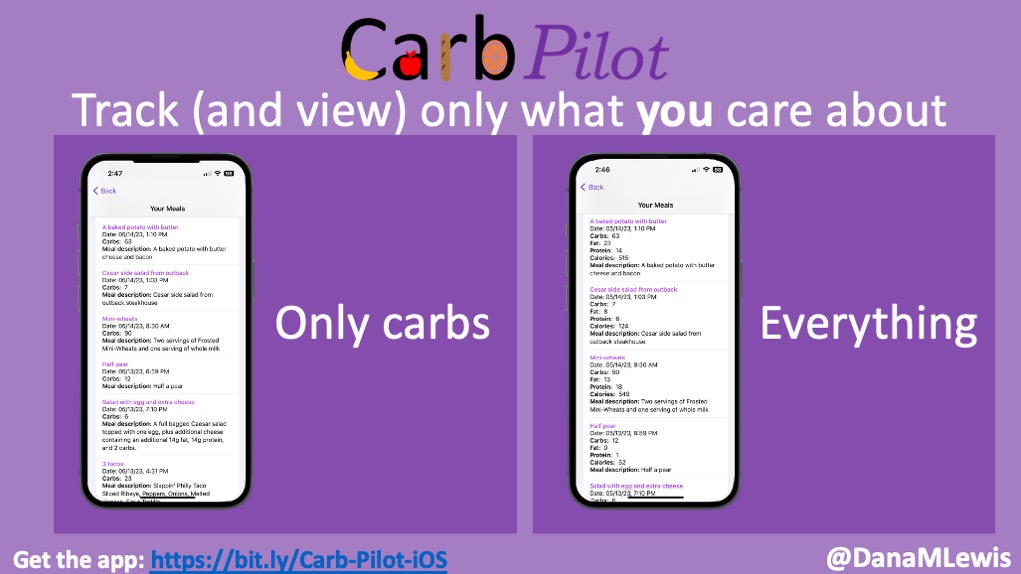

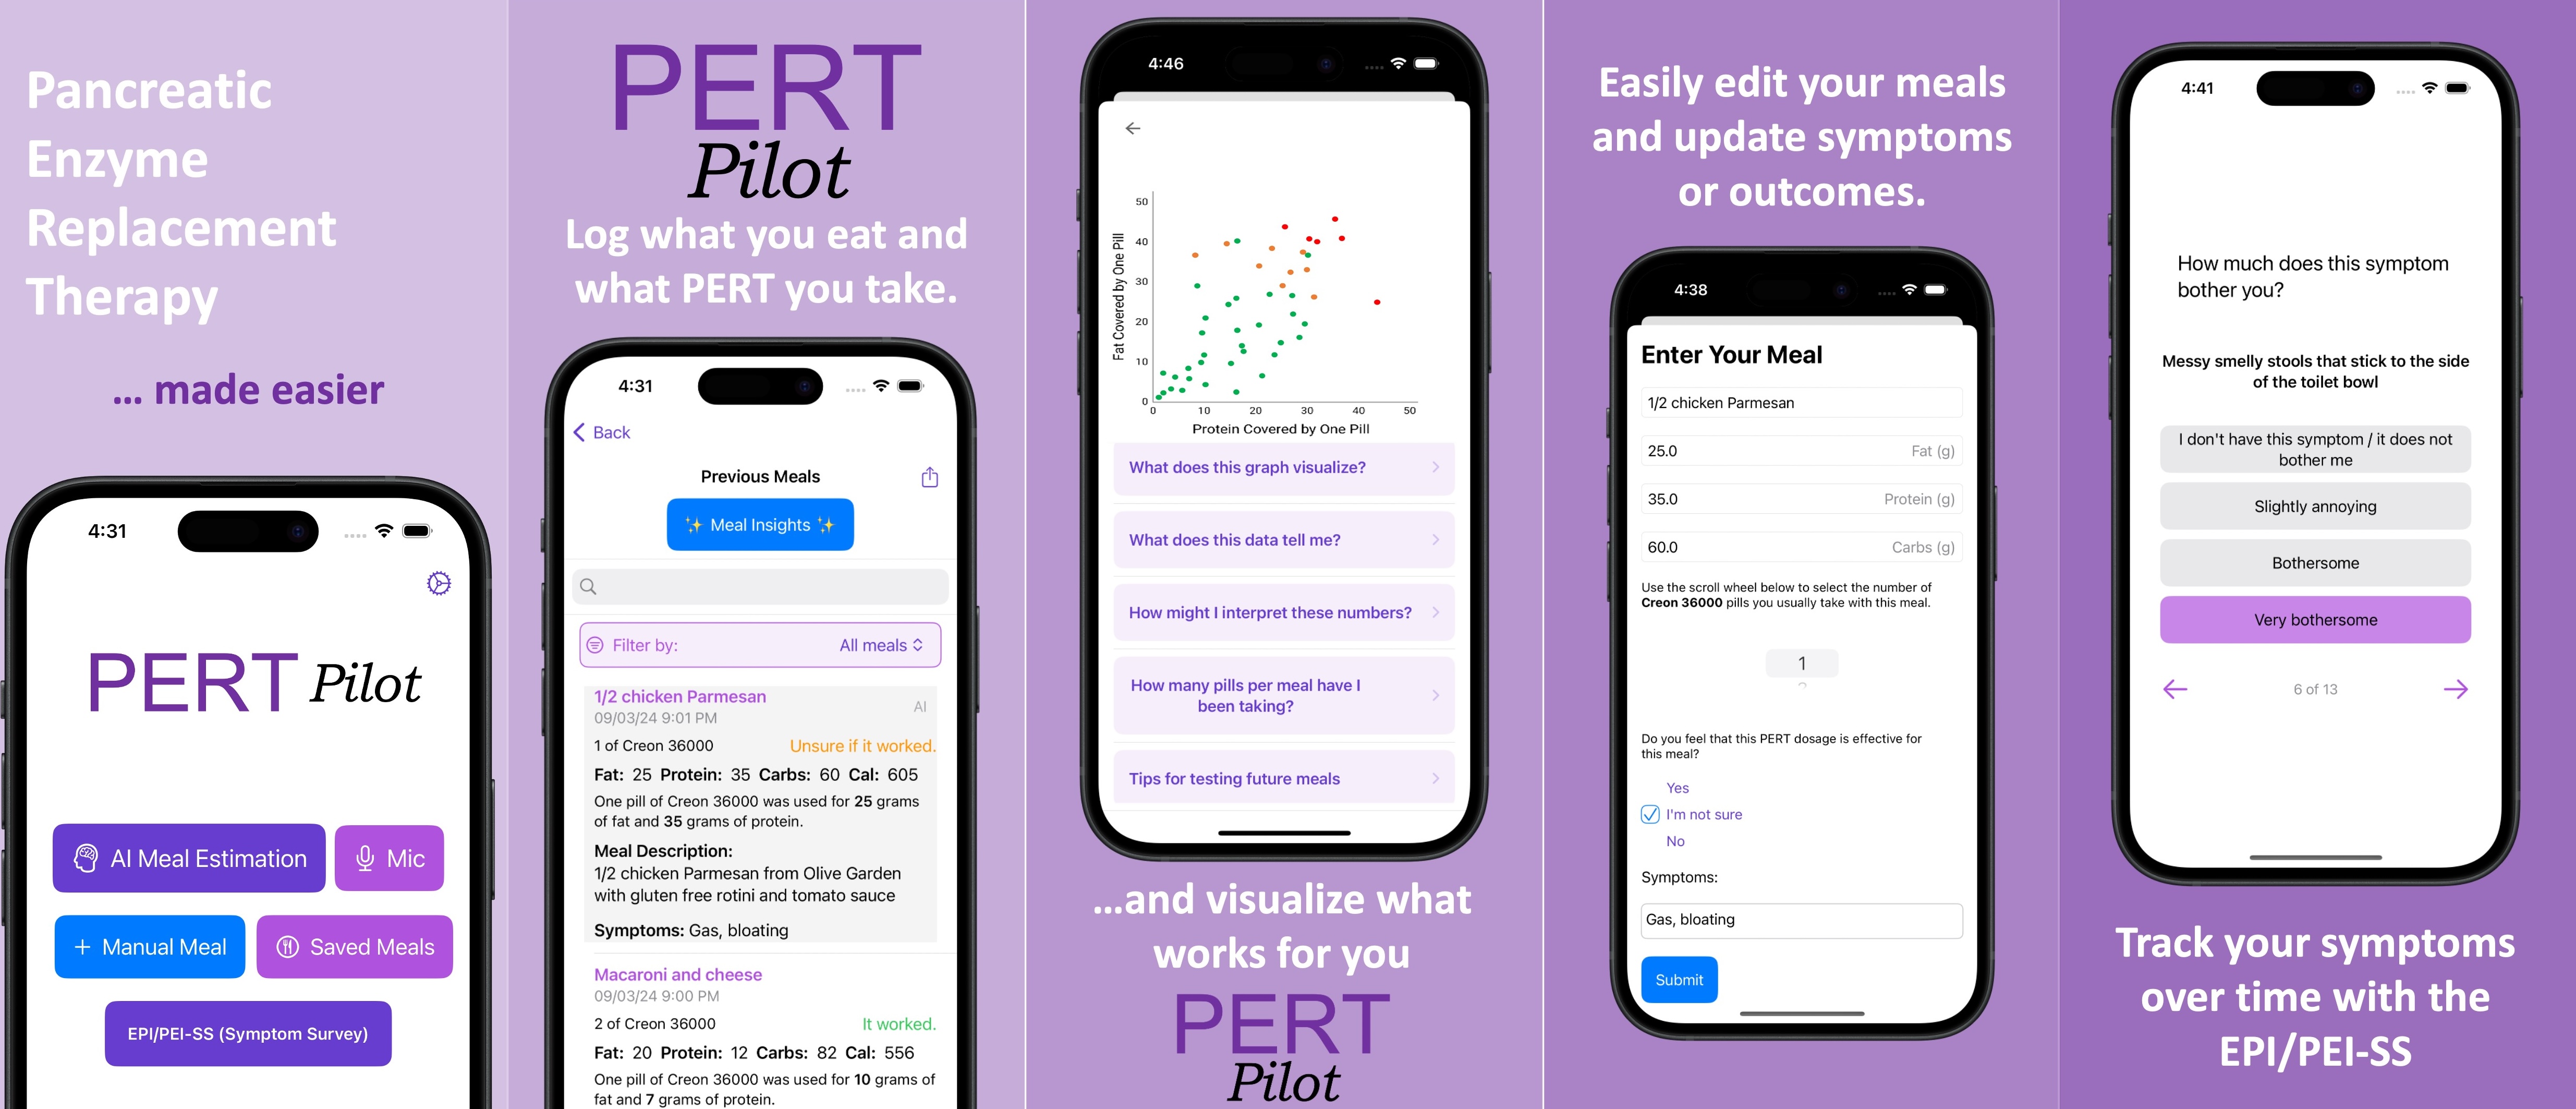
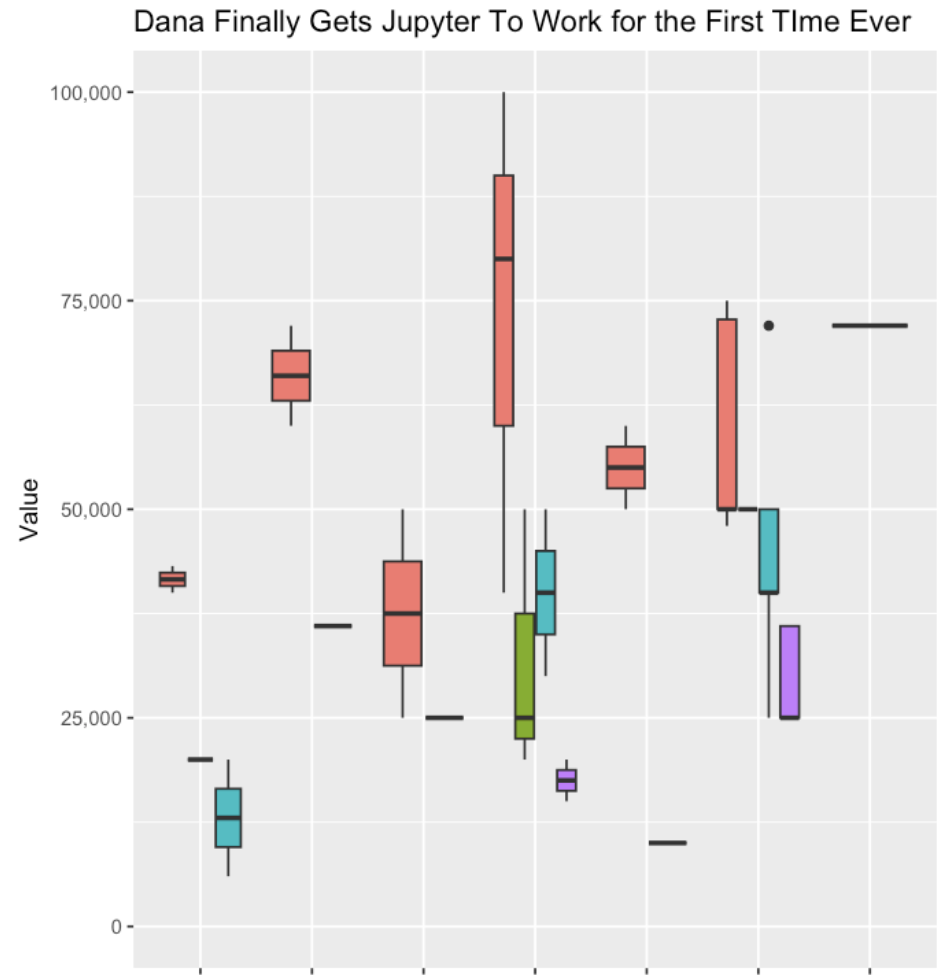
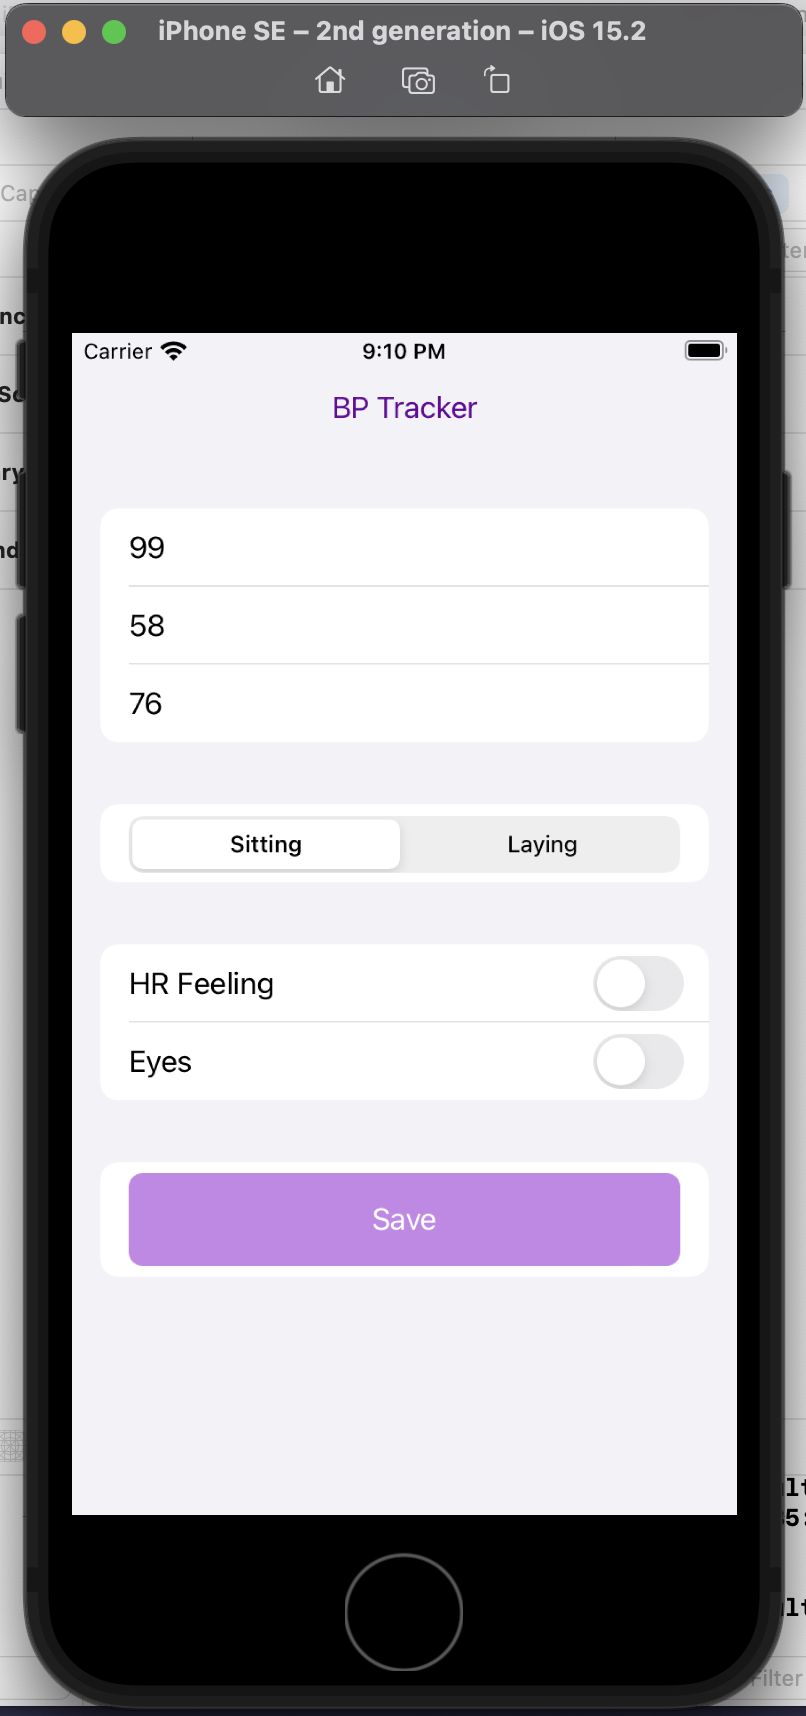
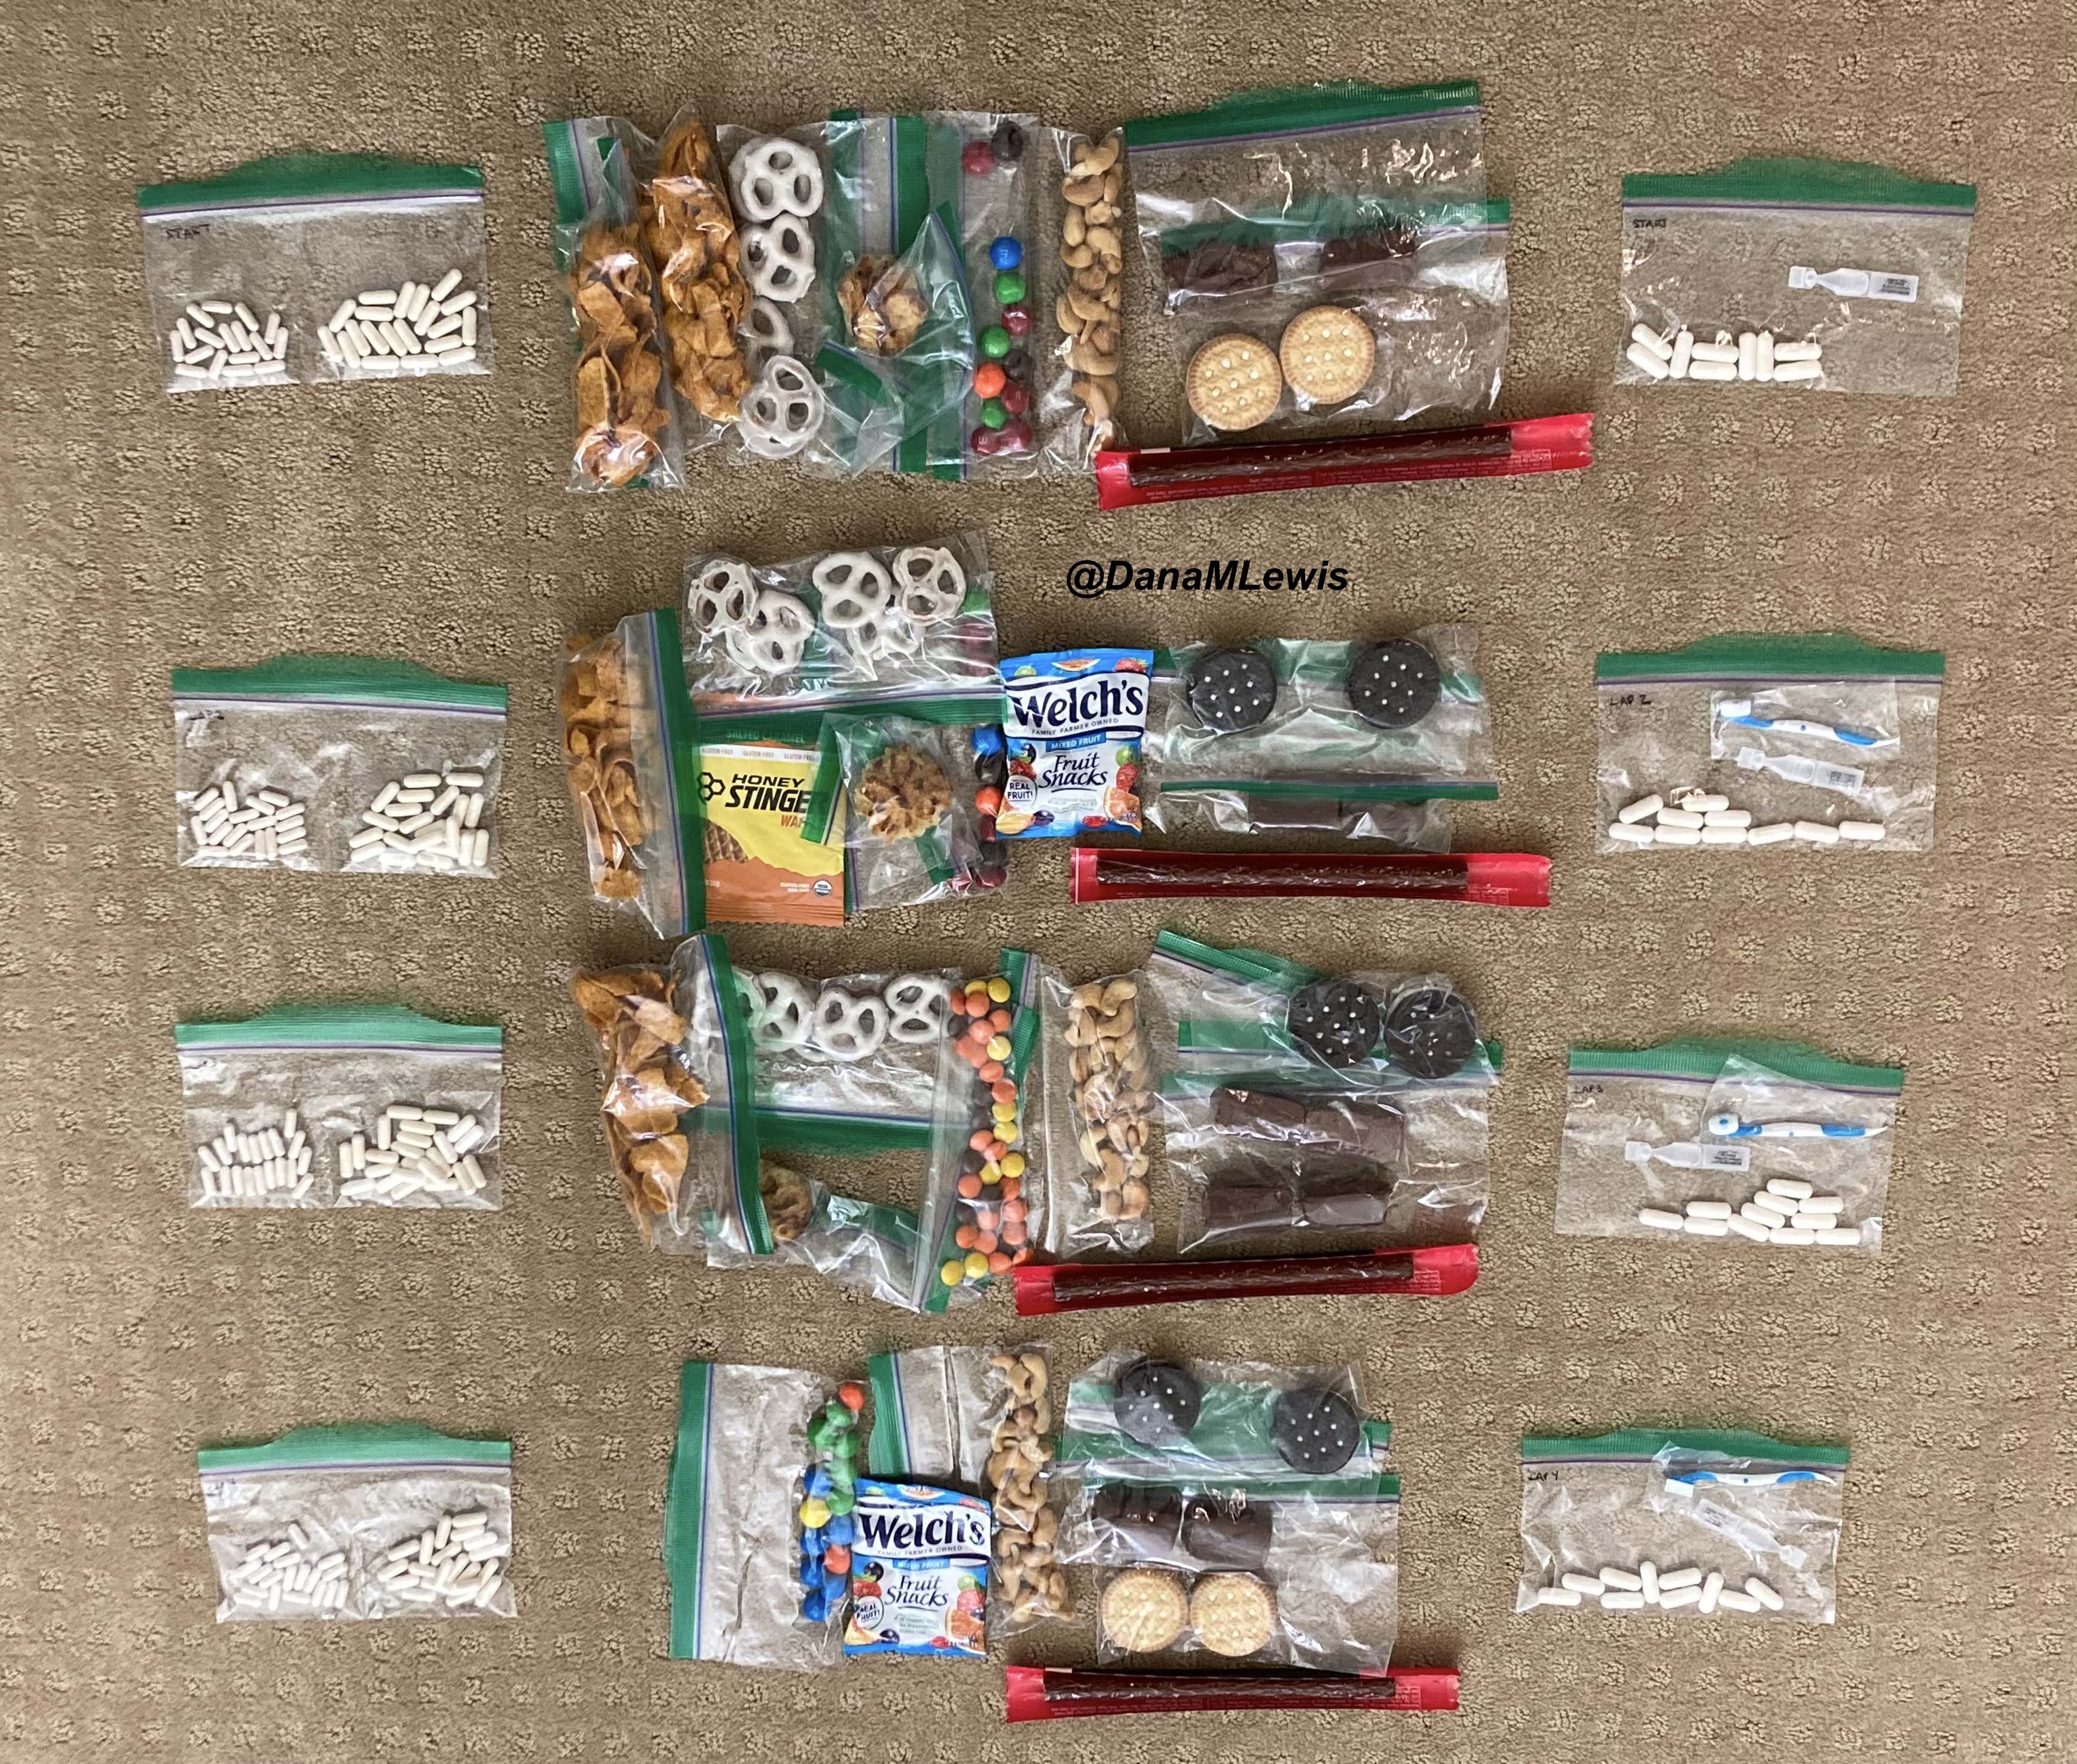
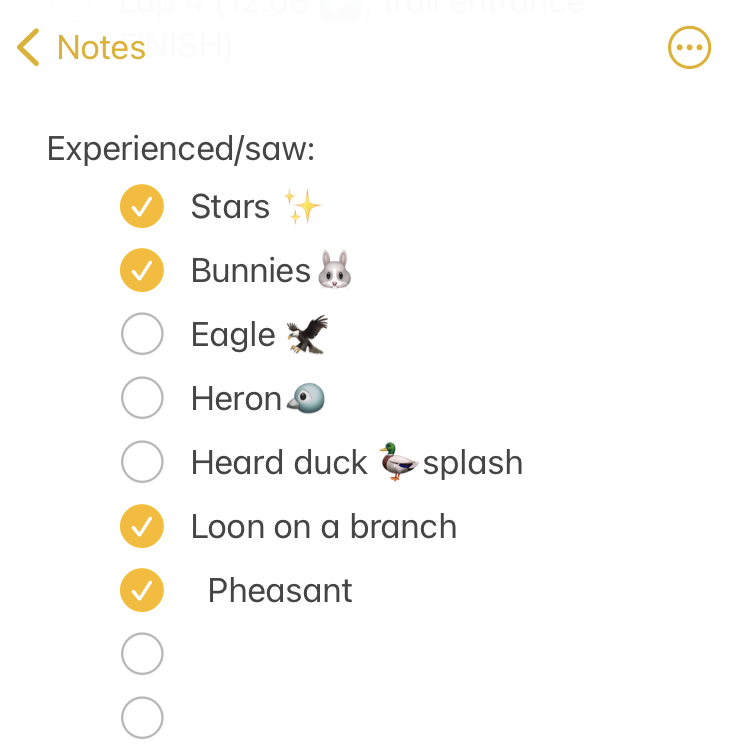 I set out at 6am, It was 33 degrees (F), so I wore shorts and a short sleeve shirt, with a pair of fleece lined pants over my shorts and a long sleeve shirt, rain jacket, ear cover, and gloves on my hand. It was dry, which helped. I was the only one out on the trail in the dark, and I had a really bright waist lamp and was running on a paved trail, so I didn’t have issues seeing or running. I felt a bit chilly but within 3 minutes could tell I would be fine temperature wise. As I got on the trail, I glanced up and grinned – the stars were out! That meant I could “check” something off my experience list at the very start. (I make a list of positive and less great experiences to ‘check off’ mentally, everything from seeing the stars or seeing bunnies or other wildlife to things like blisters, chafing, or being cold or tired or having out of whack glucose levels – to help me process and “check them off” my list and move on after problem solving, rather than dwelling on them and getting myself into a negative mood). The other thing I chuckled about at the start was passing the point where, about a half mile in to
  As I continued my run/walk, just like I do in all my training runs, I pulled my enzymes out of my left pocket, swallowed them, put them away, grabbed my fuel out of my right pocket (starting with chili cheese Fritos), then also
 I was running well and a little ahead of my expected pace, closer to my usual long run/walk paces (which have been around 14:30-14:50 min/mi lately). I was concerned it was too fast and I would burn out as so many people do, but I did have wiggle room in my paces and had planned for an eventual slow down regardless. I made it to the first turnaround, used the trail bathroom there, and continued on, noting that even with the bathroom stop factored in, I was still on or ahead of schedule. I texted Scott to let him know to check my paces earlier than he might otherwise, and also stopped in my tracks to take a picture of a quail-like bird (which Scott thinks was a pheasant) that I’d never seen before. Lap 1 continued well, and I was feeling good and maintaining an overall sub-15 pace while I had been planning for a 15:10/ish average pace, so although Scott told me he didn’t need me to warn him about being particular miles away for aid station stops, I saw he was still at home by the time I was less than a mile out, and texted him. He was finishing a work call and had to rush to finish packing and come meet me. It wouldn’t have been a big deal if he had “missed” me at the expected turnaround spot, because there’s other benches and places where we could have met after that, but I think he was still stressed out (sorry!) about it, although I wasn’t. However, he biked up to me right at the turnaround spot, grabbed my vest and headed back to our normal table for refueling, while I used the bathroom and then headed out to meet him.
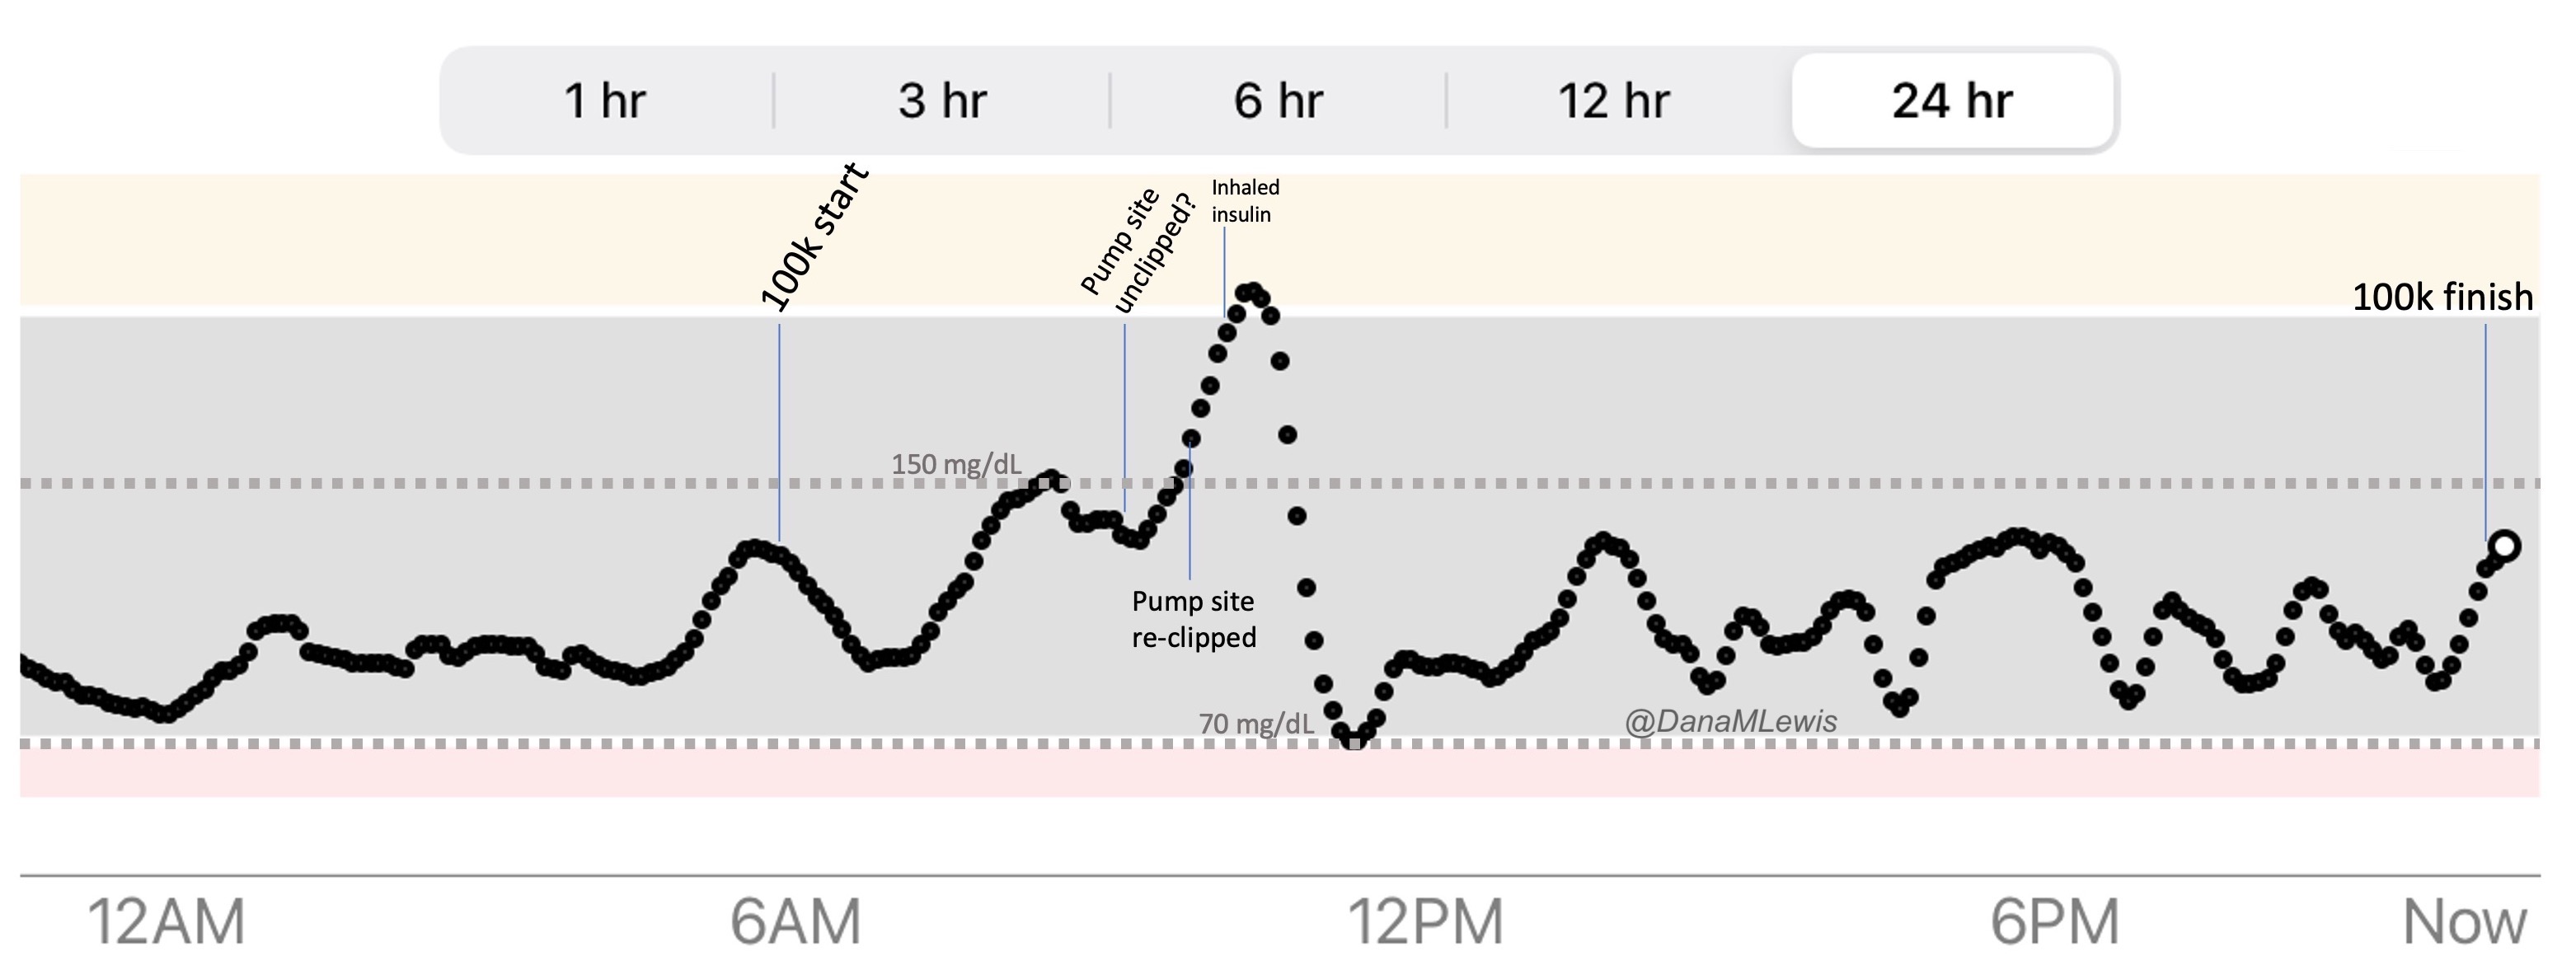
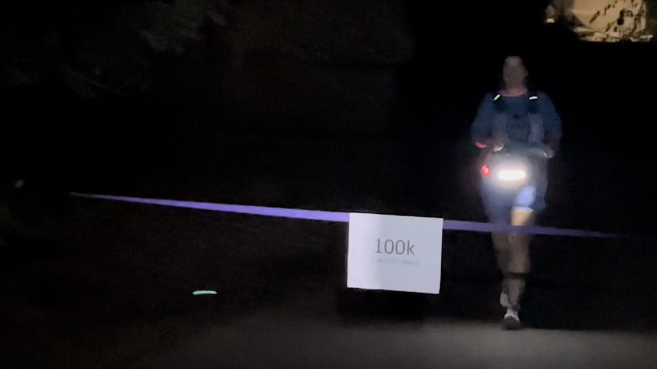
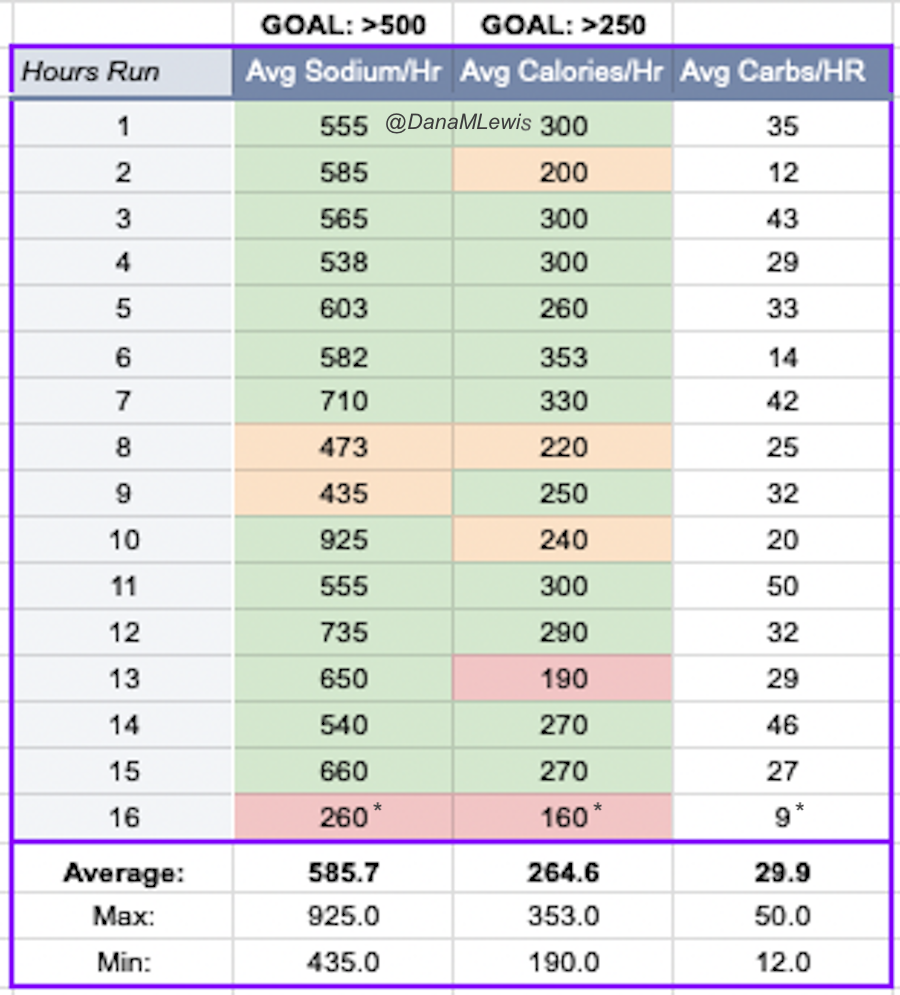 One of the things I do for all training runs but also races is
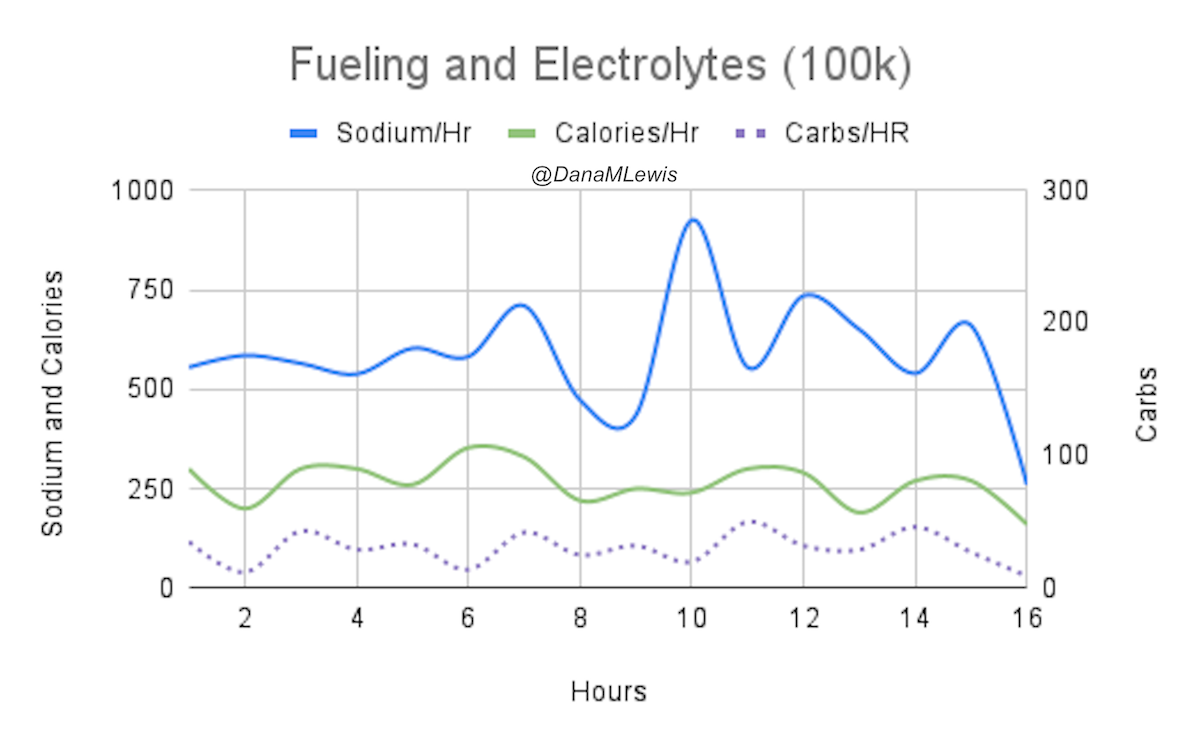
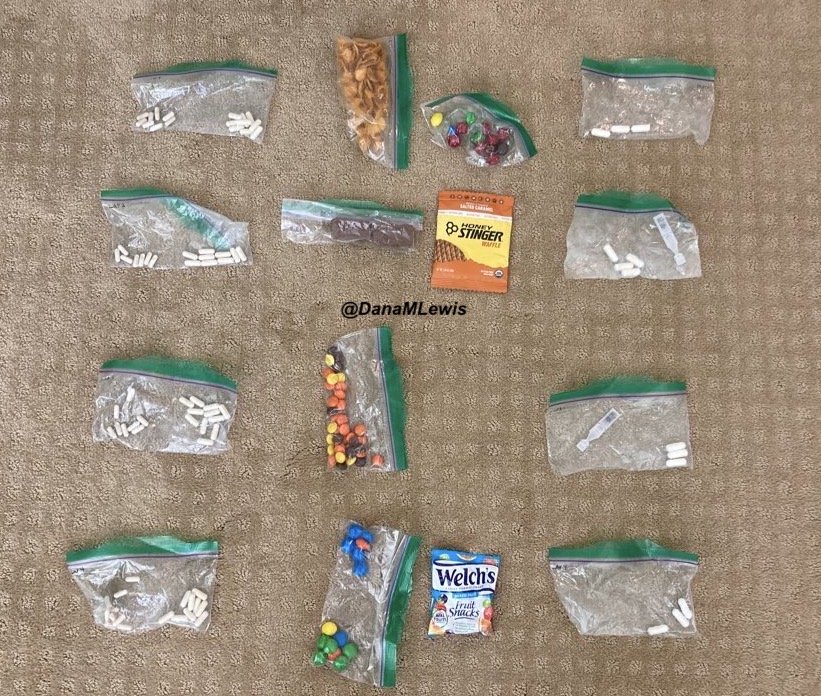
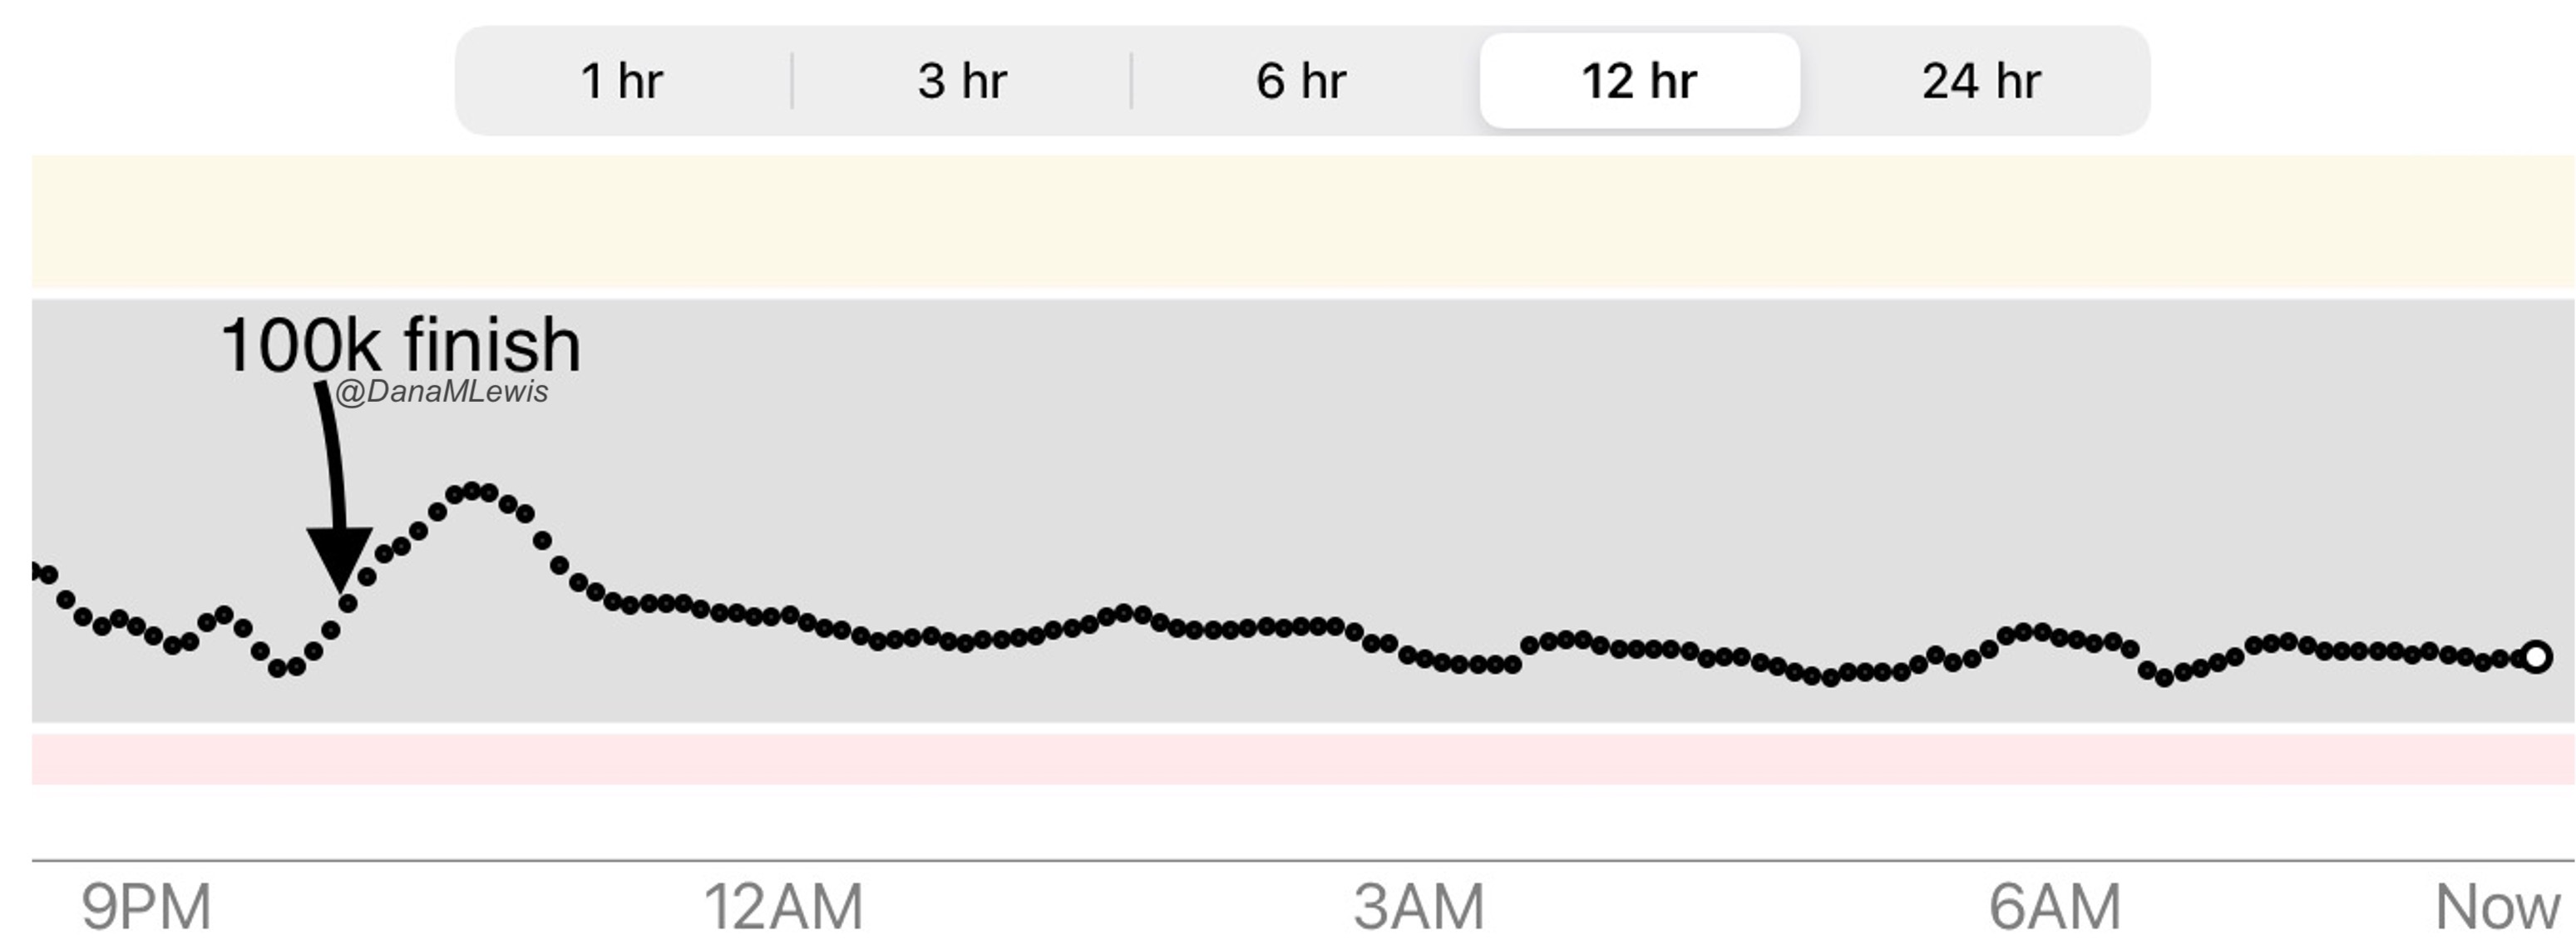

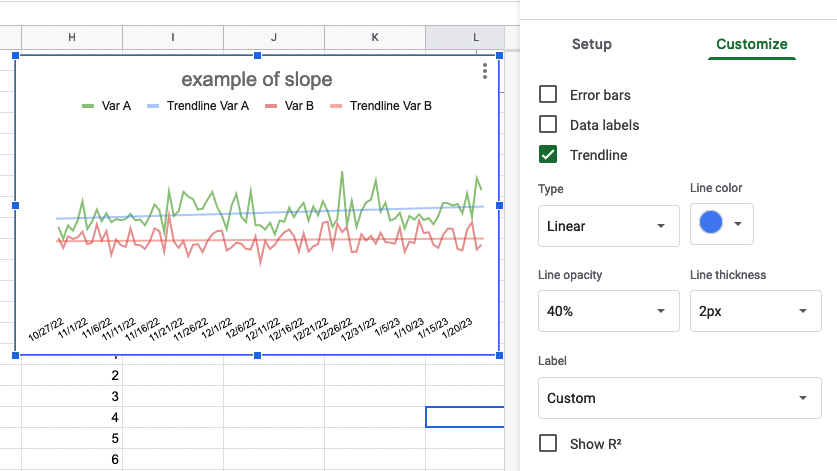
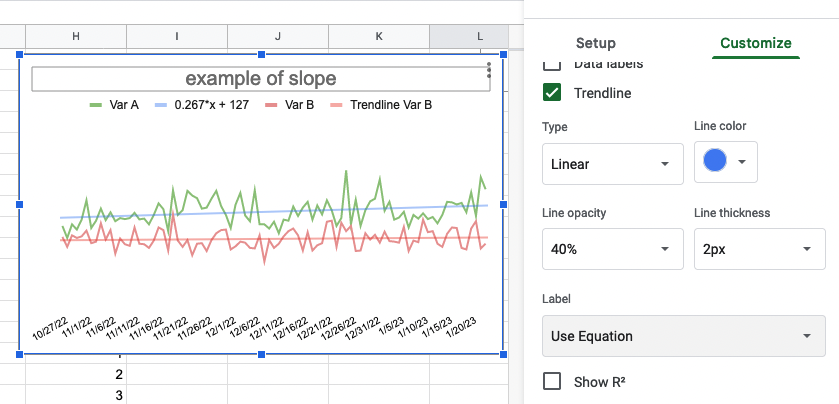
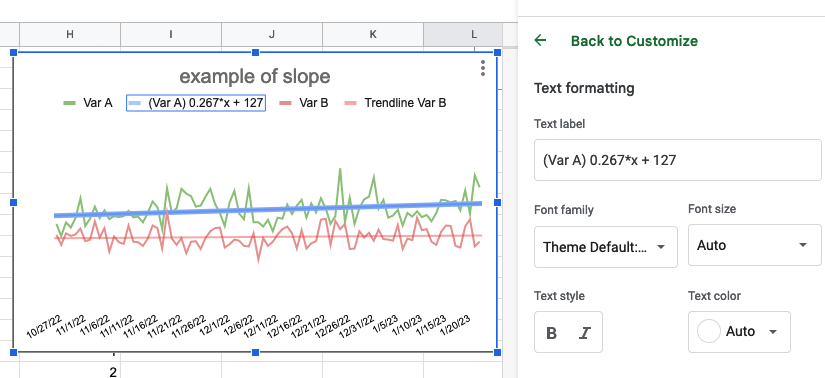
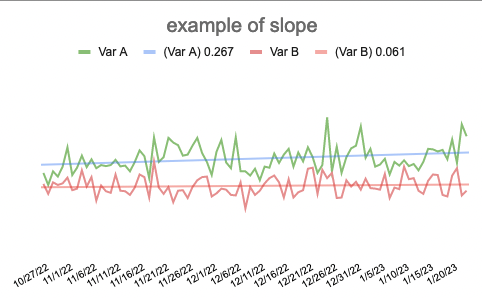
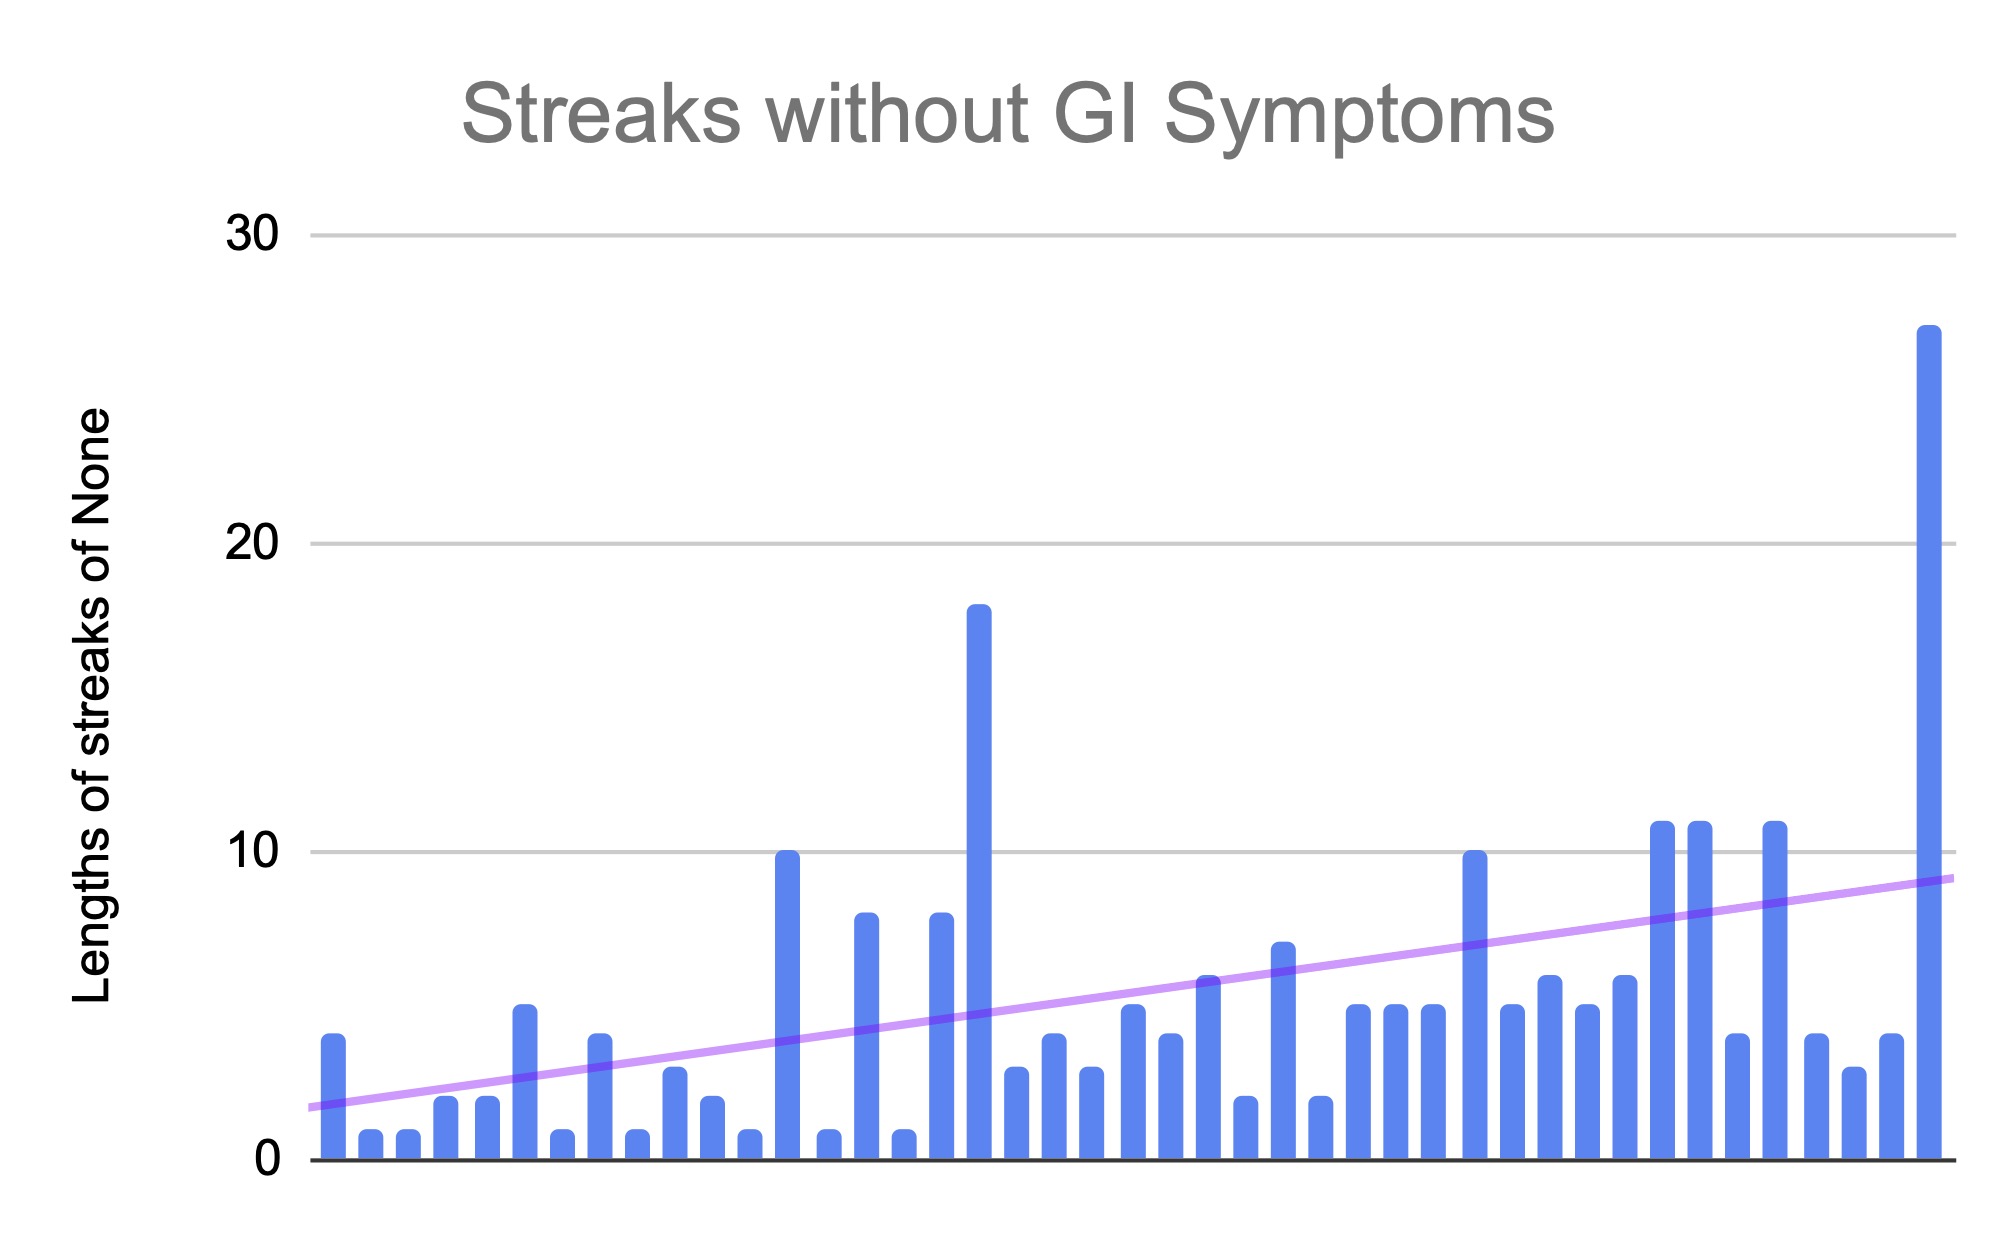
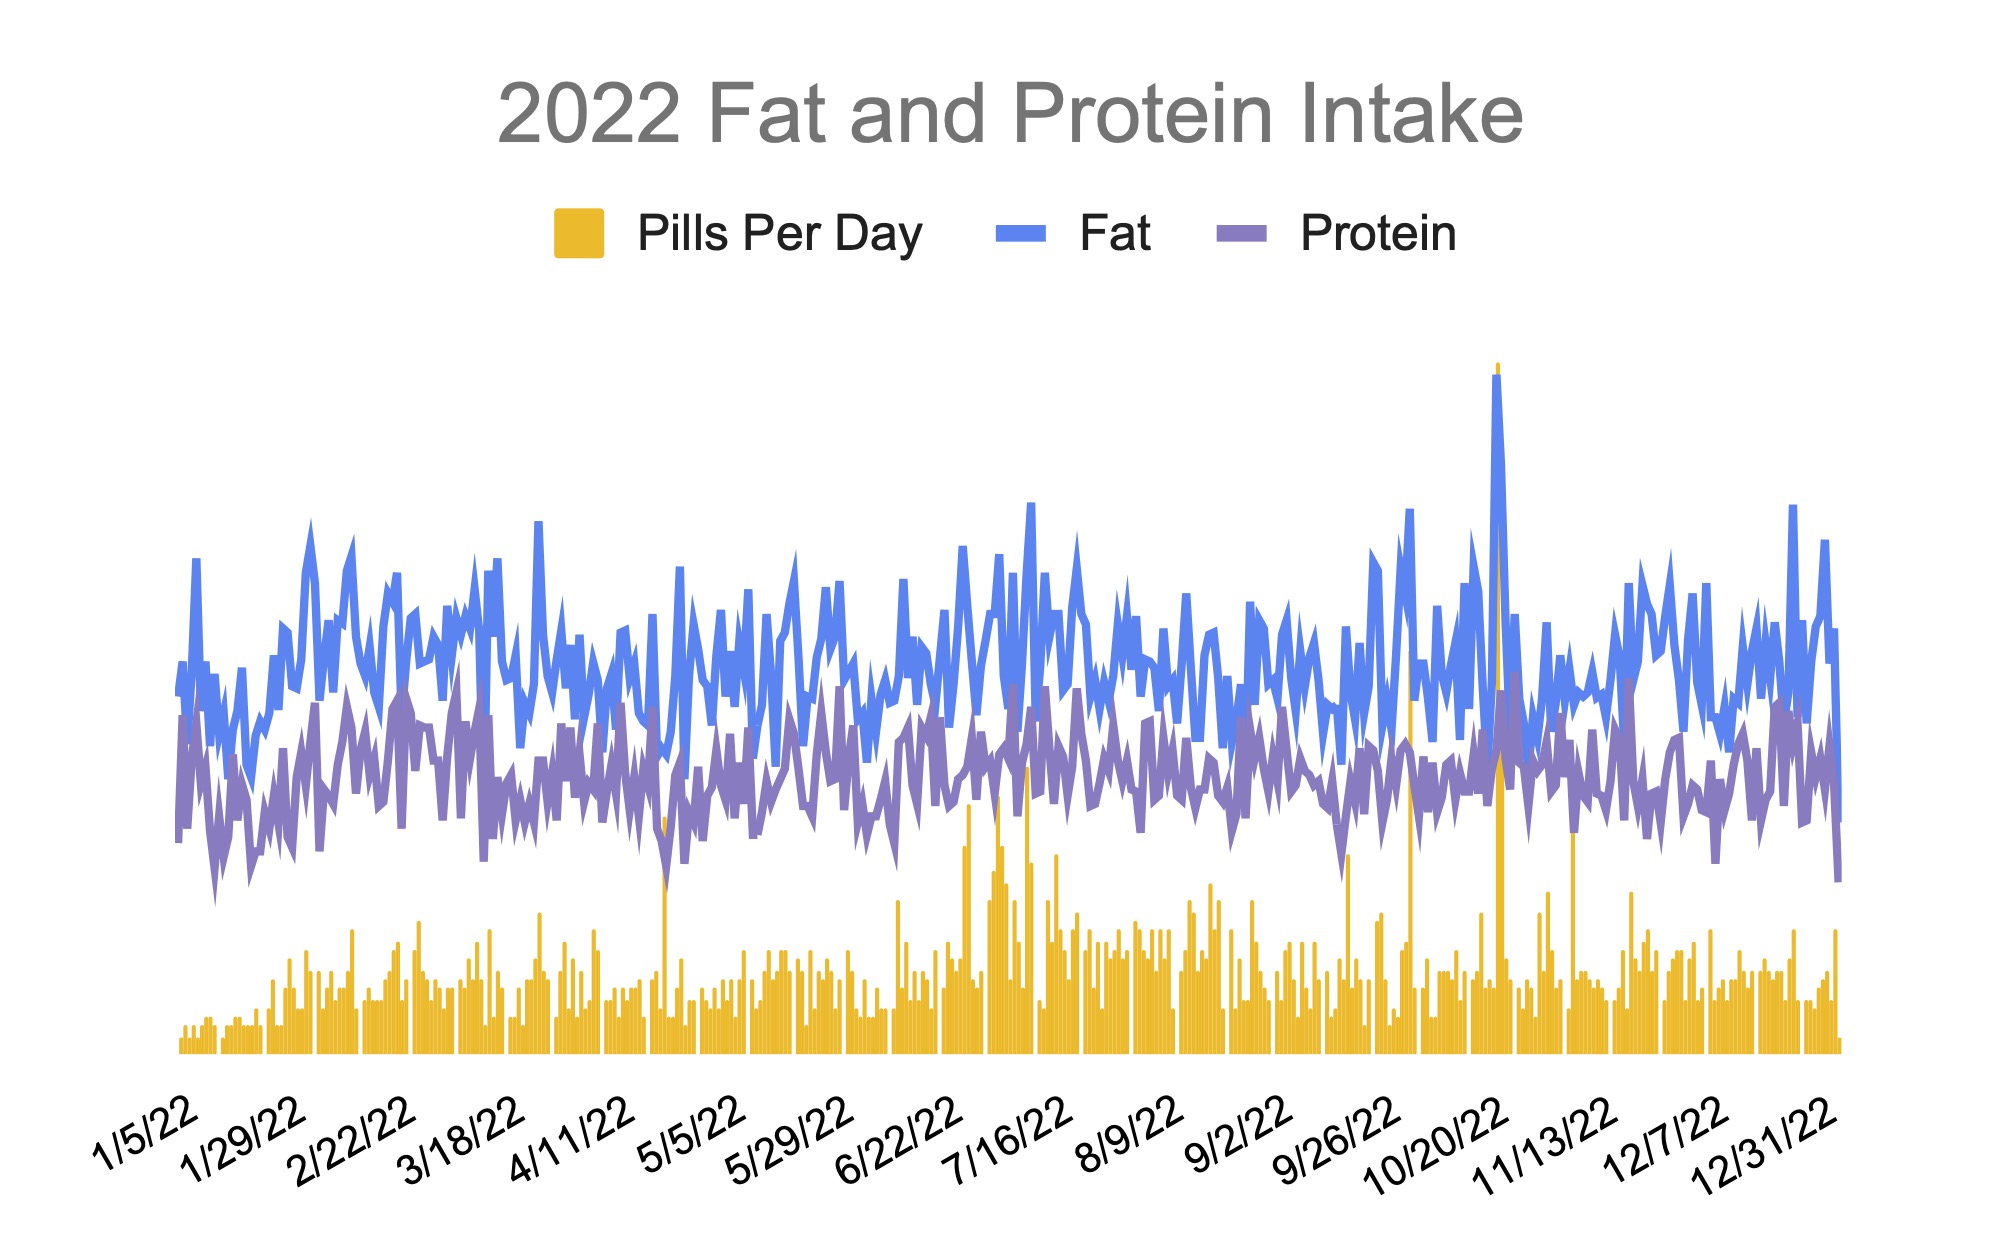

Recent Comments