New Research on Glycemic Variability Assessment In Exocrine Pancreatic Insufficiency (EPI) and Type 1 Diabetes

I am very excited to share that a new article I wrote was just published, looking at glycemic variability in data from before and after pancreatic enzyme replacement therapy (PERT) was started in someone with type 1 diabetes with newly discovered exocrine pancreatic insufficiency (EPI or PEI).

If you’re not aware of exocrine pancreatic insufficiency, it occurs when the pancreas no longer produces the amount of enzymes necessary to fully digest food. If that occurs, people need supplementary enzymes, known as pancreatic enzyme replacement therapy (PERT), to help them digest their food. (You can read more about EPI here, and I have also written other posts about EPI that you can find at DIYPS.org/EPI.)

But, like MANY medications, when someone with type 1 diabetes or other types of insulin-requiring diabetes starts taking them, there is little to no guidance about whether these medications will change their insulin sensitivity or otherwise impact their blood glucose levels. No guidance, because there are no studies! In part, this may be because of the limited tools available at the time these medications were tested and approved for their current usage. Also this is likely in part because people with diabetes make up a small fraction of the study participants that most of these medications are tested on. If there are any specific studies on the medications in people with diabetes, these studies likely were done before CGM, so little data is available that is actionable.

As a result, the opportunity came up to review someone’s data who happened to have blood glucose data from a continuous glucose monitor (CGM) as well as a log of what was eaten (carbohydrate entries) prior to commencing pancreatic enzyme replacement therapy. The tracking continued after commencing PERT and was expanded to also include fat and protein entries. As a result, there was a useful dataset to compare the impacts of pancreatic enzyme replacement therapy on blood glucose outcomes and specifically, looking at glycemic variability changes!

(You can read an author copy here of the full paper and also see the supplementary material here, and the DOI for the paper is https://doi.org/10.1177/19322968221108414 . Otherwise, below is my summary of what we did and the results!)

In addition to the above background, it’s worth noting that Type 1 diabetes is known to be associated with EPI. In upwards of 40% of people with Type 1 diabetes, elastase levels are lowered, which in other cases is correlated with EPI. However, in T1D, there is some confusion as to whether this is always the case or not. Based on recent discussions with endocrinologists who treat patients with T1D and EPI (and have patients with lowered elastase that they think don’t have EPI), I don’t think there have been enough studies looking at the right things to assess whether people with T1D and lowered elastase levels would benefit from PERT and thus have EPI. More on this in the future!

Because we now have technology such as AID (automated insulin delivery) and CGM, it’s possible to evaluate things beyond simple metrics of “average blood sugar” or “A1c” in response to taking new medications. In this paper, we looked at some basic metrics like average blood sugar and percent time in range (TIR), but we also did quite a few calculations of variables that tell us more about the level of variability in glucose levels, especially in the time frames after meals.

Methods

This person had tracked carb entries through an open source AID system, and so carb entries and BG data were available from before they started PERT. We call this “pre-PERT”, and selected 4 weeks worth of data to exclude major holidays (as diet is known to vary quite a bit during those times). We then compared this to “post-PERT”, the first 4 weeks after the person started PERT. The post-PERT data not only included BGs and carb entries, but also had fat and protein entries as well as PERT data. Each time frame included 13,975 BG data points.

We used a series of open source tools to get the data (Nightscout -> Nightscout Data Transfer Tool -> Open Humans) and process the data (my favorite Unzip-Zip-CSVify-OpenHumans-data.sh script).

All of our code for this paper is open source, too! Check it out here. We analyzed time in range, TIR 70-180, time out of range, TOR >180, time below range, TBR <70 and <54, the number of hyperglycemic excursions >180. We also calculated total daily dose of insulin, average carbohydrate intake, and average carbohydrate entries per day. Then we calculated a series of variability related metrics such as Low Blood Glucose Index (LBGI), High Blood Glucose Index (HBGI), Coefficient of Variation (CV), Standard Deviation (SD), and J_index (which stresses both the importance of the mean level and variability of glycemic levels).

Results

This person already had an above-goal TIR. Standard of care goal for TIR is >70%; before PERT they had 92.12% TIR and after PERT it was 93.70%. Remember, this person is using an open source AID! TBR <54 did not change significantly, TBR <70 decreased slightly, and TOR >180 also decreased slightly.

More noticeably, the total number of unique excursions above 180 dropped from 40 (in the 4 weeks without PERT) to 26 (in 4 weeks when using PERT).

The paper itself has a few more details about average fat, protein, and carb intake and any changes. Total daily insulin was relatively similar, carb intake decreased slightly post-PERT but was trending back upward by the end of the 4 weeks. This is likely an artifact of being careful to adjust to PERT and dose effectively for PERT. The number of meals decreased but the average carb entry per meal increased, too.

What I find really interesting is the assessment we did on variability, overall and looking at specific meal times. The breakfast meal was identical during both time periods, and this is where you can really SEE visible changes pre- and post-PERT. Figure 2 (displayed below), shows the difference in the rate of change frequency. There’s less of the higher rate of changes (red) post-PERT than there is from pre-PERT (blue).

Figure 2 from GV analysis on EPI, showing lower frequency of high rate of change post-PERT

Similarly, figure 3 from the paper shows all glucose data pre- and post-PERT, and you can see the fewer excursions >180 (blue dotted line) in the post-PERT glucose data.

Figure 3 from GV analysis paper on EPI showing lower number of excursions above 180 mg/dL

Table 1 in the paper has all the raw data, and Figure 1 plots the most relevant graphs side by side so you can see pre- and post-PERT before and after after all meals on the left, versus pre and post-PERT before and after breakfast only. Look at TOR >180 and the reduction in post-breakfast levels after PERT! Similarly, HBGI post-PERT after-breakfast is noticeably different than HBGI pre-PERT after-breakfast.

Here’s a look at the HBGI for breakfast only, I’ve highlighted in purple the comparison after breakfast for pre- and post-PERT:

High Blood Glucose Index (HBGI) pre- and post-PERT for breakfast only, showing reduction in post-PERT after breakfast

Discussion

This is a paper looking at n=1 data, but it’s not really about the n=1 here. (See the awesome limitation section for more detail, where I point out it’s n=1, it’s not a clinical study, the person has ‘moderate’ EPI, there wasn’t fat/protein data from pre-PERT, it may not be representative of all people with diabetes with EPI or EPI in general.)

What this paper is about is illustrating the types of analyses that are possible, if only we would capture and analyze the data. There are gaping holes in the scientific knowledge base: unanswered and even unasked questions about what happens to blood glucose with various medications, and this data can help answer them! This data shows minimal changes to TIR but visible and significant changes to post-meal glycemic variability (especially after breakfast!). Someone who had a lower TIR or wasn’t using an open source AID may have more obvious changes in TIR following PERT commencement.

This paper shows several ways we can more easily detect efficacy of new-onset medications, whether it is enzymes for PERT or other commonly used medications for people with diabetes.

For example, we could do a similar study with metformin, looking at early changes in glycemic variability in people newly prescribed metformin. Wouldn’t it be great, as a person with diabetes, to be able to more quickly resolve the uncertainty of “is this even working?!” and not have to suffer through potential side effects for 3-6 months or longer waiting for an A1c lab test to verify whether the metformin is having the intended effects?

Specifically with regards to EPI, it can be hard for some people to tell if PERT “is working”, because they’re asymptomatic, they are relying on lab data for changes in fat soluble vitamin levels (which may take time to change following PERT commencement), etc. It can also be hard to get the dosing “right”, and there is little guidance around titrating in general, and no studies have looked at titration based on macronutrient intake, which is something else that I’m working on. So, having a method such as these types of GV analysis even for a person without diabetes who has newly discovered EPI might be beneficial: GV changes could be an earlier indicator of PERT efficacy and serve as encouragement for individuals with EPI to continue PERT titration and arrive at optimal dosing.

Conclusion

As I wrote in the paper:

It is possible to use glycemic variability to assess changes in glycemic outcomes in response to new-onset medications, such as pancreatic enzyme replacement therapy (PERT) in people with exocrine pancreatic insufficiency (EPI) and insulin-requiring diabetes. More studies should use AID and CGM data to assess changes in glycemic outcomes and variability to add to the knowledge base of how medications affect glucose levels for people with diabetes. Specifically, this n=1 data analysis demonstrates that glycemic variability can be useful for assessing post-PERT response in someone with suspected or newly diagnosed EPI and provide additional data points regarding the efficacy of PERT titration over time.

I’m super excited to continue this work and use all available datasets to help answer more questions about PERT titration and efficacy, changes to glycemic variability, and anything else we can learn. For this study, I collaborated with the phenomenal Arsalan Shahid, who serves as technology solutions lead at CeADAR (Ireland’s Centre for Applied AI at University College Dublin), who helped make this study and paper possible. We’re looking for additional collaborators, though, so feel free to reach out if you are interested in working on similar efforts or any other research studies related to EPI!

A DIY Fuel Enzyme Macronutrient Tracker for Running Ultras (Ultramarathons)

It takes a lot of energy to run ultramarathons (ultras).

To ensure they have enough fuel to complete the run, people usually want to eat X-Y calories per hour, or A-B carbs per hour, while running ultramarathons. It can be hard to know if you’re staying on top of fueling, especially as the hours drag on and your brain gets tired; plus, you can be throwing away your trash as you go so you may not have a pile of wrappers to tell you what you ate.

During training, it may be useful to have a written record of what you did for each run, so you can establish a baseline and work on improving your fueling if that’s something you want to focus on.

For me specifically, I also find it helpful to record what enzyme dosing I am taking, as I have EPI (exocrine pancreatic insufficiency, which you can read more about here) and if I have symptoms it can help me identify where my dosing might have been off from the previous day. It’s not only the amount of enzymes but also the timing that matters, alongside the timing of carbs and insulin, because I have type 1 diabetes, celiac, and EPI to juggle during runs.

Previously, I’ve relied on carb entries to Nightscout (an open source CGM remote monitoring platform which I use for visualizing diabetes data including OpenAPS data) as a record of what I ate, because I know 15g of carbs tracks to a single serving of chili cheese Fritos that are 10g of fat and 2g of protein, and I take one lipase-only and one pancrelipase (multi-enzyme) pill for that; and 21g of carbs is a Honey Stinger Gluten Free Stroopwaffle that is 6g of fat and 1g of protein, and I typically take one lipase-only. You can see from my most recent ultra (a 50k) where I manually took those carb entries and mapped them on to my blood sugar (CGM) graph to visualize what happened in terms of fuel and blood sugar over the course of my ultra.

However, that was “just” a 50k and I’m working toward bigger runs: a 50 mile, maybe a 100k (62 miles), and/or a 100 mile, which means instead of running for 7-8 hours I’ll be running for 12-14 and 24-30(ish) hours! That’s a lot of fuel to need to eat, and to keep track of, and I know from experience my brain starts to get tired of thinking about and eating food around 7 hours. So, I’ll need something better to help me keep track of fuel, enzymes, and electrolytes over the course of longer runs.

I also am planning on being well supported by my “crew” – my husband Scott, who will e-bike around the course of my ultra or my DIY ultra loops and refill my pack with water and fuel. In some cases, with a DIY ultra, he’ll be bringing food from home that I pre-made and he warms up in the microwave.

One of the strategies I want to test is for him to actually hand me the enzymes for the food he’s bringing me. For example, hand me a baggie of mashed potatoes and also hand me the one multi-enzyme (pancrelipase, OTC) pill I need to go with it. That reduces mental effort for me to look up or remember what enzyme amount I take for mashed potatoes; saves me from digging out my baggie of enzymes and having to get the pill out and swallow it, put the baggie away without dropping it, all while juggling the snack in my hands.

He doesn’t necessarily know the counts of enzymes for each fuel (although he could reproduce it, it’s better if I pre-make a spreadsheet library of my fuel options and that helps me both just pick it off a drop down and have an easy reference for him to glance at. He won’t be running 50-100 miles, but he will be waking up every 2-3 hours overnight and that does a number on his brain, too, so it’s easier all around if he can just reference the math I’ve already done!

So, for my purposes: 1) easy tracking of fuel counts for real-time “am I eating according to plan” and 2) retrospective “how did I do overall and should I do something next time” and 3) for EPI and BG analysis (“what should I do differently if I didn’t get the ideal outcome?”), it’s ideal to have a tracking spreadsheet to log my fuel intake.

Here’s what I did to build my ultimate fuel self-tracking self-populating spreadsheet:

First, I created a tab in my spreadsheet as a “Fuel Library”, where I listed out all of my fuel. This ranges from snacks (chili cheese Fritos; Honey Stinger Gluten Free Stroopwaffle; yogurt-covered pretzels, etc.); to fast-acting carbs (e.g. Airhead Minis, Circus Peanuts) that I take for fixing blood sugars; to other snack/treats like chocolate candy bars or cookies; as well as small meals and warm food, such as tomato soup or part of a ham and cheese quesadilla. (All gluten free, since I have celiac. Everything I ever write about is always gluten free!)

After I input the list of snacks, I made columns to input the sodium, calories, fat, protein, and carb counts. I don’t usually care about calories but a lot of recommendations for ultras are calories/hr and carbs/hr. I tend to be lower on the carb side in my regular daily consumption and higher on fat than most people without T1D, so I’m using the calories for ultrarunning comparison to see overall where I’m landing nutrient-wise without fixating on carbs, since I have T1D and what I personally prefer for BG management is likely different than those without T1D.

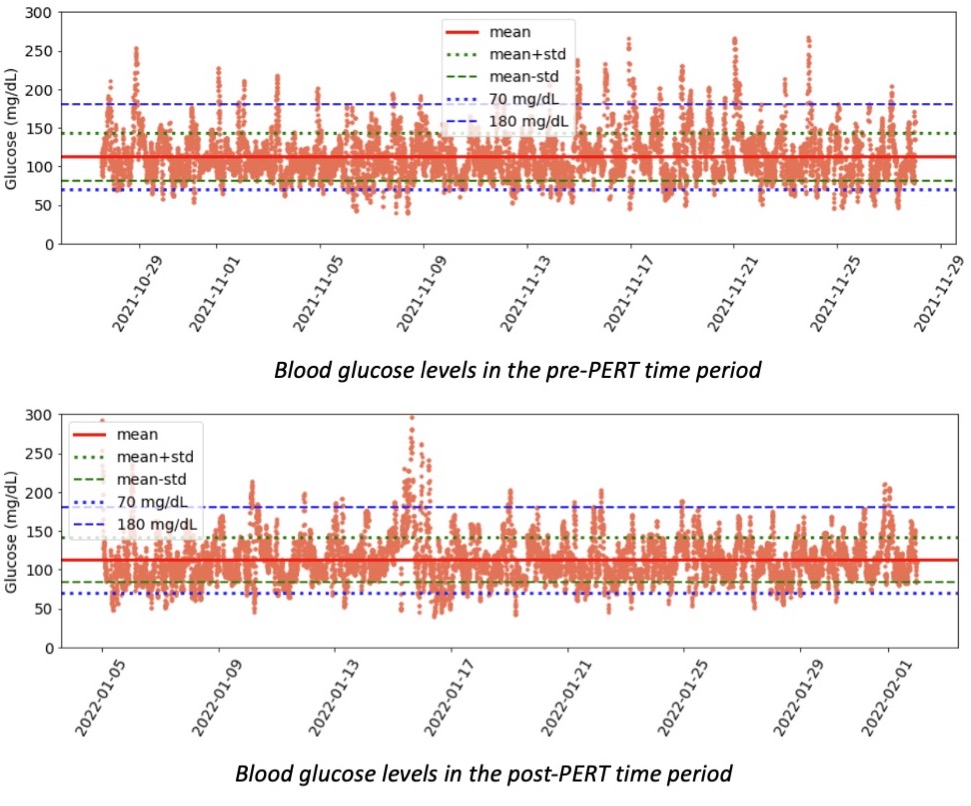
I also input the goal amount of enzymes. I have three different types of pills: a prescription pancrelipase (I call PERT, which stands for pancreatic enzyme replacement therapy, and when I say PERT I’m referring to the expensive, prescription pancrelipase that’s been tested and studied for safety and efficacy in EPI); an over-the-counter (OTC) lipase-only pill; and an OTC multi-enzyme pancrelipase pill that contains much smaller amounts of all three enzymes (lipase, protease, amylase) than my PERT but hasn’t been tested for safety and efficacy for EPI. So, I have three enzyme columns: Lipase, OTC Pancrelipase, and PERT. For each fuel I calculate which I need (usually one lipase, or a lipase plus a OTC pancrelipase, because these single servings are usually fairly low fat and protein; but for bigger meal-type foods with more protein I may ‘round up’ and choose to take a full PERT, especially if I eat more of it), and input the number in the appropriate column.

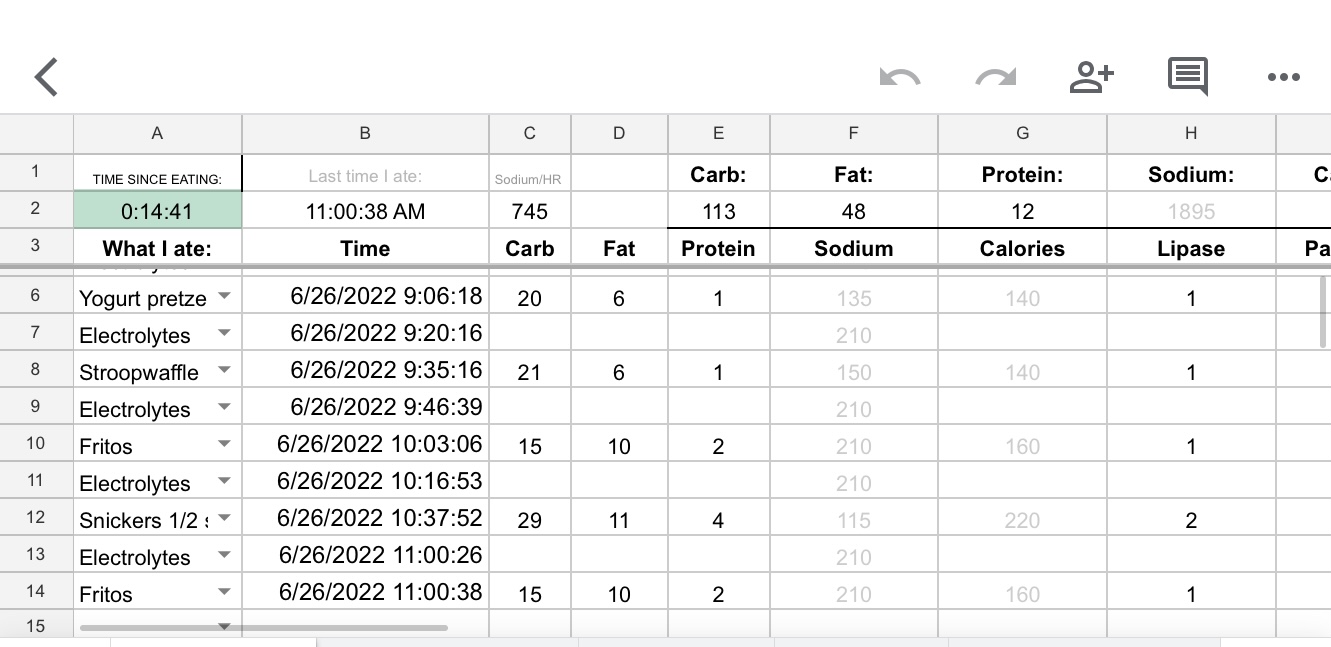
Then, I opened another tab on my spreadsheet. I created a row of headers for what I ate (the fuel); time; and then all the macronutrients again. I moved this down to row 3, because I also want to include at the top of the spreadsheet a total of everything for the day.

Example-DIY-Fuel-Enzyme-Tracker-ByDanaMLewis

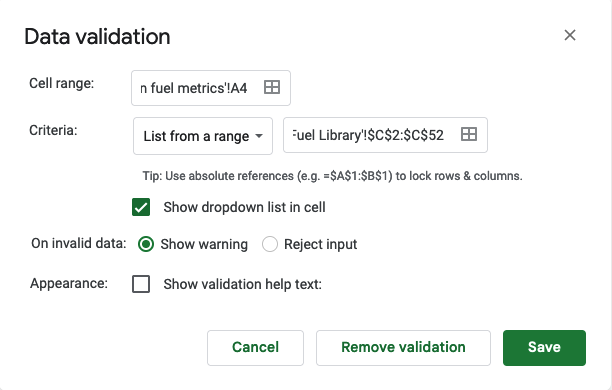
In Column A, I selected the first cell (A4) for me, then went to Data > Data Validation and clicked on it. It opens this screen, which I input the following – A4 is the cell I’m in for “cell range”, the criteria is “list from a range”, and then I popped over to the tab with my ‘fuel library’ and highlighted the relevant data that I wanted to be in the menu: Food. So that was C2-C52 for my list of food. Make sure “show dropdown list in cell” is marked, because that’s what creates the dropdown in the cell. Click save.

Use the data validation section to choose to show a dropbox in each cell

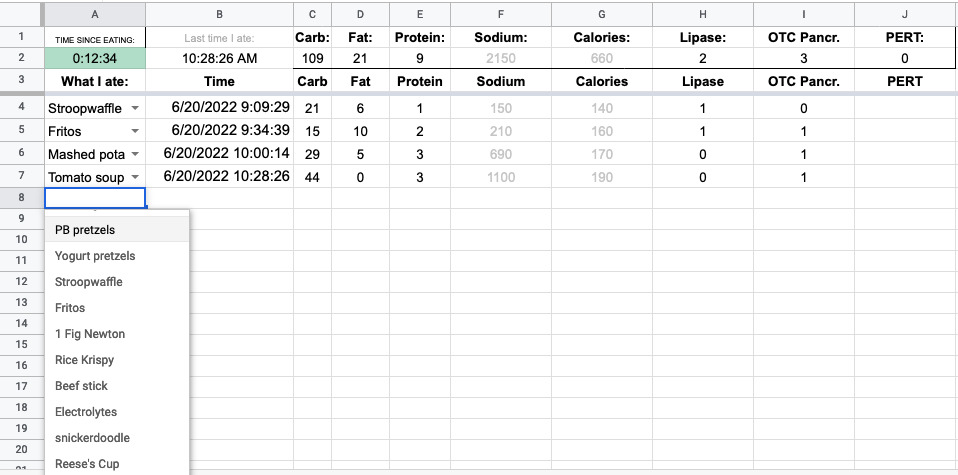
You’ll want to drag that down to apply the drop-down to all the cells you want. Mine now looked like this, and you can see clicking the dropdown shows the menu to tap on.

Clicking a dropbox in the cell brings up the "menu" of food options from my Fuel Library tab

After I selected from my menu, I wanted column B to automatically put in the time. This gets obnoxious: google sheets has NOW() to put in the current time, but DO NOT USE THIS as the formula updates with the latest time any time you touch the spreadsheet.

I ended up having to use a google script (go to “Extensions” > Apps Script, here’s a tutorial with more detail) to create a function called onEdit() that I could reference in my spreadsheet. I use the old style legacy script editor in my screenshot below.

Older style app script editor for adding scripts to spreadsheet, showing the onEdit() function (see text below in post for what the script is)

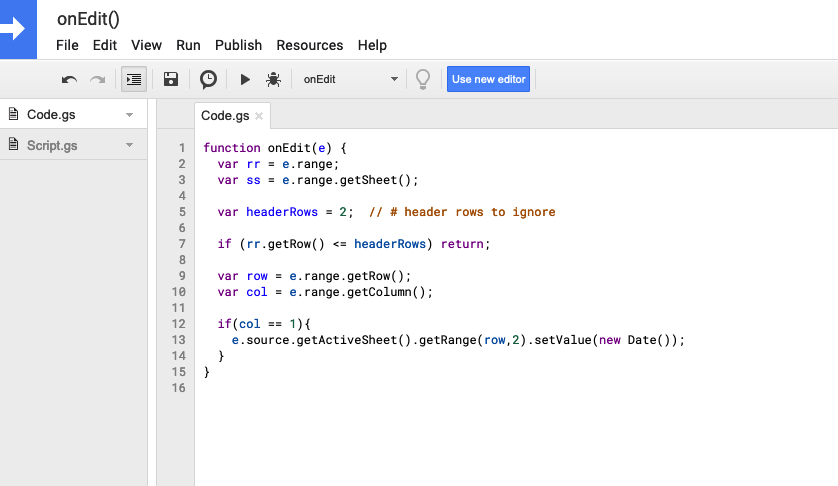
Code I used, if you need to copy/paste:

function onEdit(e) {

var rr = e.range;

var ss = e.range.getSheet();

var headerRows = 2;  // # header rows to ignore

if (rr.getRow() <= headerRows) return;

var row = e.range.getRow();

var col = e.range.getColumn();

if(col == 1){

e.source.getActiveSheet().getRange(row,2).setValue(new Date());

}

}

After saving that script (File > Save), I went back to my spreadsheet and put this formula into the B column cells: =IFERROR(onEdit(),””). It fills in the current date/time (because onEdit tells it to if the A cell has been updated), and otherwise sits with a blank until it’s been changed.

Note: if you test your sheet, you’ll have to go back and paste in the formula to overwrite the date/time that gets updated by the script. I keep the formula without the “=” in a cell in the top right of my spreadsheet so I can copy/paste it when I’m testing and updating my sheet. You can also find it in a cell below and copy/paste from there as well.

Next, I wanted to populate my macronutrients on the tracker spreadsheet. For each cell in row 4, I used a VLOOKUP with the fuel name from A4 to look at the sheet with my library, and then use the column number from the fuel library sheet to reference which data element I want. I actually have things in a different order in my fuel library and my tracking sheet; so if you use my template later on or are recreating your own, pay attention to matching the headers from your tracker sheet and what’s in your library. The formula for this cell ended up being “=IFERROR(VLOOKUP(A4,’Fuel Library’!C:K,4, FALSE),””)”, again designed to leave the column blank if column A didn’t have a value, but if it does have a value, to prefill the number from Column 4 matching the fuel entry into this cell. Columns C-J on my tracker spreadsheet all use that formula, with the updated values to pull from the correctly matching column, to pre-populate my counts in the tracker spreadsheet.

Finally, the last thing I wanted was to track easily when I last ate. I could look at column B, but with a tired brain I want something more obvious that tracks how long it’s been. This also is again to maybe help Scott, who will be tasked with helping me stay on top of things, be able to check if I’m eating regularly and encourage me gently or less gently to be eating more as the hours wear on in my ultras.

I ended up creating a cell in the header that would track the last entry from column B. To do this, the formula I found is “INDEX(B4:B,MATCH(143^143,B4:B))”, which checks for the last number in column B starting in B4 and onward. It correctly pulls in the latest timestamp on the list.

Then, in another cell, I created “=NOW()-B2”, which is a good use for the NOW() formula I warned about, because it’s constantly updating every time the sheet gets touched, so that any time I go to update it’ll tell me how long it’s been since between now and the last time I ate.

But, that only updates every time I update the sheet, so if I want to glance at the sheet, it will be only from the last time I updated it… which is not what I want. To fix it, I need to change the autorefresh calculation settings. Go to File > Settings. Click “Calculations” tab, and the first drop down you want to change to be “On change and every minute”.

Under File > Settings there is a "Calculate" tab with a dropdown menu to choose to update on change plus every minute

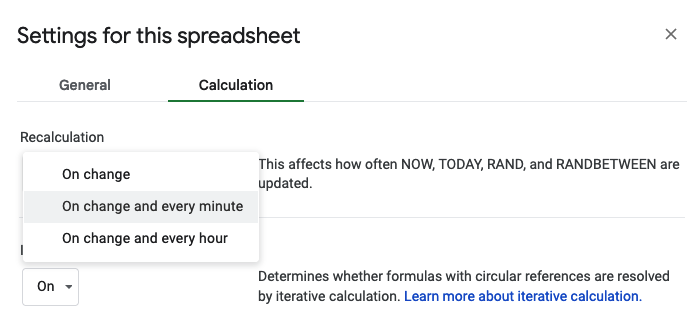
Now it does what I want, updating that cell that uses the NOW() formula every minute, so this calculation is up to date even when the sheet hasn’t been changed!

However, I also decided I want to log electrolytes in my same spreadsheet, but not include it in my top “when did I last eat” calculator. So, I created column K and inserted the formula IF(A4=”Electrolytes”,””,B4), which checks to see if the Dropdown menu selection was Electrolytes. If so, it doesn’t do anything. If it’s not electrolytes, it repeats the B4 value, which is my formula to put the date and time. Then, I changed B2 to index and match on column K instead of B. My B2 formula now is INDEX(K4:K,MATCH(143^143,K4:K)), because K now has the food-only list of date and time stamps that I want to be tracking in my “when did I last eat” tracker. (If you don’t log electrolytes or don’t have anything else to exclude, you can keep B2 as indexing and matching on column B. But if you want to exclude anything, you can follow my example of using an additional column (my K) to check for things you do want to include and exclude the ones you don’t want. Also, you can hide columns if you don’t want to see them, so column K (or your ‘check for exclusions’ column wherever it ends up) could be hidden from view so it doesn’t distract your brain.

I also added conditional formatting to my tracker. Anytime A2, the time since eaten cell, is between 0-30 minutes, it’s green: indicating I’m on top of my fueling. 30-45 minutes it turns yellow as a warning that it’s time to eat. After 45 minutes, it’ll turn light red as a strong reminder that I’m off schedule.

I kept adding features, such as totaling my sodium consumption per hour, too, so I could track electrolytes+fuel sodium totals. Column L gets the formula =IF(((ABS((NOW()-B4))*1440)<60),F4,””) to check for the difference between the current time and the fuel entry, multiplying it by 1440 to convert to minutes and checking to see that it’s less than 60 minutes. If it is, then it prints the sodium value, and otherwise leaves it blank. (You could skip the ABS part as I was testing current, past, and future values and wanted it to stop throwing errors for future times that were calculated as negatives in the first argument). I then in C2 calculate the sum of those values for the total sodium for that hour, using =SUM(L4:L)

(I thought about tracking the past sodium per hour values to average and see how I did throughout the run on an hourly basis…but so far on my 3 long runs where I’ve used the spreadsheet, the very fact that I am using the tracker and glancing at the hourly total has kept me well on top of sodium and so I haven’t need that yet. However, if I eventually start to have long enough runs where this is an issue, I’ll probably go back and have it calculate the absolute hour sodium totals for retrospective analysis.)

This works great in the Google Sheets app on my phone, which is how I’ll be updating it during my ultras, although Scott can have it open on a browser tab when he’s at home working at his laptop. Every time I go for a long training run, I duplicate the template tab and label it with the date of the run and use it for logging my fueling.

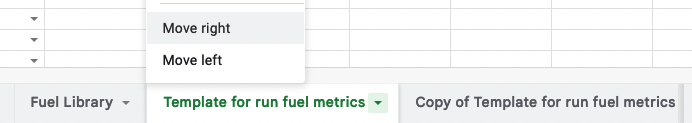
(PS – if you didn’t know, you can rearrange the order of tabs in your sheet, so you can drag the one you want to be actively using to the left. This is useful in case the app closes on your phone and you’re re-opening the sheet fresh, so you don’t have to scroll to re-find the correct tab you want to be using for that run. In a browser, you can either drag and drop the tabs, or click the arrow next to the tab name and select “move left” or “move right”.)

Clicking the arrow to the right of a tab name in google sheets brings up a menu that includes the option to move the tab left or right

Click here to make a copy of my spreadsheet.

If you click to make a copy of a google spreadsheet, it pops up a link confirming you want to make a copy, and also might bring the app script functionality with it. If so, you can click the button to view the script (earlier in the blog post). If it doesn't include the warning about the script, remember to add the script yourself after you make a copy.

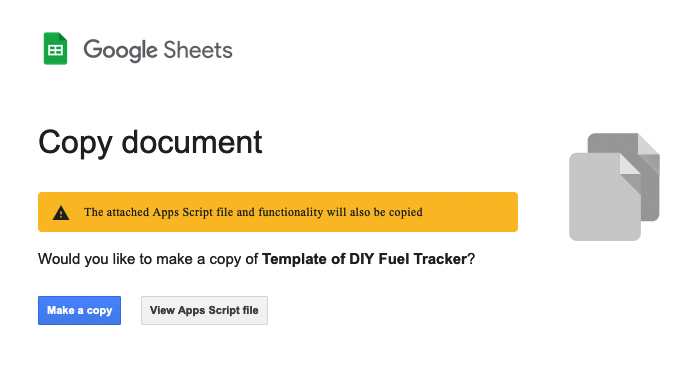
Take a look at my spreadsheet after you make a copy (click here to generate a copy if you didn’t use the previous mentioned link), and you’ll note in the README tab a few reminders to modify the fuel library and make sure you follow the steps to ensure that the script is associated with the sheet and validation is updated.

Obviously, you may not need lipase/pancrelipase/PERT and enzyme counts; if you do, your counts of enzymes needed and types of enzyme and quantity of enzymes will need updating; you may not need or want all of these macronutrients; and you’ll definitely be eating different fuel than I am, so you can update it however you like with what you’re eating and what you want to track.

This spreadsheet and the methods for building it can also be used for other purposes, such as tracking wait times or how long it took you to do something, etc.

(If you do find this blog post and use this spreadsheet concept, let me know – I’d love to hear if this is useful for you!)
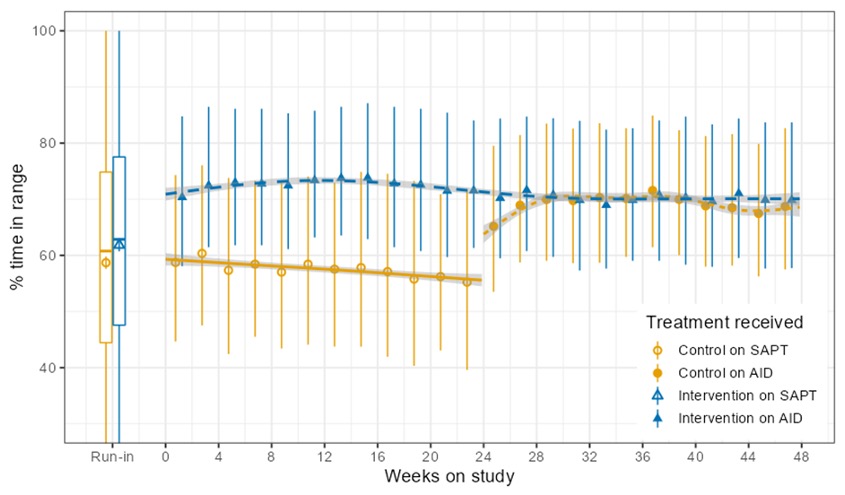
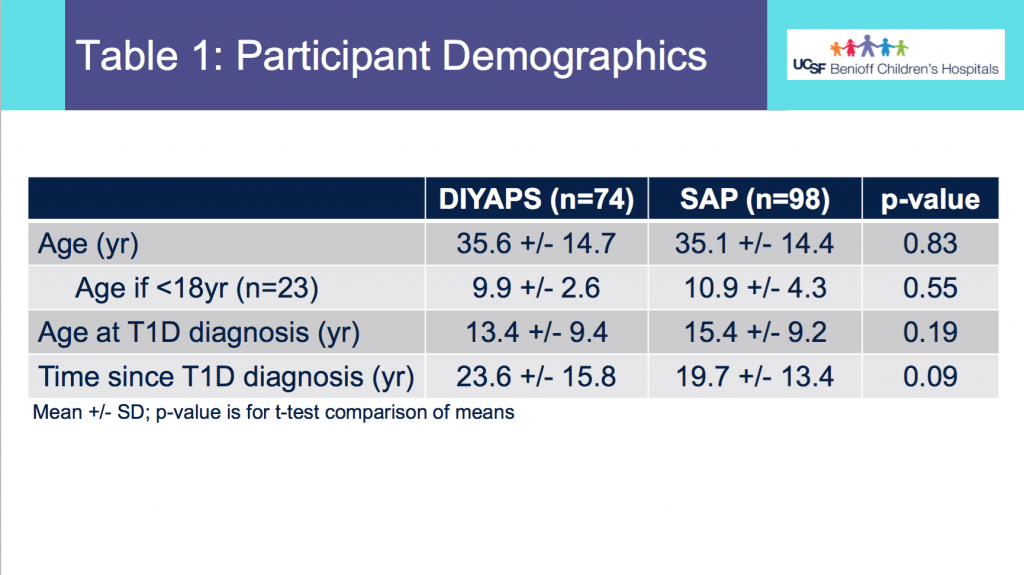
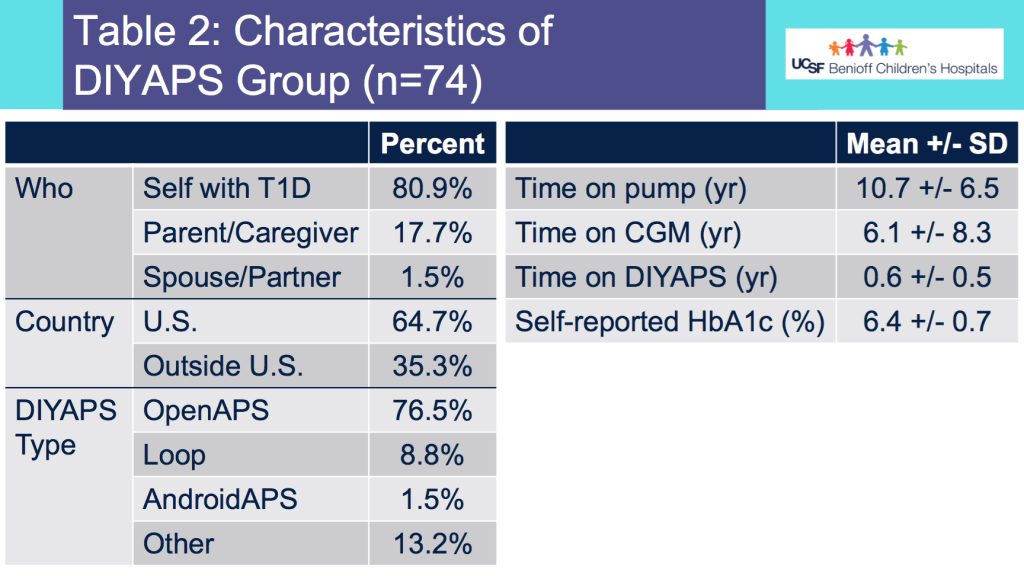
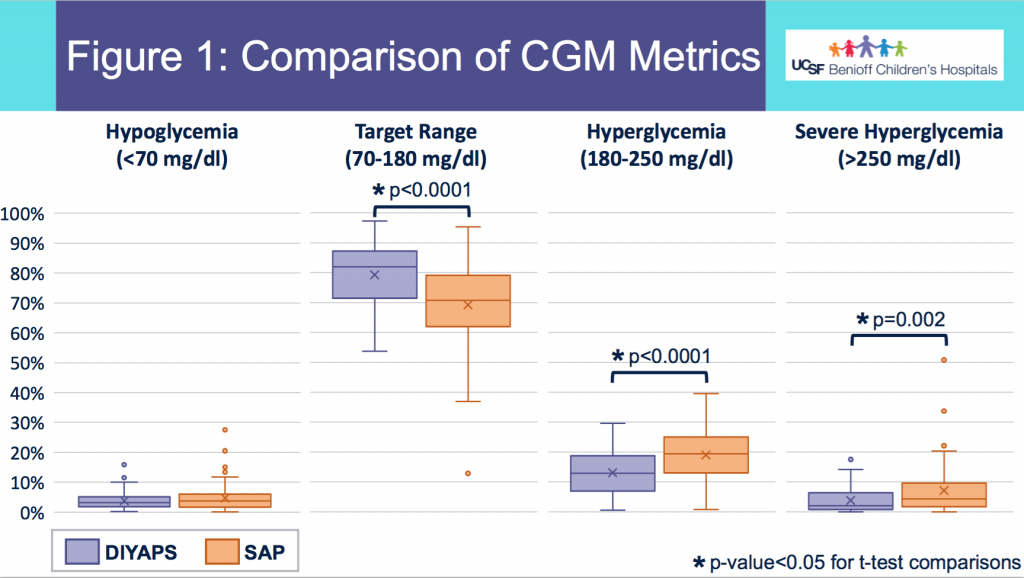
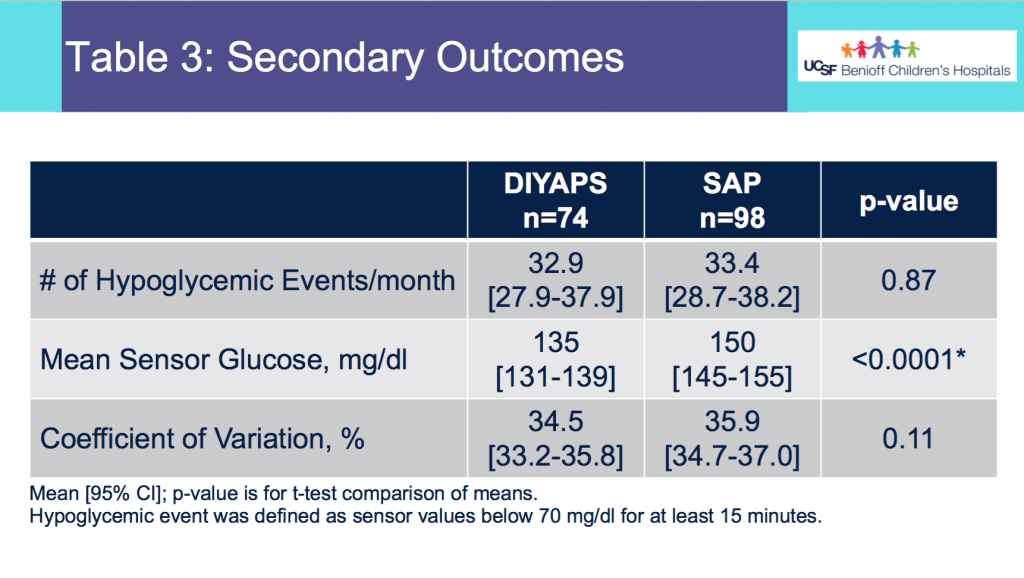
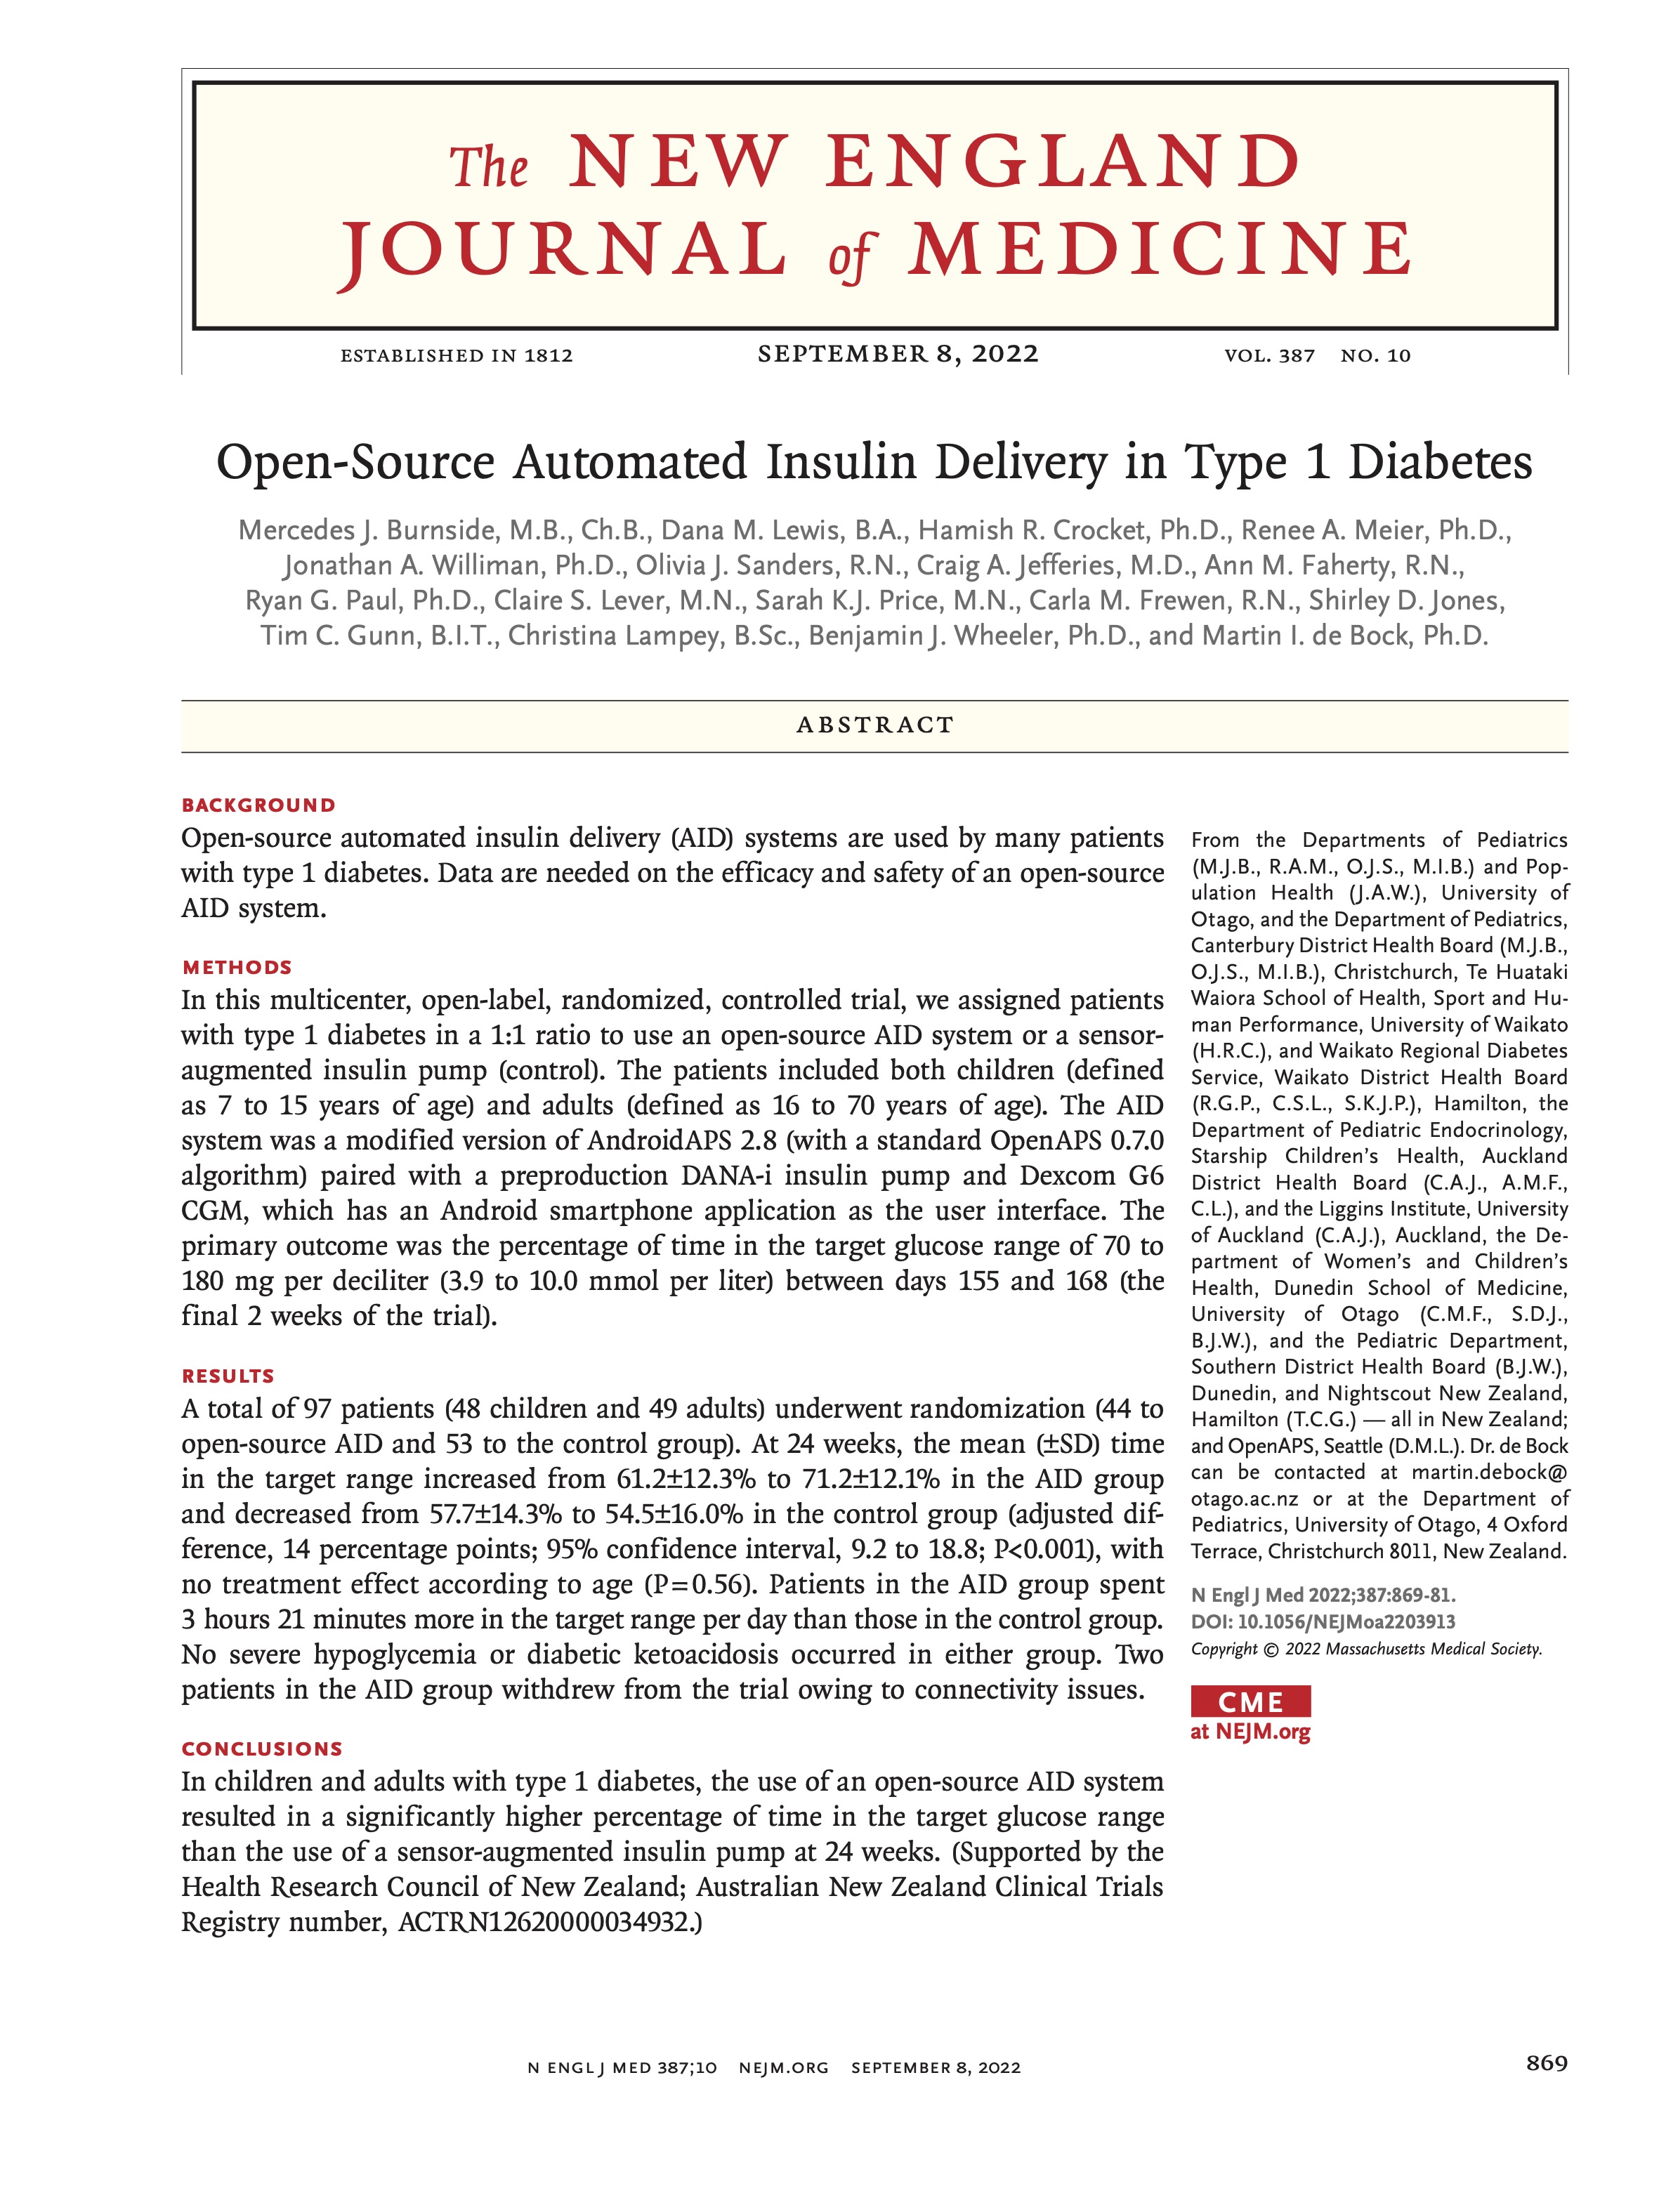
AID (APS) book now available in French!

Thanks to the dedicated efforts of Olivier Legendre and Dr. Mihaela Muresan, my book “Automated Insulin Delivery: How artificial pancreas “closed loop” systems can aid you in living with diabetes” (available on Amazon in Kindle, paperback, and hardcover formats, or free to read online and download at ArtificialPancreasBook.com) is now available in French!

The French version is also available for free download as a PDF at ArtificialPancreasBook.com or in Kindle (FR), paperback (FR), and hardcover (FR) formats!


French version of the AID book is now available, also in hardcover, paperback, and Kindle formats on Amazon

Merci au Dr. Mihaela Muresan et Olivier Legendre pour la traduction de l’intégralité de ce livre !

(Thank you to Dr. Mihaela Muresan and Olivier Legendre for translating this entire book!)

Everything I did wrong (but did anyway) training for a marathon after a broken ankle and marathon running with type 1 diabetes

This is another one of those posts for a niche audience. If you found this post, you’re likely looking for information about:

  • Running after a broken ankle (or are coming from my “tips for returning to weight bearing” and looking for an update from me, two years after my trimalleolar ankle fracture)
  • Running with the “Galloway method”, also known as run-walk or run/walk methods for marathon or similar long distances – but with information about run-walking for slow runners.
  • Running a marathon with type 1 diabetes, or running an ultra with type 1 diabetes
  • Running a marathon and training for a marathon and going without fuel or less fuel
    *Update: also running an ultramarathon with the same methods (less fuel than typical)!

There’s a bit of all of this in the post! (But TLDR – I ran my marathon (finally), successfully, despite having a previously broken ankle. And despite running it with type 1 diabetes, I had no issues managing my blood sugars during even the longest training runs, even with significantly less fuel than is typically used by marathon runners. I also ran a 50k ultra using the same methods!)

running a marathon after a broken ankle and with type 1 diabetes

First up, some context that explains why I chose run-walking as my method of running a marathon (as that also influences fueling choices) and what it is like to be a slow marathon runner (6 hour marathon ish). I broke my ankle in January 2019 and began running very tiny amounts (literally down the block to start) in summer 2019. I progressed, doing a short run interval followed by a walk interval, increasing the total numbers of intervals, and then slowly progressing to extend the length (distance and/or time) of the running intervals. In early fall 2019, I was attempting a couch-to-5k type program where I would extend my running intervals even longer, but I still had subsequent injuries (a very stubborn big toe joint, then intermetatarsal bursitis in TWO spots (argh)) that made this not work well. Eventually, I went back to running 30 seconds and walking 30 seconds, then keeping those “short” intervals and extending my run. I focused on time at first: going from 5 to 10 to 15 to 20 etc minutes, rather than focusing on distance. Once I built up to about 30 minutes of run-walking (30:30, meaning running 30 seconds and walking 30 seconds), I switched to adding a quarter or half mile each time depending on how I was feeling. But doing 30:30 seemed to work really well for me in terms of the physical impact to my feet, even with long miles, and also mentally, so I stuck with it. (You can go read about the Galloway run-walk-run method for more about run-walking; most people build up to running more, say 5 minutes or 8 minutes followed by a minute of walking, or maybe run 1 mile and then walk for a minute, or walk through the aid stations, but I found that 30:30 is what I liked and stuck with it or 60:30 as my longest intervals.)

This worked so well for me that I did not think about my right ankle a single time during or after my marathon! It took days to even remember that I had previously broken my ankle and it could’ve been problematic or weaker than my other ankle during my marathon. It took a long time to get to this point – I never thought I’d be forgetting even for a few days about my broken ankle! But two years later, I did.)

When COVID-19 struck, and as someone who paid attention early (beginning late January 2020), I knew my marathon would not be taking place in July 2020 and would be postponed until 2021. So I focused on keeping my feet healthy and building up a running “base” of trying to stay healthy feet-wise running twice a week into fall 2020, which worked fairly well. At the start of 2021, I bumped up to three runs a week consistently, and eventually began making one run every other a week longer. My schedule looked something like this:

Monday – 3 miles  Wednesday – 3 miles   Friday – 3 miles

Monday – 4 miles  Wednesday – 3 miles   Friday – 3 miles

Monday – 5 miles  Wednesday – 3 miles   Friday – 3 miles

Monday – 6 miles  Wednesday – 3 miles   Friday – 3 miles

Monday – (back to) 3 miles  Wednesday – 3 miles   Friday – 3 miles

Monday – 8 miles  Wednesday – 3 miles   Friday – 3 miles

Monday – (back to) 3  miles  Wednesday – 5 miles   Friday – 4 miles

Monday – 10 miles  Wednesday – 3 miles   Friday – 3 miles

Note that these runs I refer to were all technically run-walks, where I ran 30 seconds and walked 30 seconds (aka 30:30) until I covered the miles. I was running slow and easy, focusing on keeping my heart rate below its maximum and not worrying about speed, so between that and run-walking I was often doing 15m30s miles. Yes, I’m slow. This all enabled me to build up to safely be able to run 3 runs weekly at first, and then eventually progressed to adding a fourth run. When I added a fourth run, I was very conservative and started with only 1 mile for two weeks in a row, then 2 miles, then up to 3 miles. Eventually, later in my training, I had some of my other runs in the week be a bit longer (4-5 miles) in addition to my “long” run.

But, because I’m so slow, this means it takes a lot of time to run my long runs. If you estimate a 15-minute mile for easy math, that means an 8 mile “long” run would take at least 2 hours. With marathon training (and my goal to train up to multiple 22-24 mile runs before the marathon), that took A LOT of time. And, because of my broken ankle and intermetatarsal experiences from 2019, I was very cautious and conservative about taking care of my feet during training. So instead of following the usual progression of long runs increasing 2-3 weeks in a row, followed by a “cutback” long week, after I hit two hours of long running (essentially 8 miles, for me), I started doing long runs every other week. The other week was a “cutback” long run, which was usually 8 miles, 10 miles (for several weeks), up to eventually 12-14. In terms of “time on feet”, this meant 2-3 hours “cutback” long runs, which according to many people is the max you should be running for marathon training. That doesn’t quite work for slow runners such as myself where you might be doing a 6-hour marathon or 7-hour marathon or thereabouts. (The standard advice also maybe doesn’t apply when you are doing run-walking for your marathon training.)

I had ~6 months to build up to my marathon (from January to the end of July), so I had time to do this, which gave me a buffer in my overall training schedule in case of scheduling conflicts (which happened twice) and in case of injury (which thankfully didn’t happen). I ended up scheduling training long runs all the way to full marathon distance (26ish miles), because I wanted to practice my fueling (especially important for type 1 diabetes marathon runners, which I’ll talk about next) as well as get my feet used to that many hours of run-walking. I did my long runs without care for speed, so some of them were closer to 16-minute mile averages, some were around 15-minute mile averages for the entire run, and the day I ran the full marathon course for training I ended up doing 16+ minute miles and felt fabulous at the end.

I ended up doing a few “faster” “shorter” long runs (on my cutback weeks), where I would do a half marathon-ish distance on the actual marathon course (a public trail), and try to go faster than my super slow long run pace. I had several successful runs where I was at or near marathon pace (which for me would be around 13m30s). So yes, you can train slow and run fast for a marathon, even without much speed work, and even if you are doing a run-walk method, and even if you’re as slow as I am. Running ~15-minute miles took forever but kept my feet and body healthy and happy through marathon training, and I was still able to achieve my sub-6 hour marathon goal (running 13:41 average pace for 26.2+ miles) on race day.

Now let’s talk about fueling, and in particular fueling for people with type 1 diabetes and for people wondering if the internet is right about what fueling requirements are for marathon runners.

I previously wrote (for a T1D audience) about running when fasted, because then you don’t have to deal with insulin on board at the start of a run. That’s one approach, and another approach is to have a smaller meal or snack with fewer carbs before the run, and time your run so that you don’t need to bolus or inject for that meal before you start your run. That’s what I chose for most of my marathon training, especially for longer runs.

On a typical non-running day, I would eat breakfast (½ cup pecans, ¼ cup cranberries, and a few sticks of cheese), my OpenAPS rig would take care of insulin dosing (or I could bolus for it myself), and my BGs would be well managed. However, that would mean I had a lot of insulin on board (IOB) if I tried to run within an hour of that. So instead, during marathon training, I ended up experimenting with eating a smaller amount of pecans (¼ cup) and no cranberries, not bolusing or letting OpenAPS bolus, and running an hour later. I had a small BG rise from the protein (e.g. would go from 100 mg/dL flat overnight to 120-130 mg/dL), and then running would balance out the rest of it.

I generally would choose to target my blood sugar to 130 mg/dL at the start of long runs, because I prefer to have a little bit of buffer for if/when my blood sugar began to drop. I also figured out that if I wasn’t having IOB from breakfast, I did not need to reduce my insulin much in advance of the run, but do it during the duration of the run. Therefore, I would set a higher temporary target in my OpenAPS rig, and if I was doing things manually, I would set a temporary basal rate on my insulin pump to about ⅓ of my usual hourly rate for the duration of the run. That worked well because by the time the beginning of my run (30-45 minutes) brought my BG down a little bit from the start with the protein breakfast bump (up to 130 mg/dL or so), that’d also be when the reduced insulin effect would be noticeable, and I would generally stay flat instead of having a drop at the beginning or first hour of my run.

After my first hour or so, I just kept an eye periodically on my blood sugars. My rule of thumb was that if my BG drifted down below 120 mg/dL, I would eat a small amount of carbs. My carb of choice was an individually wrapped peppermint (I stuffed a bunch in my pocket for the run) that was 3-4g of carb. If I kept drifting down or hadn’t come back up to 120 mg/dL 10-15 minutes later, I would do another. Obviously, if I was dropping fast I would do more, but 75% of the time I only needed one peppermint (3-4g of carb) to pause a drift down. If you have a lot of insulin on board, it would take more carbs, but my method of not having IOB at the start of long runs worked well for me. Sometimes, I would run my entire long run with no carbs and no fuel (other than water, and eventually electrolyte pills). Part of this is likely due to the fact that I was run-walking at such low intensity (remember 15-ish minute miles), but part of this is also due to figuring out the right amount of insulin I needed for endurance running and making sure I didn’t have excess insulin on board. On my faster runs (my half marathon distance fast training runs, that were 2+ minutes/mile faster than my slow long runs) and my marathon itself, I ended up needing more carbs than a super slow run – but it ended up being about 30 grams of carbohydrate TOTAL.

Why am I emphasizing this?

Well, the internet says (and most coaches, training plans, etc) that you need 30g of carbs PER HOUR. And that you need to train your stomach to tolerate that many carbs, because your muscles and brain need it. And without that much fuel, you will ‘hit the wall’.

My hypothesis, which may be nuanced by having type 1 diabetes and wearing a CGM and being able to track my data closely and manage it not only by carbs but also titrating insulin levels (which someone without diabetes obviously can’t do), is that you don’t necessarily need that many carbs, even for endurance running or marathon running.

I’m wondering if there’s a correlation between people who max out their long runs around 16-20 miles and who then “hit the wall” around mile 20 of a marathon. Perhaps some of it is muscle fatigue because they haven’t trained for the distance and some of it is psychological of feeling the brain fatigue.

During my marathon, in which I ran 2+ min/mi faster than most of my training runs, I did not ever experience hypoglycemia, and I did not “hit the wall”. Everything hurt, but I didn’t “hit the wall” as most people talk about. Those might be related, or it might be influenced by the fact that I had done a 20, 22, 24, 26, and another 21 mile run as part of my training, so my legs were “used” to the 20+ mile distance?

So again – some of my decreased fueling needs may be because I was already reducing my insulin and balancing my blood sugars (really well), and if my blood sugar was low (hypoglycemia), I would’ve needed more carbs. Or you can argue my lower fueling needs are because I’m so slow (15-16 minute mile training runs, or a 13m40s marathon pace). But in any case, I wanted to point out that if the fueling advice you’re getting or reading online seems like it’s “too much” per hour, there are people who are successful in hitting their time goals and don’t hit the wall on lower fueling amounts, too. You don’t necessarily have to fuel for the sake of fueling.

Note that I am not doing “low carb” or “keto” or anything particular diet-wise (other than eating gluten-free, because I also have celiac disease) outside of my running fuel choices. This was a successful strategy for me, and I eat what might be considered a moderate carb diet outside of running fuel choices.

Ps – if you don’t fuel (carbs or other nutrients) during your runs, don’t forget about your electrolytes. I decided to keep drinking water out of a Camelbak in a running pack, rather than filling it with Gatorade or a similar electrolyte drink, but I’m pretty electrolyte sensitive so I needed to do something to replace them. I got electrolyte pills and would take them every 30 minutes or so on long training runs when it was hotter. Play around with timing on those: if you don’t sweat a lot or aren’t a salty sweater, you may not need as many as often. I ended up doing the bulk of my long runs on hot days, and I sweat a lot, so every 30 minutes was about right for me. On cooler runs, one per hour was sufficient for me. (I tried these chewable tabs in lemon-lime but didn’t like the salt feeling directly in my mouth; I ended up buying these to swallow instead: I didn’t have any digestion issues or side effects from them, and they successfully kept my electrolytes to manageable levels. The package says not to take more than 10 within a 24 hour period, but I ended up taking 12 for my longest training run and the marathon itself and suffered no ill effects. It’s probably set to max 10 because of the amount of salt compared to the typical daily amount needed..but obviously, if you’re doing endurance running you need more than the daily amount of salt you would need on a regular day. But I’m not a doctor and this isn’t medical advice, of course – I’m just telling you what I chose to do).

In terms of training, here’s everything the internet told me to do for marathon training and everything I did “wrong” according to the typical advice:

  • Your long run should be 20-30% of your overall weekly mileageWhat I did: Sometimes my long runs got up to 70% of my weekly mileage, because I was only running 3 and then 4 days a week, and not doing very long mid-week runs.
  • Have longer mid-week runs, and build those up in addition to your true long runWhat I did: I did build up to a few 5-6 mile mid-week runs, but I chose consistency of my 4 runs per week rather than overdoing it with mid-week medium runs
  • Run 5-6 days a weekWhat I did: Only run 4 times a week, because I wanted a rest day after each run, and wanted a rest day prior to my longest run. I ran Monday, Wednesday, Friday, then added Saturday short runs. Monday was my long run (because I have the benefit of a flexible schedule for work).
  • Get high mileage (start from a base of 30-40 miles a week and build up to 50-60 miles!)What I did: I started with a “base” of 10 miles a week with two runs that I was very proud of. I went to three runs a week, and then 4. My biggest running week during training was 40.55 miles, although they were all 20+ mile weeks (long or cutback weeks) after the first two months of training.
  • Do progressively longer long runs for two or three weeks in a row and then do one cutback week, then continue the progressionWhat I did: Because of the time on my feet cost of being a slower runner, I did an every-other-week long-run progression alternating with a shorter cutback week.
  • Long run, tempo run, speed work, etc. plus easy runs! All the things each week!What I did: a long run per week, then the rest of my runs were usually easy runs. I tried a handful of times to do some “speed” work, but I often time was trying to keep my feet from being injured and it felt like running faster caused my feet to be sore or have other niggles in my legs, so I didn’t do much of that, other than doing some “cutback” long runs (around half marathon distance, as well as my last 21-mile run) at close to marathon pace to get a feel for how it felt to run at that pace for longer.

TLDR, again:

I signed up for a marathon in fall 2018 planning to run it in July 2019 but was thwarted by a broken ankle in January 2019 and COVID-19(/20) for 2020, so I ultimately trained for and ran it in July 2021. I am a slow runner, and I was able to achieve my sub-6 hour marathon goal using run-walk and without causing additional injury to my feet. And, because of my “slow” or less intense running, I needed a lot less fuel than is typically recommended for marathoners, and still managed my blood glucose levels within my ideal target ranges despite 5, 6, and even 7 hours run on my feet. Yes, you can run marathons with type 1 diabetes. And yes, you can run any length endurance runs with type 1 diabetes! I also ran a 50k ultramarathon using the same methods.

Understanding Automated Insulin Delivery: A basic book for kids, family, and friends of people living with diabetes

tl;dr – A new book out for kids explaining the basics of automated insulin delivery, using the analogy of scuba diving to explain how the system makes small changes in insulin delivery to manage glucose levels! Watch the narrated video free online, and if you find the analogy useful, it’s available in book form as both a physical, print book as well as on Kindle via Amazon.DanaMLewis_UnderstandingAutomatedInsulinDelivery_KidsBook—-

A few weeks ago I was thinking about what the basic things that I wanted people to know about automated insulin delivery. A good portion of the general public – and even many family members of people with diabetes – thinks that a traditional insulin pump does what an automated insulin delivery system does: adjusting insulin delivery based on continuous glucose monitor (CGM) data. But a traditional pump doesn’t necessarily know about the CGM data and isn’t equipped with the algorithm to make those decisions and changes to insulin delivery, so the person with diabetes is doing a LOT of invisible labor to try to manage glucose levels constantly 24/7/365. That’s why an automated insulin delivery system is so useful, and why I’ve been using a DIY system for more than 5 years. Now, though, we’re (finally) starting to see commercial systems come to market that does the basic functionality similar to what OpenAPS could do five years ago. I want more people to have access to these systems and use them as best as they can be used to give people the best outcomes diabetes-wise and the best quality of life they can possibly have. Helping explain to more people how this technology works is one way I can help do this, and thus an idea was born for another book to explain the basics of automated insulin delivery systems.

Dana's first rough sketch of the scuba diving analogy for explaining automated insulin delivery
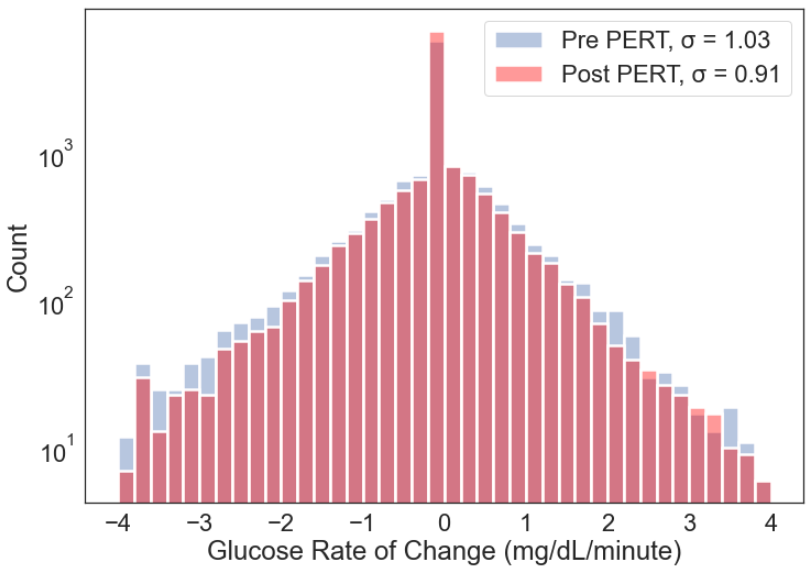
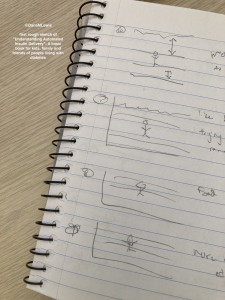
I started with a basic sketch of an idea to run it by Scott and a few other people to test the idea. I’m not much for drawing, so it was a *very* rough sketch. But the analogy seemed to resonate, so I moved on to mocking up a basic version on the computer. (I went down a rabbit hole because I thought it would be neat to make an animated video for people to see and share online, to accompany the book. But I don’t know how to illustrate on the computer, let alone animate, so I tried an open source illustration program called Synfig, then several other illustrator programs that were open source to do the basic design to import into Synfig to animate, but then realized what I had in mind was so simple that basic transitions and animations in PowerPoint would suffice for my animated video.) PowerPoint is also how I’ve made my other children’s books for self-publishing, so it was easy to do a widescreen, video design version and then modify a version for the print size book of choice (I chose an 8.5×8.5 to make it easiest to hold and read). 

I went from a paper and pencil sketch on July 18 to mocking up the video animation and designing the print book and requesting printed proofs on July 23. The printed proofs were a bit slow to ship compared to usual (probably something to do with a global pandemic), and arrived on August 4. I reviewed, made a few small changes, and hit ‘publish’ the same day, and Amazon reviewed and approved both the Kindle version and the print version, which are now available today (August 5, 2020) online. It took less than 3 weeks to go from idea to printed book available for shipping worldwide! (I am sharing all these details to hopefully encourage someone else to self-publish if they have an idea for a book they’d like to see available in the world – feel free to reach out if you have any questions about self publishing!)

Print_DanaMLewis_UnderstandingAutomatedInsulinDeliveryKindle_Amazon_DanaMLewis_UnderstandingAutomatedInsulinDeliveryHere is the link to the print book on Amazon.

Here’s the link to the Kindle book version on Amazon – it’s also available as part of Kindle Unlimited and the Kindle Lending Library, so feel free to share it out!

DanaMLewis_UnderstandingAutomatedInsulinDelivery_kidsbook_TheEnd

Also, if you’re looking for something to do with your kids (or have your kids do), I also made some of the scuba diving designs into a coloring sheet – check them out here (downloads as a PDF).

DanaMLewis_freescubacoloringsheets

Poster and presentation content from @DanaMLewis at #ADA2020 and #DData20

In previous years (see 2019 and 2018), I mentioned sharing content from ADA Scientific Sessions (this year it’s #ADA2020) with those not physically present at the conference. This year, NO ONE is present at the event, and we’re all virtual! Even more reason to share content from the conference. :)

I contributed to and co-authored two different posters at Scientific Sessions this year:

  • “Multi-Timescale Interactions of Glucose and Insulin in Type 1 Diabetes Reveal Benefits of Hybrid Closed Loop Systems“ (poster 99-LB) along with Azure Grant and Lance Kriegsfeld, PhD.
  • “Do-It-Yourself Artificial Pancreas Systems for Type 1 Diabetes Reduce Hyperglycemia Without Increasing Hypoglycemia” (poster 988-P in category 12-D Clinical Therapeutics/New Technology—Insulin Delivery Systems), alongside Jennifer Zabinsky, MD MEng, Haley Howell, MSHI, Alireza Ghezavati, MD, Andrew Nguyen, PhD, and Jenise Wong, MD PhD.

And, while not a poster at ADA, I also presented the “AID-IRL” study funded by DiabetesMine at #DData20, held in conjunction with Scientific Sessions. A summary of the study is also included in this post.

First up, the biological rhythms poster, “Multi-Timescale Interactions of Glucose and Insulin in Type 1 Diabetes Reveal Benefits of Hybrid Closed Loop Systems” (poster 99-LB). (Twitter thread summary of this poster here.)

Building off our work as detailed last year, Azure, Lance, and I have been exploring the biological rhythms in individuals living with type 1 diabetes. Why? It’s not been done before, and we now have the capabilities thanks to technology (pumps, CGM, and closed loops) to better understand how glucose and insulin dynamics may be similar or different than those without diabetes.

Background:

Mejean et al., 1988
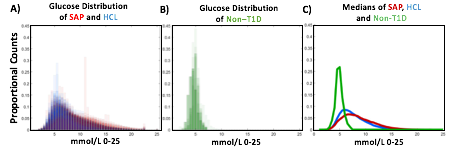
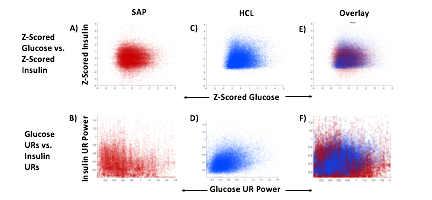
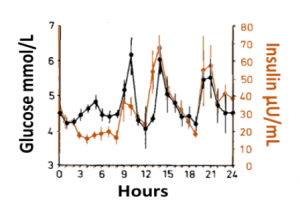
Blood glucose and insulin exhibit coupled biological rhythms at multiple timescales, including hours (ultradian, UR) and the day (circadian, CR) in individuals without diabetes. The presence and stability of these rhythms are associated with healthy glucose control in individuals without diabetes. (See right, adapted from Mejean et al., 1988).

However, biological rhythms in longitudinal (e.g., months to years) data sets of glucose and insulin outputs have not been mapped in a wide population of people with Type 1 Diabetes (PWT1D). It is not known how glucose and insulin rhythms compare between T1D and non-T1D individuals. It is also unknown if rhythms in T1D are affected by type of therapy, such as Sensor Augmented Pump (SAP) vs. Hybrid Closed Loop (HCL). As HCL systems permit feedback from a CGM to automatically adjust insulin delivery, we hypothesized that rhythmicity and glycemia would exhibit improvements in HCL users compared to SAP users. We describe longitudinal temporal structure in glucose and insulin delivery rate of individuals with T1D using SAP or HCL systems in comparison to glucose levels from a subset of individuals without diabetes.

Data collection and analysis:

We assessed stability and amplitude of normalized continuous glucose and insulin rate oscillations using the continuous wavelet transformation and wavelet coherence. Data came from 16 non-T1D individuals (CGM only, >2 weeks per individual) from the Quantified Self CGM dataset and 200 (n = 100 HCL, n = 100 SAP; >3 months per individual) individuals from the Tidepool Big Data Donation Project. Morlet wavelets were used for all analyses. Data were analyzed and plotted using Matlab 2020a and Python 3 in conjunction with in-house code for wavelet decomposition modified from the “Jlab” toolbox, from code developed by Dr. Tanya Leise (Leise 2013), and from the Wavelet Coherence toolkit by Dr. Xu Cui. Linear regression was used to generate correlations, and paired t-tests were used to compare AUC for wavelet and wavelet coherences by group (df=100). Stats used 1 point per individual per day.

Wavelets Assess Glucose and Insulin Rhythms and Interactions

Wavelet Coherence flow for glucose and insulin

Morlet wavelets (A) estimate rhythmic strength in glucose or insulin data at each minute in time (a combination of signal amplitude and oscillation stability) by assessing the fit of a wavelet stretched in window and in the x and y dimensions to a signal (B). The output (C) is a matrix of wavelet power, periodicity, and time (days). Transform of example HCL data illustrate the presence of predominantly circadian power in glucose, and predominantly 1-6 h ultradian power in insulin. Color map indicates wavelet power (synonymous with Y axis height). Wavelet coherence (D) enables assessment of rhythmic interactions between glucose and insulin; here, glucose and insulin rhythms are highly correlated at the 3-6 (ultradian) and 24 (circadian) hour timescales.

Results:

Hybrid Closed Loop Systems Reduce Hyperglycemia

Glucose distribution of SAP, HCL, and nonT1D
  • A) Proportional counts* of glucose distributions of all individuals with T1D using SAP (n=100) and HCL (n=100) systems. SAP system users exhibit a broader, right shifted distribution in comparison to individuals using HCL systems, indicating greater hyperglycemia (>7.8 mmol/L). Hypoglycemic events (<4mmol/L) comprised <5% of all data points for either T1D dataset.
  • B) Proportional counts* of non-T1D glucose distributions. Although limited in number, our dataset from people without diabetes exhibits a tighter blood glucose distribution, with the vast majority of values falling in euglycemic range (n=16 non-T1D individuals).
  • C) Median distributions for each dataset.
  • *Counts are scaled such that each individual contributes the same proportion of total data per bin.

HCL Improves Correlation of Glucose-Insulin Level & Rhythm

Glucose and Insulin rhythms in SAP and HCL

SAP users exhibit uncorrelated glucose and insulin levels (A) (r2 =3.3*10-5; p=0.341) and uncorrelated URs of glucose and insulin (B) (r2 =1.17*10-3; p=0.165). Glucose and its rhythms take a wide spectrum of values for each of the standard doses of insulin rates provided by the pump, leading to the striped appearance (B). By contrast, Hybrid Closed Loop users exhibit correlated glucose and insulin levels (C) (r2 =0.02; p=7.63*10-16), and correlated ultradian rhythms of glucose and insulin (D) (r2 =-0.13; p=5.22*10-38). Overlays (E,F).

HCL Results in Greater Coherence than SAP

Non-T1D individuals have highly coherent glucose and insulin at the circadian and ultradian timescales (see Mejean et al., 1988, Kern et al., 1996, Simon and Brandenberger 2002, Brandenberger et al., 1987), but these relationships had not previously been assessed long-term in T1D.

coherence between glucose and insulin in HCL and SAP, and glucose swings between SAP, HCL, and non-T1D
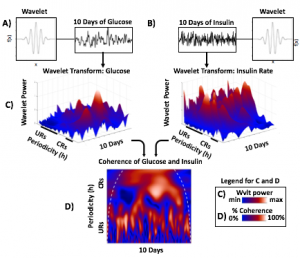
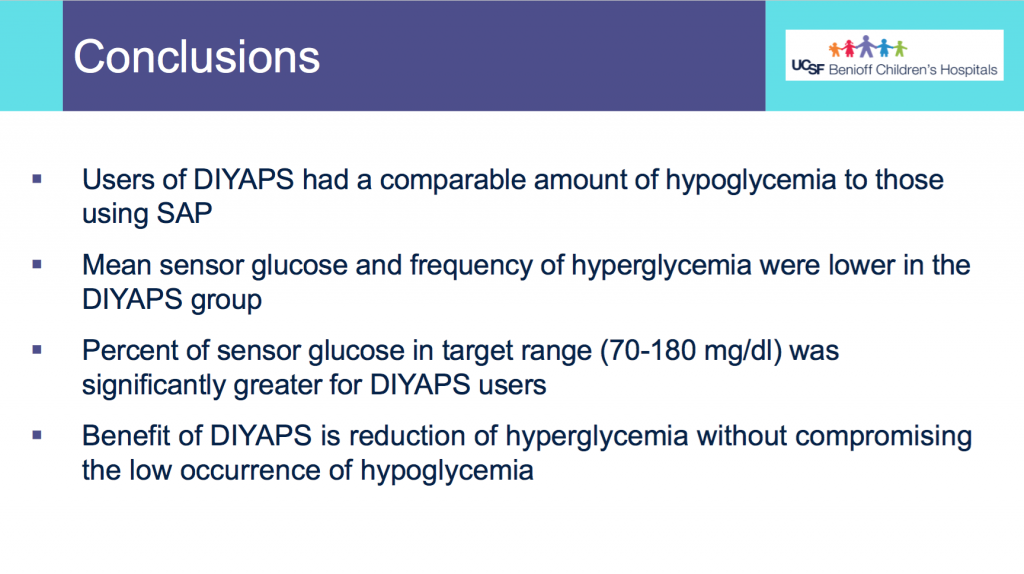
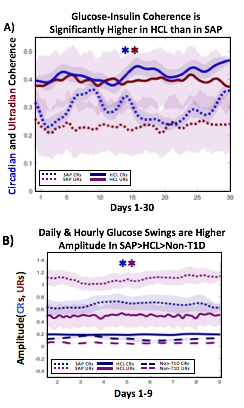
A) Circadian (blue) and 3-6 hour ultradian (maroon) coherence of glucose and insulin in HCL (solid) and SAP (dotted) users. Transparent shading indicates standard deviation. Although both HCL and SAP individuals have lower coherence than would be expected in a non-T1D individual,  HCL CR and UR coherence are significantly greater than SAP CR and UR coherence (paired t-test p= 1.51*10-7 t=-5.77 and p= 5.01*10-14 t=-9.19, respectively). This brings HCL users’ glucose and insulin closer to the canonical non-T1D phenotype than SAP users’.

B) Additionally, the amplitude of HCL users’ glucose CRs and URs (solid) is closer (smaller) to that of non-T1D (dashed) individuals than are SAP glucose rhythms (dotted). SAP CR and UR amplitude is significantly higher than that of HCL or non-T1D (T-test,1,98, p= 47*10-17 and p= 5.95*10-20, respectively), but HCL CR amplitude is not significantly different from non-T1D CR amplitude (p=0.61).

Together, HCL users are more similar than SAP users to the canonical Non-T1D phenotype in A) rhythmic interaction between glucose and insulin and B) glucose rhythmic amplitude.

Conclusions and Future Directions

T1D and non-T1D individuals exhibit different relative stabilities of within-a-day rhythms and daily rhythms in blood glucose, and T1D glucose and insulin delivery rhythmic patterns differ by insulin delivery system.

Hybrid Closed Looping is Associated With:

  • Lower incidence of hyperglycemia
  • Greater correlation between glucose level and insulin delivery rate
  • Greater correlation between ultradian glucose and ultradian insulin delivery rhythms
  • Greater degree of circadian and ultradian coherence between glucose and insulin delivery rate than in SAP system use
  • Lower amplitude swings at the circadian and ultradian timescale

These preliminary results suggest that HCL recapitulates non-diabetes glucose-insulin dynamics to a greater degree than SAP. However, pump model, bolusing data, looping algorithms and insulin type likely all affect rhythmic structure and will need to be further differentiated. Future work will determine if stability of rhythmic structure is associated with greater time in range, which will help determine if bolstering of within-a-day and daily rhythmic structure is truly beneficial to PWT1D.
Acknowledgements:

Thanks to all of the individuals who donated their data as part of the Tidepool Big Data Donation Project, as well as the OpenAPS Data Commons, from which data is also being used in other areas of this study. This study is supported by JDRF (1-SRA-2019-821-S-B).

(You can download a full PDF copy of the poster here.)

Next is “Do-It-Yourself Artificial Pancreas Systems for Type 1 Diabetes Reduce Hyperglycemia Without Increasing Hypoglycemia” (poster 988-P in category 12-D Clinical Therapeutics/New Technology—Insulin Delivery Systems), which I co-authored alongside Jennifer Zabinsky, MD MEng, Haley Howell, MSHI, Alireza Ghezavati, MD, Andrew Nguyen, PhD, and Jenise Wong, MD PhD. There is a Twitter thread summarizing this poster here.

This was a retrospective double cohort study that evaluated data from the OpenAPS Data Commons (data ranged from 2017-2019) and compared it to conventional sensor-augmented pump (SAP) therapy from the Tidepool Big Data Donation Project.

Methods:

  • From the OpenAPS Data Commons, one month of CGM data (with more than 70% of the month spent using CGM), as long as they were >1 year of living with T1D, was used. People could be using any type of DIYAPS (OpenAPS, Loop, or AndroidAPS) and there were no age restrictions.
  • A random age-matched sample from the Tidepool Big Data Donation Project of people with type 1 diabetes with SAP was selected.
  • The primary outcome assessed was percent of CGM data <70 mg/dL.
  • The secondary outcomes assessed were # of hypoglycemic events per month (15 minutes or more <70 mg/dL); percent of time in range (70-180mg/dL); percent of time above range (>180mg/dL), mean CGM values, and coefficient of variation.
Methods_DIYAPSvsSAP_ADA2020_DanaMLewis

Demographics:

  • From Table 1, this shows the age of participants was not statistically different between the DIYAPS and SAP cohorts. Similarly, the age at T1D diagnosis or time since T1D diagnosis did not differ.
  • Table 2 shows the additional characteristics of the DIYAPS cohort, which included data shared by a parent/caregiver for their child with T1D. DIYAPS use was an average of 7 months, at the time of the month of CGM used for the study. The self-reported HbA1c in DIYAPS was 6.4%.
Demographics_DIYAPSvsSAP_ADA2020_DanaMLewis DIYAPS_Characteristics_DIYAPSvsSAP_ADA2020_DanaMLewis

Results:

  • Figure 1 shows the comparison in outcomes based on CGM data between the two groups. Asterisks (*) indicate statistical significance.
  • There was no statistically significant difference in % of CGM values below 70mg/dL between the groups in this data set sampled.
  • DIYAPS users had higher percent in target range and lower percent in hyperglycemic range, compared to the SAP users.
  • Table 3 shows the secondary outcomes.
  • There was no statistically significant difference in the average number of hypoglycemic events per month between the 2 groups.
  • The mean CGM glucose value was lower for the DIYAPS group, but the coefficient of variation did not differ between groups.
CGM_Comparison_DIYAPSvsSAP_ADA2020_DanaMLewis SecondaryOutcomes_DIYAPSvsSAP_ADA2020_DanaMLewis

Conclusions:

    • Users of DIYAPS (from this month of sampled data) had a comparable amount of hypoglycemia to those using SAP.
    • Mean CGM glucose and frequency of hyperglycemia were lower in the DIYAPS group.
    • Percent of CGM values in target range (70-180mg/dL) was significantly greater for DIYAPS users.
    • This shows a benefit in DIYAPS in reducing hyperglycemia without compromising a low occurrence of hypoglycemia. 
Conclusions_DIYAPSvsSAP_ADA2020_DanaMLewis

(You can download a PDF of the e-poster here.)

Finally, my presentation at this year’s D-Data conference (#DData20). The study I presented, called AID-IRL, was funded by Diabetes Mine. You can see a Twitter thread summarizing my AID-IRL presentation here.

AID-IRL-Aim-Methods_DanaMLewis

I did semi-structured phone interviews with 7 users of commercial AID systems in the last few months. The study was funded by DiabetesMine – both for my time in conducting the study, as well as funding for study participants. Study participants received $50 for their participation. I sought a mix of longer-time and newer AID users, using a mix of systems. Control-IQ (4) and 670G (2) users were interviewed; as well as (1) a CamAPS FX user since it was approved in the UK during the time of the study.

Based on the interviews, I coded their feedback for each of the different themes of the study depending on whether they saw improvements (or did not have issues); had no changes but were satisfied, or neutral experiences; or saw negative impact/experience. For each participant, I reviewed their experience and what they were happy with or frustrated by.

Here are some of the details for each participant.

AID-IRL-Participant1-DanaMLewisAID-IRL-Participant1-cont_DanaMLewis
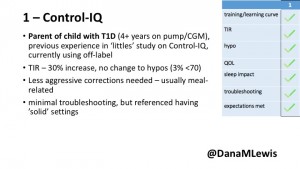
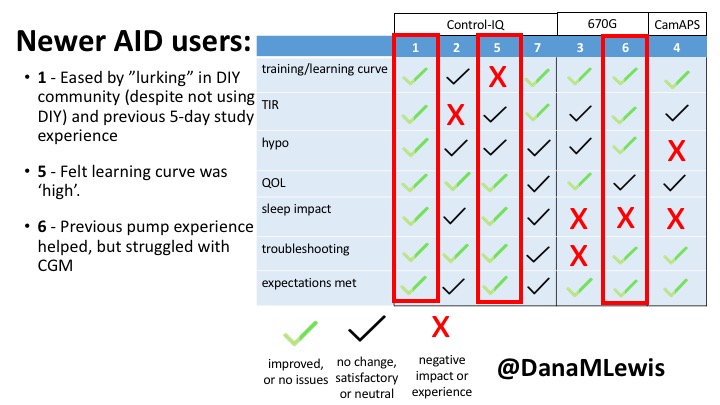
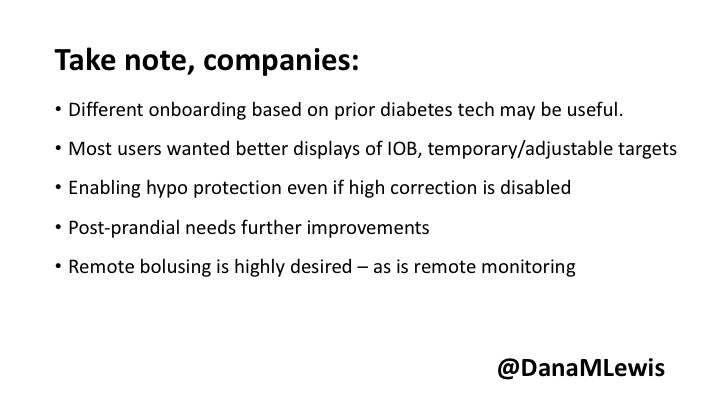
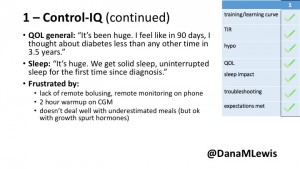
1 – A parent of a child using Control-IQ (off-label), with 30% increase in TIR with no increased hypoglycemia. They spend less time correcting than before; less time thinking about diabetes; and “get solid uninterrupted sleep for the first time since diagnosis”. They wish they had remote bolusing, more system information available in remote monitoring on phones. They miss using the system during the 2 hour CGM warmup, and found the system dealt well with growth spurt hormones but not as well with underestimated meals.

AID-IRL-Participant2-DanaMLewis AID-IRL-Participant2-cont-DanaMLewis
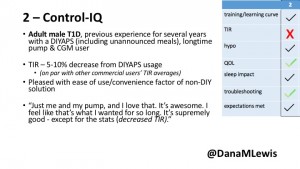
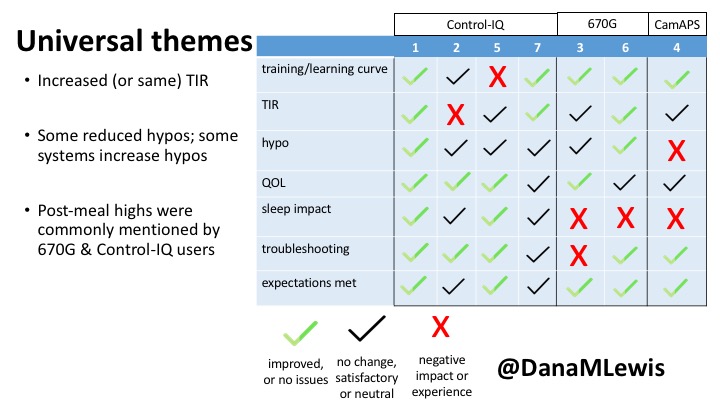
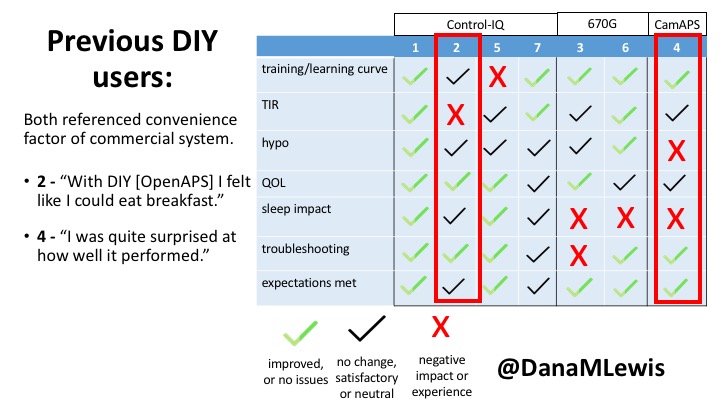
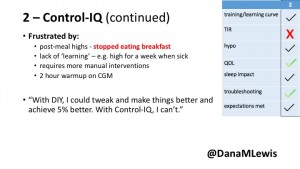
2 – An adult male with T1D who previously used DIYAPS saw 5-10% decrease in TIR (but it’s on par with other participants’ TIR) with Control-IQ, and is very pleased by the all-in-one convenience of his commercial system.He misses autosensitivity (a short-term learning feature of how insulin needs may very from base settings) from DIYAPS and has stopped eating breakfast, since he found it couldn’t manage that well. He is doing more manual corrections than he was before.

AID-IRL-Participant5-DanaMLewis AID-IRL-Participant5-cont_DanaMLewis
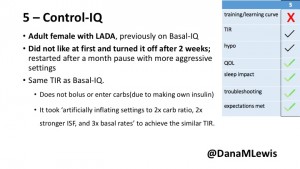
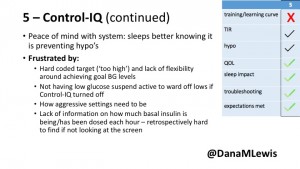
5 – An adult female with LADA started, stopped, and started using Control-IQ, getting the same TIR that she had before on Basal-IQ. It took artificially inflating settings to achieve these similar results. She likes peace of mind to sleep while the system prevents hypoglycemia. She is frustrated by ‘too high’ target; not having low prevention if she disables Control-IQ; and how much she had to inflate settings to achieve her outcomes. It’s hard to know how much insulin the system gives each hour (she still produces some of own insulin).

AID-IRL-Participant7-DanaMLewis AID-IRL-Participant7-cont-DanaMLewis
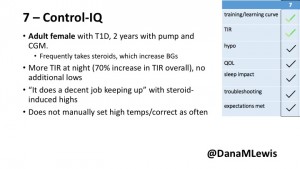
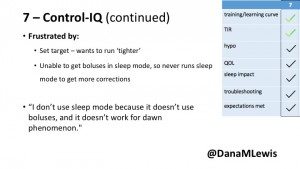
7 – An adult female with T1D who frequently has to take steroids for other reasons, causing increased BGs. With Control-IQ, she sees 70% increase in TIR overall and increased TIR overnight, and found it does a ‘decent job keeping up’ with steroid-induced highs. She also wants to run ‘tighter’ and have an adjustable target, and does not ever run in sleep mode so that she can always get the bolus corrections that are more likely to bring her closer to target.

AID-IRL-Participant3-DanaMLewis AID-IRL-Participant3-cont-DanaMLewis
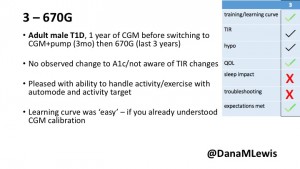
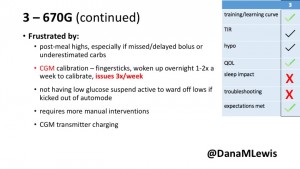
3 – An adult male with T1D using 670G for 3 years didn’t observe any changes to A1c or TIR, but is pleased with his outcomes, especially with the ability to handle his activity levels by using the higher activity target.  He is frustrated by the CGM and is woken up 1-2x a week to calibrate overnight. He wishes he could still have low glucose suspend even if he’s kicked out of automode due to calibration issues. He also commented on post-meal highs and more manual interventions.

AID-IRL-Participant6-DanaMLewis AID-IRL-Participant6-contDanaMLewis
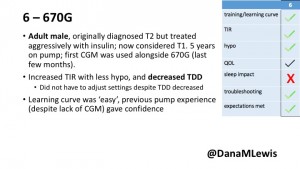
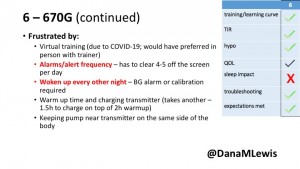
6 – Another adult male user with 670G was originally diagnosed with T2 (now considered T1) with a very high total daily insulin use that was able to decrease significantly when switching to AID. He’s happy with increased TIR and less hypo, plus decreased TDD. Due to #COVID19, he did virtually training but would have preferred in-person. He has 4-5 alerts/day and is woken up every other night due to BG alarms or calibration. He does not like the time it takes to charge CGM transmitter, in addition to sensor warmup.

AID-IRL-Participant4-DanaMLewis AID-IRL-Participant4-contDanaMLewis
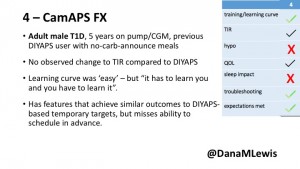
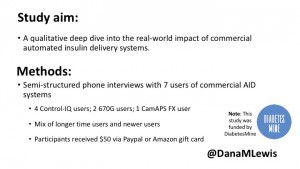
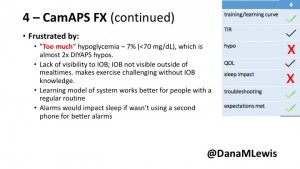
4 – The last participant is an adult male with T1 who previously used DIYAPS but was able to test-drive the CamAPS FX. He saw no TIR change to DIYAPS (which pleased him) and thought the learning curve was easy – but he had to learn the system and let it learn him. He experienced ‘too much’ hypoglycemia (~7% <70mg/dL, 2x his previous), and found it challenging to not have visibility of IOB. He also found the in-app CGM alarms annoying. He noted the system may work better for people with regular routines.
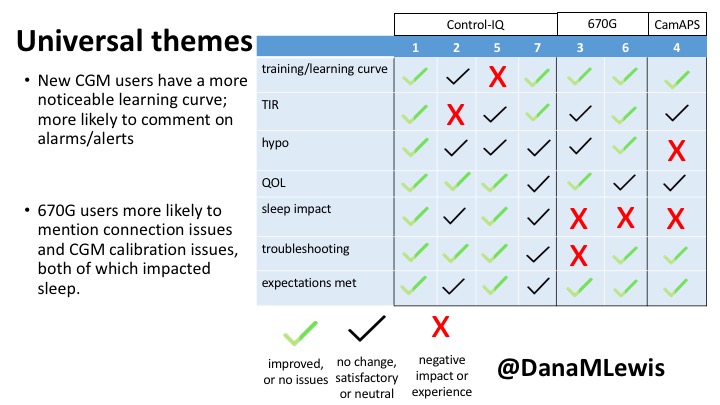
You can see a summary of the participants’ experiences via this chart. Overall, most cited increased or same TIR. Some individuals saw reduced hypos, but a few saw increases. Post-meal highs were commonly mentioned.

AID-IRL-UniversalThemes2-DanaMLewis AID-IRL-UniversalThemes-DanaMLewis

Those newer to CGM have a noticeable learning curve and were more likely to comment on number of alarms and system alerts they saw. The 670G users were more likely to describe connection/troubleshooting issues and CGM calibration issues, both of which impacted sleep.

This view highlights those who more recently adopted AID systems. One noted their learning experience was ‘eased’ by “lurking” in the DIY community, and previously participating in an AID study. One felt the learning curve was high. Another struggled with CGM.

AID-IRL-NewAIDUsers-DanaMLewis

Both previous DIYAPS users who were using commercial AID systems referenced the convenience factor of commercial systems. One DIYAPS saw decreased TIR, and has also altered his behaviors accordingly, while the other saw no change to TIR but had increased hypo’s.

AID-IRL-PreviousDIYUsers-DanaMLewis

Companies building AID systems for PWDs should consider that the onboarding and learning curve may vary for individuals, especially those newer to CGM. Many want better displays of IOB and the ability to adjust targets. Remote bolusing and remote monitoring is highly desired by all, regardless of age. Post-prandial was frequently mentioned as the weak point in glycemic control of commercial AID systems. Even with ‘ideal’ TIR, many commercial users still are doing frequent manual corrections outside of mealtimes. This is an area of improvement for commercial AID to further reduce the burden of managing diabetes.

AID-IRL-FeedbackForCompanies-DanaMLewis

Note – all studies have their limitations. This was a small deep-dive study that is not necessarily representative, due to the design and small sample size. Timing of system availability influenced the ability to have new/longer time users.

AID-IRL-Limitations-DanaMLewis

Thank you to all of the participants of the study for sharing their feedback about their experiences with AID-IRL!

(You can download a PDF of my slides from the AID-IRL study here.)

Have questions about any of my posters or presentations? You can always reach me via email at Dana@OpenAPS.org.

Automated Insulin Delivery: How artificial pancreas “closed loop” systems can aid you in living with diabetes (introducing “the APS book” by @DanaMLewis)

Tl;dr – I wrote a book about artificial pancreas systems / hybrid and fully closed loop systems / automated insulin delivery systems! It’s out today – you can buy a print copy on Amazon; a Kindle copy on Amazon; check out all the content on the web or your phone here; or download a PDF if you prefer.

A few months ago, I saw someone share a link to one of my old blog posts with someone else on Facebook. Quite old in fact – I had written it 5+ years ago! But the content was and is still relevant today.

It made me wonder – how could we as a diabetes community, who have been innovating and exploring new diabetes technology such as closed loop/artificial pancreas systems (APS), package up some of this knowledge and share it with people who are newer to APS? And while yes, much of this is tucked into the documentation for DIY closed loop systems, not everyone will choose a DIY closed loop system and also therefore may not see or find this information. And with regards to some of the things I’ve written here on DIYPS.org, not everyone will be lucky enough to have the right combination of search terms to end up on a particular post to answer their question.

Automated_Insulin_Delivery_by_DanaMLewis_example_covers_renderingThus, the idea for a book was born. I wanted to take much of what I’ve been writing here, sharing on Facebook and Twitter, and seeing others discuss as well, and put it together in one place to be a good starting place for someone to learn about APS in general. My hope is that it’s more accessible for people who don’t know what “DIY” or “open source” diabetes is, and it’s findable by people who also don’t know or don’t consider themselves to be part of the “diabetes online community”.

APSBook_NowAvailable_DanaMLewisIs it perfect? Absolutely not! But, like most of the things in the DIY community…the book is open source. Seriously. Here’s the repository on Github! If you see a typo or have suggestions of content to add, you can make a PR (pull request) or log an issue with content recommendations. (There’s instructions on the book page here with how to do either of those things!) I plan to make rolling updates to it, so you can see on the change log page what’s changed between major versions.)

It’s the first book out there that I know of on APS, but it won’t be the only one. I hope this inspires or moves more people to share their knowledge, through blogs or podcasts or future books, with the rest of our community and loved ones who want and need to learn more about managing type 1 diabetes.

“I will immediately recommend this book not just to people looking to use a DIY closed loop system, but also to anybody looking to improve their grasp on the management of type 1 diabetes, whether patient, caregiver, or healthcare provider.”

Aaron Neinstein, MD
Endocrinologist, UCSF

And as always, I’m happy to share what I’ve learned about the self-publishing process, too. I previously used CreateSpace for my children’s books, which got merged with Amazon’s Kindle Direct Publishing (KDP), and there was a learning curve for KDP for both doing the print version and doing the Kindle version. I didn’t get paid to write this book – and I didn’t write it for a profit. Like my children’s books, I plan to use any proceeds to donate copies to libraries and hospitals, and send any remaining funds to Life For A Child to help ensure as many kids as possible have access to insulin, BG monitoring supplies, and education.

I’m incredibly grateful for many people for helping out with and contributing to this book. You can see the full acknowledgement section with my immense thanks to the many reviewers of early versions of the book! And ditto for the people who shared their stories and experiences with APS. But special thanks go in particular to Scott for thorough first editing and overall support of every project I bring up out of the blue; to Tim Gunn for beautiful cover design of the book; and to Aaron Kowalski to be kind enough to write this amazing foreword.

Amazon_Button_APSBook_DanaMLewis

Presentations and poster content from @DanaMLewis at #ADA2019

Like I did last year, I want to share the work being presented at #ADA2019 with those who are not physically there! (And if you’re presenting at #ADA2019 or another conference and would like suggestions on how to share your content in addition to your poster or presentation, check out these tips.) This year, I’m co-author on three posters and an oral presentation.

  • 1056-P in category 12-D Clinical Therapeutics/New Technology–Insulin Delivery Systems, Preliminary Characterization of Rhythmic Glucose Variability In Individuals With Type 1 Diabetes, co-authored by Dana Lewis and Azure Grant.
    • Come see us at the poster session, 12-1pm on Sunday! Dana & Azure will be presenting this poster.
  • 76-OR, In-Depth Review of Glycemic Control and Glycemic Variability in People with Type 1 Diabetes Using Open Source Artificial Pancreas Systems, co-authored by Andreas Melmer, Thomas Züger, Dana Lewis, Scott Leibrand, Christoph Stettler, and Markus Laimer.
    • Come hear our presentation in room S-157 (South, Upper Mezzanine Level), 2:15-2:30 pm on Saturday!
  • 117-LB, DIWHY: Factors Influencing Motivation, Barriers and Duration of DIY Artificial Pancreas System Use Among Real-World Users, co-authored by Katarina Braune, Shane O’Donnell, Bryan Cleal, Ingrid Willaing, Adrian Tappe, Dana Lewis, Bastian Hauck, Renza Scibilia, Elizabeth Rowley, Winne Ko, Geraldine Doyle, Tahar Kechadi, Timothy C. Skinner, Klemens Raille, and the OPEN consortium.
    • Come see us at the poster session, 12-1pm on Sunday! Scott will be presenting this poster.
  • 78-LB, Detailing the Lived Experiences of People with Diabetes Using Do-it-Yourself Artificial Pancreas Systems – Qualitative Analysis of Responses to Open-Ended Items in an International Survey, co-authored by Bryan Cleal, Shane O’Donnell, Katarina Braune, Dana Lewis, Timothy C. Skinner, Bastian Hauck, Klemens Raille, and the OPEN consortium.
    • Come see us at the poster session, 12-1pm on Sunday! Bryan Cleal will be presenting this poster.

See below for full written summaries and pictures from each poster and the oral presentation.

First up: the biological rhythms poster, formally known as 1056-P in category 12-D Clinical Therapeutics/New Technology–Insulin Delivery Systems, Preliminary Characterization of Rhythmic Glucose Variability In Individuals With Type 1 Diabetes!

Lewis_Grant_BiologicalRhythmsT1D_ADA2019

As mentioned in this DiabetesMine interview, Azure Grant & I were thrilled to find out that we have been awarded a JDRF grant to further this research and undertake the first longitudinal study to characterize biological rhythms in T1D, which could also be used to inform improvements and personalize closed loop systems. This poster is part of the preliminary research we did in order to submit for this grant.

There is also a Twitter thread for this poster:

Poster from #ADA2019

Background:

  • Human physiology, including blood glucose, exhibits rhythms at multiple timescales, including hours (ultradian, UR), the day (circadian, CR), and the ~28-day female ovulatory cycle (OR).
  • Individuals with T1D may suffer rhythmic disruption due not only to the loss of insulin, but to injection of insulin that does not mimic natural insulin rhythms, the presence of endocrine-timing disruptive medications, and sleep disruption.
  • However, rhythms at multiple timescales in glucose have not been mapped in a large population of T1D, and the extent to which glucose rhythms differ in temporal structure between T1D and non-T1D individuals is not known.

Data & Methods:

  • The initial data set used for this work leverages the OpenAPS Data Commons. (This data set is available for all researchers  – see www.OpenAPS.org/data-commons)
  • All data was processed in Matlab 2018b with code written by Azure Grant. Frequency decompositions using the continuous morlet wavelet transformation were created to assess change in rhythmic composition of normalized blood glucose data from 5 non-T1D individuals and anonymized, retrospective CGM data from 19 T1D individuals using a DIY closed loop APS. Wavelet algorithms were modified from code made available by Dr. Tanya Leise at Amherst College (see http://bit.ly/LeiseWaveletAnalysis)

Results:

  • Inter and Intra-Individual Variability of Glucose Ultradian and Circadian Rhythms is Greater in T1D
Figure_BiologicalRhythms_Lewis_Grant_ADA2019

Figure 1. Single individual blood glucose over ~ 1 year with A.) High daily rhythm stability and B.) Low daily rhythm stability. Low glucose is shown in blue, high glucose in orange.

Figure 2. T1D individuals (N=19) showed a wide range of rhythmic power at the circadian and long-period ultradian timescales compared to individuals without T1D (N=5).

A). Individuals’ CR and UR power, reflecting amplitude and stability of CRs, varies widely in T1D individuals compared to those without T1D. UR power was of longer periodicity (>= 6 h) in T1D, likely due to DIA effects, whereas UR power was most commonly in the 1-3 hour range in non-T1D individuals (*not shown).  B.) On average, both CR and UR power were significantly higher in T1D (p<.05, Kruskal Wallis). This is most likely due to the higher amplitude of glucose oscillation, shown in two individuals in C.

Conclusions:

  • This is the first longitudinal analysis of the structure and variability of multi-timescale biological rhythms in T1D, compared to non-T1D individuals.
  • Individuals with T1D show a wide range of circadian and ultradian rhythmic amplitudes and stabilities, resulting in higher average and more variable wavelet power than in a smaller sample of non-T1D individuals.
  • Ultradian rhythms of people with T1D are of longer periodicity than individuals without T1D. These analyses constitute the first pass of a subset of these data sets, and will be continued over the next year.

Future work:

  • JDRF has recently funded our exploration of the Tidepool Big Data Donation Project, the OpenAPS Data Commons, and a set of non-T1D control data in order to map biological rhythms of glucose/insulin.
  • We will use signal processing techniques to thoroughly characterize URs, CRs, and ORs in the glucose/insulin for T1D; evaluate if stably rhythmic timing of glucose is associated with improved outcomes (lower HBA1C); and ultimately evaluate if modulation of insulin delivery based on time of day or time of ovulatory cycle could lead to improved outcomes.
  • Mapping population heterogeneity of these rhythms in people with and without T1D will improve understanding of real-world rhythmicity, and may lead to non-linear algorithms for optimizing glucose in T1D.

Acknowledgements:

We thank the OpenAPS community for their generous donation of data, and JDRF for the grant award to further this work, beginning in July 2019.

Contact:

Feel free to contact us at Dana@OpenAPS.org or azuredominique@berkeley.edu.

Next up, 78-LB, Detailing the Lived Experiences of People with Diabetes Using Do-it-Yourself Artificial Pancreas Systems – Qualitative Analysis of Responses to Open-Ended Items in an International Survey, co-authored by Bryan Cleal, Shane O’Donnell, Katarina Braune, Dana Lewis, Timothy C. Skinner, Bastian Hauck, Klemens Raille, and the OPEN consortium.

78-LB_LivedExperiencesDIYAPS_OPEN_ADA2019

There is also a Twitter thread for this poster:

Poster from OPEN survey on lived experiences

Introduction

There is currently a wave of interest in Do-it-Yourself Artificial Pancreas Systems (DIYAPS), but knowledge about how the use of these systems impacts on the lives of those that build and use them remains limited. Until now, only a select few have been able to give voice to their experiences in a research context. In this study we present data that addresses this shortcoming, detailing the lived experiences of people using DIYAPS in an extensive and diverse way.

Methods

An online survey with 34 items was distributed to DIYAPS users recruited through the Facebook groups “Looped” (and regional sub-groups) and Twitter pages of the Diabetes Online Community (DOC). Participants were posed two open-ended questions in the survey, where personal DIYAPS stories were garnered; including knowledge acquisition, decision-making, support and emotional aspects in the initiation of DIYAPS, perceived changes in clinical and quality of life (QoL) outcomes after initiation and difficulties encountered in the process. All answers were analyzed using thematic content analysis.

Results

In total, 886 adults responded to the survey and there were a combined 656 responses to the two open-ended items. Knowledge of DIYAPS was primarily obtained via exposure to the communication fora that constitute the DOC. The DOC was also a primary source of practical and emotional support (QUOTES A). Dramatic improvements in clinical and QoL outcomes were consistently reported (QUOTES B). The emotional impact was overwhelmingly positive, with participants emphasizing that the persistent presence of diabetes in everyday life was markedly reduced (QUOTES C). Acquisition of the requisite devices to initiate DIYAPS was sometimes problematic and some people did find building the systems to be technically challenging (QUOTE D). Overcoming these challenges did, however, leave people with a sense of accomplishment and, in some cases, improved levels of understanding and engagement with diabetes management (QUOTE E).

QuotesA_OPEN_ADA2019 QuotesB_OPEN_ADA2019 QuotesC_OPEN_ADA2019 QuotesD_OPEN_ADA2019 QuotesE_OPEN_ADA2019

Conclusion

The extensive testimony from users of DIYAPS acquired in this study provides new insights regarding the contours of this evolving phenomenon, highlighting factors inspiring people to adopt such solutions and underlining the transformative impact effective closed-loop systems bring to bear on the everyday lives of people with diabetes. Although DIYAPS is not a viable solution for everyone with type 1 diabetes, there is much to learn from those who have taken this route, and the life-changing results they have achieved should inspire all with an interest in artificial pancreas technology to pursue and dream of a future where all people with type 1 diabetes can reap the benefits that it potentially provides.

Also, see this word cloud generated from 665 responses in the two open-ended questions in the survey:

Wordle_OPEN_ADA2019

Next up is 117-LB, DIWHY: Factors Influencing Motivation, Barriers and Duration of DIY Artificial Pancreas System Use Among Real-World Users, co-authored by Katarina Braune, Shane O’Donnell, Bryan Cleal, Ingrid Willaing, Adrian Tappe, Dana Lewis, Bastian Hauck, Renza Scibilia, Elizabeth Rowley, Winne Ko, Geraldine Doyle, Tahar Kechadi, Timothy C. Skinner, Klemens Raille, and the OPEN consortium.

DIWHY_117-LB_OPEN_ADA2019

There is also a Twitter thread for this poster:

DIWHY Poster at ADA2019

Background

Until recently, digital innovations in healthcare have typically followed a ‘top-down’ pathway, with manufacturers leading the design and production of technology-enabled solutions and patients involved only as users of the end-product. However, this is now being disrupted by the increasing influence and popularity of more ‘bottom-up’ and patient-led open source initiatives. A primary example is the growing movement of people with diabetes (PwD) who create their own “Do-it-Yourself” Artificial Pancreas Systems (DIY APS) through remote-control of medical devices employing an open source algorithm.

Objective

Little is known about why PwD leave traditional care pathways and turn to DIY technology. This study aims to examine the motivations of current DIYAPS users and their caregivers.

Research Design and Methods

An online survey with 34 items was distributed to DIYAPS users recruited through the Facebook groups “Looped” (and regional sub-groups) and Twitter pages of the “DOC” (Diabetes Online Community). Self-reported data was collected, managed and analyzed using the secure REDCap electronic data capture tools hosted at Charité – Universitaetsmedizin Berlin.

Results

1058 participants from 34 countries (81.3 % Europe, 14.7 % North America, 6.0 % Australia/WP, 3.1 % Asia, 0.1 % Africa), responded to the survey, of which the majority were adults (80.2 %) with type 1 diabetes (98.9 %) using a DIY APS themselves (43.0 % female, 56.8 % male, 0.3 % other) with a median age of 41 y and an average diabetes duration of 25.2y ±13.3. 19.8 % of the participants were parents and/or caregivers of children with type 1 diabetes (99.4 %) using a DIY APS (47.4 % female, 52.6 % male) with a median age of 10 y and an average diabetes duration of 5.1y ± 3.8. People used various DIYAPS (58.2 % AndroidAPS, 28.5 % Loop, 18.8 % OpenAPS, 5.7 % other) on average for a duration of 10.1 months ±17.6 and reported an overall HbA1c-improvement of -0.83 % (from 7.07 % ±1.07 to 6.24 % ±0.68 %) and an overall Time in Range improvement of +19.86 % (from 63.21 % ±16.27 to 83.07 % ±10.11). Participants indicated that DIY APS use required them to pay out-of-pocket costs in addition to their standard healthcare expenses with an average amount of 712 USD spent per year.

Primary motivations for building a DIYAPS were to improve the overall glycaemic control, reduce acute and long-term complication risk, increase life expectancy and to put diabetes on ‘auto-pilot’ and interact less frequently with the system. Lack of commercially available closed loop systems and improvement of sleep quality was a motivation for some. For caregivers, improvement of their own sleep quality was the leading motivation. For adults, curiosity (medical or technical interest) had a higher impact on their motivation compared to caregivers. Some people feel that commercial systems do not suit their individual needs and prefer to use a customizable system, which is only available to them as a DIY solution. Other reasons, like costs of commercially available systems and unachieved therapy goals played a subordinate role. Lack of medical or psychosocial support was less likely to be motivating factors for both groups.

Figure_OPEN_DIWHY_ADA2019

Conclusions

Our findings suggest that people using Do-it-Yourself Artificial Pancreas systems and their caregivers are highly motivated to improve their/their children’s diabetes management through the use of this novel technology. They are also able to access and afford the tools needed to use these systems. Currently approved and available commercial therapy options may not be sufficiently flexible or customizable enough to fulfill their individual needs. As part of the project “OPEN”, the results of the DIWHY survey may contribute to a better understanding of the unmet needs of PwD and current challenges to uptake, which will, in turn, facilitate dialogue and collaboration to strengthen the involvement of open source approaches in healthcare.

This is a written version of the oral presentation, In-Depth Review of Glycemic Control and Glycemic Variability in People with Type 1 Diabetes Using Open Source Artificial Pancreas Systems, co-authored by Andreas Melmer, Thomas Züger, Dana Lewis, Scott Leibrand, Christoph Stettler, and Markus Laimer.

APSComponents_Melmer_ADA2019

Artificial Pancreas Systems (APS) now exist, leveraging a CGM sensor, pump, and control algorithm. Faster insulin can play a role, too.  Traditionally, APS is developed by commercial industry, tested by clinicians, regulated, and then patients can access it. However, DIYAPS is designed by patients for individual use.

There are now multiple different kinds of DIYAPS systems in use: #OpenAPS, Loop, and AndroidAPS. There are differences in hardware, pump, and software configurations. The main algorithm for OpenAPS is also used in AndroidAPS.  DIYAPS can work offline; and also leverage the cloud for accessing or displaying data, including for remote monitoring.OnlineOffline_Melmer_ADA2019

This study analyzed data from the OpenAPS Data Commons (see more here). At the time this data set was used, there were n=80 anonymized data donors from the #OpenAPS community, with a combined 53+ years worth of CGM data.

TIR_PostLooping_Melmer_ADA2019Looking at results for #OpenAPS data donors post-looping initiation, CV was 35.5±5.9, while eA1c was 6.4±0.7. TIR (3.9-10mmol/L) was 77.5%. Time spent >10 was 18.2%; time <3.9 was 4.3%.

SubcohortData_Melmer_ADA2019We selected a subcohort of n=34 who had data available from before DIY closed looping initiation (6.5 years combined of CGM records), as well as data from after (12.5 years of CGM records).

For these next set of graphs, blue is BEFORE initiation (when just on a traditional pump); red is AFTER, when they were using DIYAPS.

TIR_PrePost_Melmer_ADA2019Time in a range significantly increased for both wider (3.9-10 mmol/L) and tighter (3.9-7.8 mmol/L) ranges.

TOR_PrePost_Melmer_ADA2019Time spent out of range decreased. % time spent >10 mmol/L decreased -8.3±8.6 (p<0.001); >13 mmol/L decreased -3.3±5.0 (p<0.001). Change in % time spent <3.9 mmol/L (-1.1±3.8 (p=0.153)), and <3.0 mmol/L (-0.7±2.2 (p=0.017)) was not significant.

We also analyzed daytime and nightime (the above was reflecting all 24hr combined; these graphs shows the increase in TIR and decrease in time out of range for both day and night).

TIR_TOR_DayAndNight_Melmer_ADA2019

Hypoglemic_event_reduction_Melmer_ADA2019There were less CGM records in the hypoglycemic range after initiating DIYAPS.

Conclusion: this was a descriptive study analyzing available CGM data from  #OpenAPS Data Commons. This study shows OpenAPS has potential to support glycemic control. However, DIYAPS are currently not regulated/approved technology. Further research is recommended.

Conclusion_Melmer_ADA2019

(Note: a version of this study has been submitted and accepted for publication in the Journal of Diabetes. Obesity, and Metabolism.)

Tips and tricks for real life and living with an ankle fracture

As I wrote in a previous post with much more detail (see here), I fell off a mountain and broke my ankle in three places, then managed to break a bone in my 5th toe on the other foot. This meant that my right ankle was in a hard cast for 6 weeks and I was 100% non-weight bearing…but this was challenging because the foot meant to be my stable base for crutching or knee scootering was often pretty wobbly and in a lot of pain.

This post is a follow up with more detailed tips and lessons learned of things that were helpful in living with a leg cast, as well as what the return to weight bearing was really like. I couldn’t find a lot of good information about the transition to weight bearing was really like, so this is my take on information I was looking for and would have appreciated before and during the weight bearing progression process. (And if you’re looking for diabetes-specific stuff, it’s in the last section!)
Tips_weight_bearing_DanaMLewis
Dealing with lack of energy and fatigue

First, it’s worth noting something major about a fractured bone, and *especially* true if it’s a big bone fracture like some of mine were: it takes a lot of healing, which means a lot of energy going to the healing and not much energy left for every day living. I was constantly exhausted – and surprised by this fatigue – pretty much throughout this process. It made sense in the early days (say weeks 1-2 after fracture), but was frustrating to me how little I had energy to do even in the 4-6 weeks after my fracture.

But, then it got worse. Returning to weight bearing took *even more* energy. For example, on the first day of partial weight bearing, I was tasked with putting 25 lbs of weight on my foot in the walking boot. First by placing my foot on the scale and getting reliable with being able to put the right amount of weight on the boot; then by standing and repeating with the scale; then taking a few steps (with the crutches taking the rest of my weight) and re-calibrating with the scale until I was confident in that weight. With weight bearing progression, you’re supposed to spend up to an hour a day working on this.

I took to heart what my ortho said about not progressing fast if you only do 5-10 minute chunks, so after the first day, I tried to always do 10-15 minute chunks at a minimum, with a longer chunk wherever possible as permitted by pain and my energy levels.

But the first few days were really, really tough. It was hard to switch to a new weight every two days – because this meant readjusting how I was stepping/walking, and how much weight and where I placed my crutches. I started with a blister on my right palm, which turned into a squished nerve that made my right hand go numb, and ultimately damaged some tendons in my right wrist, too. This made it painful to use the crutches or even drive my knee scooter when I wasn’t focusing on weight bearing. So I had a lot of pain and suffering in the WB progression process that probably contributed to how fatigued I was overall.

So one of my biggest pieces of advice for anyone with broken bones is to expect your energy to take a(nother) dip for the first few weeks after you start returning to weight-bearing (or return to normal activity outside your cast). It’s a *lot* of work to regain strength in atrophied muscles while still also doing the internal healing on the broken bones!

Tips to deal with so much fatigue as you return to weight bearing:

Some of the tips and things I figured out for being non-weight bearing and sitting around with a hard cast came in handy for the weight-bearing progression fatigue, too.

  • I got a shower bench (this is the one I got) so that it was easy to sit down on and swing my legs over into the shower/bathtub. Once I was out of my hard cast, I still can’t weight bear without the boot, so I still need a sitting shower/bath solution while I return to weight bearing. I also removed the back after a while, so it was easier to sit in either direction depending on preference (washing hair/not) without having to ask Scott to remove the back and re-attach it on the other side.
  • Speaking of showers, I put a toothbrush and toothpaste in the shower so I can also brush my teeth there while seated.
  • I still keep most of my toiletries in the bedside table (or you could have a caddy by the bedside) so I can brush my hair, take my contacts out or put them in, wipe my face (facewipes instead of having to stand at the sink to wash my face), etc. from the bed.
  • I am taking ibuprofen 4x a day, and I get tired of opening the bottle. So I dumped a pile of ibuprofen on my bedside table to make it easy to reach and remember to take first thing in the morning or at night. (There are no kids or pets in my household; keep safety in mind if you have kids etc in your household – this solution may not work for you).
  • The one time I tended to forget to proactively take my medication was mid-day, so I added a recurring calendar event to my calendar saying “take ibuprofen if you haven’t 2x a day” around 2pm, which would be the latest I would take my second round, even if I woke up later in the day and my first dose was later in the morning. This has helped me remember multiple times, especially on weekends or times when I’m away from my desk or bed where I would have the meds visible as a reminder.
  • Pre-mix protein powder (this is what I chose) into the beverage of choice in advance, and keep it in individual containers so it’s easy to get and take (and if I’m really tired, round tupperware containers that have measurement lines make it easy to measure liquid into, put the lid on to shake it up, and drink out of without having to find another cup). I had Scott do this several days in advance when he went on a trip, and we kept doing it in advance even after he got home.
  • I kept using my portable desk for working, taking video calls propped up in the bed with pillows behind me, and also laying the surface flat to eat meals from when I was too tired to get out of the bed.

Other advice for the return to weight-bearing:

If you’re like me, you’ll switch back to weight-bearing accompanied by getting out of your hard cast and getting a walking boot of some sort. If you can, ask your ortho/doc in advance what kind of boot they’ll put you in. It’s often cheaper to get the boot yourself. Perfect example: my ortho didn’t tell me what kind of boot I would need, and I looked at various boots online and saw they ranged $50-100 on Amazon. At my appointment he asked if I brought a boot and since I didn’t, they’d provide one..and the paperwork I signed stated the price would be $427 (::choking::) if the insurance didn’t cover it. Insurance negotiated down to $152 for me to pay out of pocket for since I haven’t hit my deductible…which is still 2-3x more than retail cost. UGH. So, if you can, buy your walking boot via retail. (Same goes for purchasing a knee scooter (here’s the one I got) – it may be cheaper to buy it new through Amazon/elsewhere than getting a medical purchase that goes through insurance and/or trying to do a rental.)

  • You’ll also probably end up with a boot with lots of velcro straps. When you undo your boot, fold back the strap on itself so it doesn’t stick to the boot, another strap, your clothes, etc.
Other equipment that has come in handy:
  • Get multiple ankle braces. I had a slightly structured ankle brace with hard sides that made me feel safer the first few nights sleeping out of the cast, and it was often easier to go from the bed to the bathroom on my knee scooter or crutches with the ankle brace(s) instead of re-putting on my walking boot and taking it off again for a shower. (I transitioned to sleeping in a lighter ankle brace after a week or so, but still used the structured brace inside the waterproof cast bag for swimming laps to help protect my ankle.)
  • An ice pack with a strap to put around your ankle/broken joint. I had gotten this ice pack for my knee last fall, and strap it and another ice pack to my ankle to get full joint coverage.
  • Wide leg athletic pants…ideally ones that you can put on/off without having to take your boot off. (Women should note I found better athletic pants for this purpose in the men’s athletic section at Target..but be aware a lot of the modern men’s style have tapered legs so make sure to watch out for those and have enough width to get over your boot). Taking off the boot is exhausting with so many velcro straps, so any time I can get dressed or undressed without having to remove the boot if I am not otherwise removing the boot is a win.
  • Look online for your state’s rules for a temporary handicap parking pass, and take the paperwork to your first ortho appointment to get filled out. Also, make sure to note where the places are that you can drop off the paperwork in person (in Seattle it was not the same as the DMV offices!), or otherwise be aware of the time frame for mailing those in and receiving the pass. The handicap parking placard has been helpful for encouraging me to get out of the house more to go to the store or go to a restaurant when otherwise I’m too exhausted to do anything.
  • A new shiny notebook for writing down your daily activities and what you did. If you’re not a notebook type person, use an app or note on your phone. But despite being mostly digital, I liked having a small notebook by the bed to list my daily activities and check the box on them to emphasize the activities I was doing and the progress I was making. At the beginning, it was helpful for keeping track of all the new things I needed to do; in the middle, it was useful for emphasizing the progress I was making; and at the end it felt really good to see the light of the end of the tunnel of a few pages/days left toward being fully weight bearing.
Weightbearing_notebook_DanaMLewis

Other tips for getting used to a walking boot and transitioning to weight bearing:

  • Don’t be surprised if you have pain in new areas when you move from a hard cast to a walking boot. (Remember you’ll be moving your leg or limbs in different ways than they’ve been accustomed to).
  • My ortho told me the goal of weight bearing progression is to understand the difference between discomfort (lasts a few minutes) and pain (lasts a few hours). You’re likely going to be in discomfort when doing weight bearing progression – that’s normal. Pain (i.e. sharp pain) is not normal, and you should take a break or back down to a previous weight (follow your protocol) if you have it. I was lucky – the only few times I had pain was from trying to press down forcefully on the scale when seated, rather than standing on the scale and naturally letting my weight on my leg. I didn’t end up plateauing at any weight, and was able to follow my protocol of 25lb weight bearing added every 2 days and get to full weight bearing with no delays.
  • If you have a watch with a stopwatch feature, use it. It’s hard to keep track of actual time spent walking (especially at first when 90 seconds feels like 6 minutes) with just a normal watch/clock. You could also use your smartphone’s timer feature. But tracking the time and pausing when you pause or take a break helps make sure you’re accurately tracking toward your hour of walking.
  • The process wasn’t without discomfort – physical and emotional. Putting weight on my leg was scary, and every new weight day was hard as I dealt with the fear and processing of the discomfort, as well as learning how to step and walk and do my crutches in a new way yet again.
  • But what I learned is that the first 5 minutes of every new weight day ALWAYS sucked. Once I recognized this, I set the goal to always tough out a 15 minute session after I calibrated on the scale by walking slowly around my apartment. (I put my headphones in to listen to music while I did it). As long as there was only discomfort and not pain, I didn’t stop until after 15 minutes of slow walking with that weight and also re-calibrated on the scale during and after to make sure I was in the right ballpark.
  • I had to spend the first half hour or so working on my weight bearing by myself. I couldn’t talk on the phone or talk with Scott while I did it; it required a lot of concentration. (The only thing I could do is listen to music, because I’m used to running with music). So distractions did not help when I got started, but toward the end of the hour I could handle and appreciate distractions. Same for day 2 of a weight – having distractions or a task to do (e.g. walk from A to B, or walking while my nephew was on his scooter) helped pass the time and get me to complete my hour or more of weight-bearing work.
  • Be careful with your hands and wrists. Blisters are common, and I managed to both squish a nerve (which caused me to have a numb side of my hand and be unable to type for several days) and also pull or damage tendons on both sides of my wrists. I was torn between choosing to delay my weight bearing progression work, but also recognizing that the sooner I got to full weight bearing the sooner I could completely ditch my crutches and be done hurting my hands. So I chose to continue, but in some cases shortened my chunks of WB walking down to 15 minutes wherever possible to reduce the pain and pressure on my hands.
You’ll likely also be doing range of motion exercises. At first, it’s scary how jerky your motions may be and how little your muscles and tendons respond to your brain’s commands. One thing I did was take a video on day 1 showing me pointing and stretching my ankle, and doing my ABC’s with my foot. Then every week or so when I was feeling down and frustrated about how my ankle wasn’t fully mobile yet, I’d take another video and watch the old one to compare. I was able to see progress every few days in terms of being able to point my foot more, and wider motions for doing the ABC’s with my foot.
Also remember, once you’re weight bearing and working toward getting rid of your crutches, you can use things like strollers or grocery carts to help you balance (and also kill some of your weight bearing time!) without crutches. The practice will make it easier for re-learning your posture and gaining confidence in walking without crutches.

Using my nephew's stroller to support me walking in a boot after my ankle fracture as I returned to weight bearing

Don’t you usually talk about diabetes stuff on this blog? 😉

(If anyone finds this post in the future mainly for ankle fracture and weight bearing transition/progression tips, you can ignore this part!)

Diabetes-wise, I’ve had a pretty consistent experience as to what I articulated in the last post about actually breaking bones.

  • It was common for my first few days of progressive weight bearing to have a small pain/stress rise in my BGs. It wasn’t much, but 20-30 points was an obvious stress response as I did the first few 15 minutes of weight bearing practice. The following days didn’t see this, so my body was obviously getting used to the stress of weight bearing again.
  • However, on the flip side, the first week of weight bearing progression also caused several lows. The hour of walking was the equivalent of any new activity where I usually have several hours later delayed sensitivity to insulin out of nowhere, and my blood sugars “go whoosh” – dropping far more than they normally would. I had two nights in a row in the first week where I woke up 2-3 hours after I went to sleep and needed to eat some carbs. This normally happens maybe once every few months (if that) now as an OpenAPS user, so it was obviously associated with this new surge of physical activity and hard work that I was doing for the weight bearing.
  • Overall, while I was 100% non-weight bearing, I was eating slightly (but not much) lower carb and slightly less processed food than I usually do. But not always. One day I ended up having 205+ grams of carbs for me (quite a bit more than my average). However, thanks to #OpenAPS, I still managed to have a 100% in range day (80-150 mg/dL). Similarly on a travel day soon after, I ate a lot less (<50g carb) and also had a great day where OpenAPS took care of any surges and dips automatically – and more importantly, without any extra work and energy on my part. Having OpenAPS during the broken bone recovery has been a HUGE benefit, not only for keeping my BGs in range so much of the time for optimal healing, but also for significantly reducing the amount of work and cognitive burden it takes to stay alive with type 1 diabetes in general. I barely had energy to eat and do my hour of weight bearing each day, let alone anything else. Thankfully good BGs didn’t fall by the wayside, but without this tech it certainly would have.

And finally the pep talk I gave myself every day during weight bearing progression work:

This is short-term and necessary discomfort and suffering on the way to weight bearing. It sucks, but you can and will do it. You have to do it. If you need to take a break, take a break. If you need to do something else to get yourself pumped up and motivated to do your weight bearing, it’s ok to do that. But you’ll get there. Slowly, but surely. You’ve got this!

Proof that I did get there:

Lots of 100 emojis celebrating 100% weight bearing after my broken ankle

Best of luck and lots of support and encouragement to anyone who’s working their way to weight bearing after an injury, and many thanks to everyone who’s supported me and cheered me on virtually along the way!

2021 update – see this post about (finally) running the marathon that I had signed up for before I broke my ankle!

Missing metrics in diabetes measurement by @DanaMLewis

“May I ask what your A1c is?”

This is a polite, and seemingly innocuous question. However, it’s one of my least favorite questions taken at face value. Why?

Well, this question is often a proxy for some of the following questions:

  • How well are *you* doing with DIY closed loop technology?
  • How well could *I* possibly do with DIY closed loop technology?
  • What’s possible to achieve in real-world life with type 1 diabetes?

But if I answered this question directly with “X.x%”, it leaves out so much crucial information. Such as:

  • What my BG targets are
    • Because with DIY closed loop tech like OpenAPS, you can choose and set your own target.
    • (That’s also one of the reasons why the 2018 OpenAPS Outcomes Study is fascinating to me, because people usually set high, conservative targets to start and then gradually lower them as they get comfortable. However, we didn’t have a way to retrospectively sleuth out targets, so those are results are even with the amalgamation of people’s targets being at any point they wanted at any time.)
  • What type of lifestyle I live
    • I don’t consider myself to eat particularly “high” or “low” carb. (And don’t start at me about why you choose to eat X amount of carbs – you do you! and YDMV) Someone who *is* eating a lot higher or lower carb diet compared to mine, though, may have a different experience than me.
    • Someone who is not doing exercise or activity may also have a different experience then me with variability in BGs. Sometimes I’m super active, climbing mountains (and falling off of them..more detail about that here) and running marathons and swimming or scuba diving, and sometimes I’m not. That activity is not so much about “being healthy”, but a point about how exercise and activity can actually make it a lot harder to manage BGs, both due to the volatility of the activity on insulin sensitivity etc.; but also because of the factor of going on/off of insulin for a period of time (because my pump is not waterproof).
  • What settings I have enabled in OpenAPS
    • I use most of the advanced settings, such as “superMicroBoluses” (aka SMB – read more about how it works here); with a higher than default “maxSMBBasalMinutes”; and I also use all of the advanced exercise settings so that targets also nudge sensitivity in addition to autosensitivity picking up any changes after exercise and other sensitivity-change-inducing activities or events. I also get Pushover alerts to tell me if I need any carbs (and how many), if I’m dropping faster and expected to go below my target, even with zero temping all the way down.
  • What my behavioral choices are
    • Timing of insulin matters. As I learned almost 5 years ago (wow), the impact of insulin timing compared to food *really* matters. Some people still are able to do and manage well with “pre-bolusing”. I don’t (as explained there in the previous link). But “eating soon” mode does help a lot for managing post-meal spikes (see here a quick and easy visual for how to do “eating soon”). However, I don’t do “eating soon” regularly like I used to. In part, because I’m now on a slightly-faster insulin that peaks in 45 minutes. I still get better outcomes when I do an eating-soon, sure, but behaviorally it’s less necessary.
    • The other reason is because I’ve also switched to not bolusing for meals.
      • (The exceptions being if I’m not looping for some reason, such as I’m in the middle of switching CGM sensors and don’t have CGM data to loop off of.)

These settings and choices are all crucial information to understanding the X.x% of A1c.

Diabetes isn’t just the average blood glucose value. It’s not just the standard deviation or coefficient of variation or % time in range or how much BG fluctuates.

Diabetes impacts so much of our daily life and requires so much cognitive burden for us, and our loved ones. That’s part of the reasons I appreciate so much Sulka & his family being candid about how their A1C didn’t change, but the amount of work required to achieve it did (way fewer manual corrections). And ditto for Jason & the Wittmer family for sharing about the change in the number of school nurse visits before/after using OpenAPS. (See both of their stories in this post)

For me, my quality of life metric has always been first about sleep: can I sleep safely and with peace of mind at night? Yes. Then – how long can I safely sleep? (The answer: a lot. Yay!)  But over time, my metrics have also evolved to consider how I can cut down (like Sulka) on the amount of work it takes to achieve my ideal outcomes, and find a happy balance there.

As I mentioned in this podcast recently, other than changing my pump site (here’s how I change mine) and soaking and swapping my CGM sensors (psst – soak your sensor!), I usually only take a few diabetes-related actions a day. They’re usually on my watch, pressing a button to either enable a temp target or entering carbs when I sit down to eat.

That’s a huge reduction in physical work, as well as amount of time spent thinking/planning/doing diabetes-related things. And when life happens – because I get the flu or the norovirus or I fall off a mountain and break my ankle – I don’t worry about diabetes any more.

So when I’m asked about A1c, my answer is not a simple “X.x%”. (And not just for the reason I’m annoyed by how much judging and shaming goes on around A1c, although that influences it, too.) I usually remind people that I first started with an “open loop” for a year, and that dropped my A1c by X%. And then I closed the loop, which reduced my A1c further. And we made OpenAPS even better over the last four years, which reduced it further. And then I completely stopped bolusing! And got less lows…and kept the same A1c.

And then I ask them what they’d really like to know. :) If it’s a fellow person with diabetes or a loved one, we talk about what problems they might be having or what areas they’d like to improve or what behaviors they’d like to change, if any. That’s usually way more effective than hearing “X.x%” of an A1c, and them wondering silently how to get there or what to do differently if someone wants to change things. (Or for clinicians who ask me, it turns into a discussion about choices and behaviors and tradeoffs that patients may choose to make.)

Remember, your diabetes may (and will) vary (aka, YDMV). Your lifestyle, the phase of life you’re in, your priorities, your body and health, and your choices will ALL be different than mine. That’s not bad in any way: that’s just the way it is. The behaviors I choose and the work I’m willing to do (or not do) to achieve *my* goals (and what my goals are), will be different than what you choose for yours.

And that’s therefore why A1c is not “enough” to me as a metric and something that we should compare people on, even though A1c is the “same” for everyone: because the work, time spent, behavioral tradeoffs, and goals related to it will all vary.

Missing_metrics_@DanaMLewis