You’ve probably heard about new AI (artificial intelligence) tools like ChatGPT, Bard, Midjourney, DALL-E and others. But, what are they good for?
Last fall I started experimenting with them. I looked at AI art tools and found them to be challenging, at the time, for one of my purposes, which was creating characters and illustrating a storyline with consistent characters for some of my children’s books. I also tested GPT-3 (meaning version 3.0 of GPT). It wasn’t that great, to be honest. But later, GPT-3.5 was released, along with the ChatGPT chat interface to it, which WAS a big improvement for a lot of my use cases. (And now, GPT-4 is out and is an even bigger improvement, although it costs more to use. More on the cost differences below)
So what am I using these AI tools for? And how might YOU use some of these AI tools? And what are the limitations? This is what I’ve learned:
- The most frequent way I use these AI tools is for getting started on a project, especially those related to writing.
You know the feeling of staring at a blank page and not knowing where to start? Maybe it’s the blank page of a cold email; the blank page of an essay or paper you need to write; the blank page of the outline for a presentation. Starting is hard!
Even for this blog post, I had a list of bulleted notes of things I wanted to remember to include. But I wasn’t sure how I wanted to start the blog post or incorporate them. I stuck the notes in ChatGPT and asked it to expand the notes.
What did it do? It wrote a few paragraph summary. Which isn’t what I wanted, so I asked it again to use the notes and this time “expand each bullet into a few sentences, rather than summarizing”. With these clear directions, it did, and I was able to look at this content and decide what I wanted to edit, include, or remove.
Sometimes I’m stuck on a particular writing task, and I use ChatGPT to break it down. In addition to kick-starting any type of writing overall, I’ve asked it to:
- Take an outline of notes and summarize them into an introduction; limitations section; discussion section; conclusion; one paragraph summary; etc.
- Take a bullet point list of notes and write full, complete sentences.
- Take a long list of notes I’ve written about data I’ve extracted from a systematic review I was working on, and ask it about recurring themes or outlier concepts. Especially when I had 20 pages (!) of hand-written notes in bullets with some loose organization by section, I could feed in chunks of content and get help getting the big picture from that 20 pages of content I had created. It can highlight themes in the data based on the written narratives around the data.
A lot of times, the best thing it does is it prompts my brain to say “that’s not correct! It should be talking about…” and I’m able to more easily write the content that was in the back of my brain all along. I probably use 5% of what it’s written, and more frequently use it as a springboard for my writing. That might be unique to how I’m using it, though, and other simple use cases such as writing an email to someone or other simplistic content tasks may mean you can keep 90% or more of the content to use.
2. It can also help analyze data (caution alert!) if you understand how the tools work.
Huge learning moment here: these tools are called LLMs (large language models). They are trained on large amounts of language. They’re essentially designed so that, based on all of those words (language) it’s taken in previously, to predict content that “sounds” like what would come after a given prompt. So if you ask it to write a song or a haiku, it “knows” what a song or a haiku “looks” like, and can generate words to match those patterns.
It’s essentially a PATTERN MATCHER on WORDS. Yeah, I’m yelling in all caps here because this is the biggest confusion I see. ChatGPT or most of these LLMs don’t have access to the internet; they’re not looking up in a search engine for an answer. If you ask it a question about a person, it’s going to give you an answer (because it knows what this type of answer “sounds” like), but depending on the amount of information it “remembers”, some may be accurate and some may be 100% made up.
Why am I explaining this? Remember the above section where I highlighted how it can start to sense themes in the data? It’s not answering solely based on the raw data; it’s not doing analysis of the data, but mostly of the words surrounding the data. For example, you can paste in data (from a spreadsheet) and ask it questions. I did that once, pasting in some data from a pivot table and asking it the same question I had asked myself in analyzing the data. It gave me the same sense of the data that I had based on my own analysis, then pointed out it was only qualitative analysis and that I should also do quantitative statistical analysis. So I asked it if it could do quantitative statistical analysis. It said yes, it could, and spit out some numbers and described the methods of quantitative statistical analysis.
But here’s the thing: those numbers were completely made up!
It can’t actually use (in its current design) the methods it was describing verbally, and instead made up numbers that ‘sounded’ right.
So I asked it to describe how to do that statistical method in Google Sheets. It provided the formula and instructions; I did that analysis myself; and confirmed that the numbers it had given me were 100% made up.
The takeaway here is: it outright said it could do a thing (quantitative statistical analysis) that it can’t do. It’s like a human in some regards: some humans will lie or fudge and make stuff up when you talk to them. It’s helpful to be aware and query whether someone has relevant expertise, what their motivations are, etc. in determining whether or not to use their advice/input on something. The same should go for these AI tools! Knowing this is an LLM and it’s going to pattern match on language helps you pinpoint when it’s going to be prone to making stuff up. Humans are especially likely to make something up that sounds plausible in situations where they’re “expected” to know the answer. LLMs are in that situation all the time: sometimes they actually do know an answer, sometimes they have a good guess, and sometimes they’re just pattern matching and coming up with something that sounds plausible.
In short:
- LLM’s can expand general concepts and write language about what is generally well known based on its training data.
- Try to ask it a particular fact, though, and it’s probably going to make stuff up, whether that’s about a person or a concept – you need to fact check it elsewhere.
- It can’t do math!
But what it can do is teach you or show you how to do the math, the coding, or whatever thing you wish it would do for you. And this gets into one of my favorite use cases for it.
3. You can get an LLM to teach you how to use new tools, solve problems, and lower the barrier to entry (and friction) on using new tools, languages, and software.
One of the first things I did was ask ChatGPT to help me write a script. In fact, that’s what I did to expedite the process of finding tweets where I had used an image in order to get a screenshot to embed on my blog, rather than embedding the tweet.
It’s now so easy to generate code for scripts, regardless of which language you have previous experience with. I used to write all of my code as bash scripts, because that’s the format I was most familiar with. But ChatGPT likes to do things as Python scripts, so I asked it simple questions like “how do I call a python script from the command line” after I asked it to write a script and it generated a python script. Sure, you could search in a search engine or Stack Overflow for similar questions and get the same information. But one nice thing is that if you have it generate a script and then ask it step by step how to run a script, it gives you step by step instructions in context of what you were doing. So instead of saying “to run a script, type `python script.py’”, using placeholder names, it’ll say “to run the script, use ‘python actual-name-of-the-script-it-built-you.py’ “ and you can click the button to copy that, paste it in, and hit enter. It saves a lot of time for figuring out how to take placeholder information (which you would get from a traditional search engine result or Stack Overflow, where people are fond of things like saying FOOBAR and you have no idea if that means something or is meant to be a placeholder). Careful observers will notice that the latest scripts I’ve added to my Open Humans Data Tools repository (which is packed with a bunch of scripts to help work with big datasets!) are now in Python rather than bash; such as when I was adding new scripts for fellow researchers looking to check for updates in big datasets (such as the OpenAPS Data Commons). This is because I used GPT to help with those scripts!
It’s really easy now to go from an idea to a script. If you’re able to describe it logically, you can ask it to write a script, tell you how to run it, and help you debug it. Sometimes you can start by asking it a question, such as “Is it possible to do Y?” and it describes a method. You need to test the method or check for it elsewhere, but things like uploading a list of DOIs to Mendeley to save me hundreds of clicks? I didn’t realize Mendeley had an API or that I could write a script that would do that! ChatGPT helped me write the script, figure out how to create a developer account and app access information for Mendeley, and debug along the way so I ended up within an hour and a half of having a tool that easily saved me 3 hours on the very first project that I used it with.
I’m gushing about this because there’s probably a lot of ideas you have that you immediately throw out as being too hard, or you don’t know how to do it. It takes time, but I’m learning to remember to think “I should ask the LLM this” and ask it questions such as:
- Is it possible to do X?
- Write a script to do X.
- I have X data. Pretend I am someone who doesn’t know how to use Y software and explain how I should do Z.
Another thing I’ve done frequently is ask it to help me quickly write a complex formula to use in a spreadsheet. Such as “write a formula that can be used in Google Sheets to take an average of the values in M3:M84 if they are greater than zero”.
It gives me the formula, and also describes it, and in some cases, gives alternative options.
Other things I’ve done with spreadsheets include:
- Ask it to write a conditional formatting custom formula, then give me instructions for expanding the conditional formatting to apply to a certain cell range.
- Asking it to check if a cell is filled with a particular value and then repeating the value in the new cell, in order to create new data series to use in particular charts and graphs I wanted to create from my data.
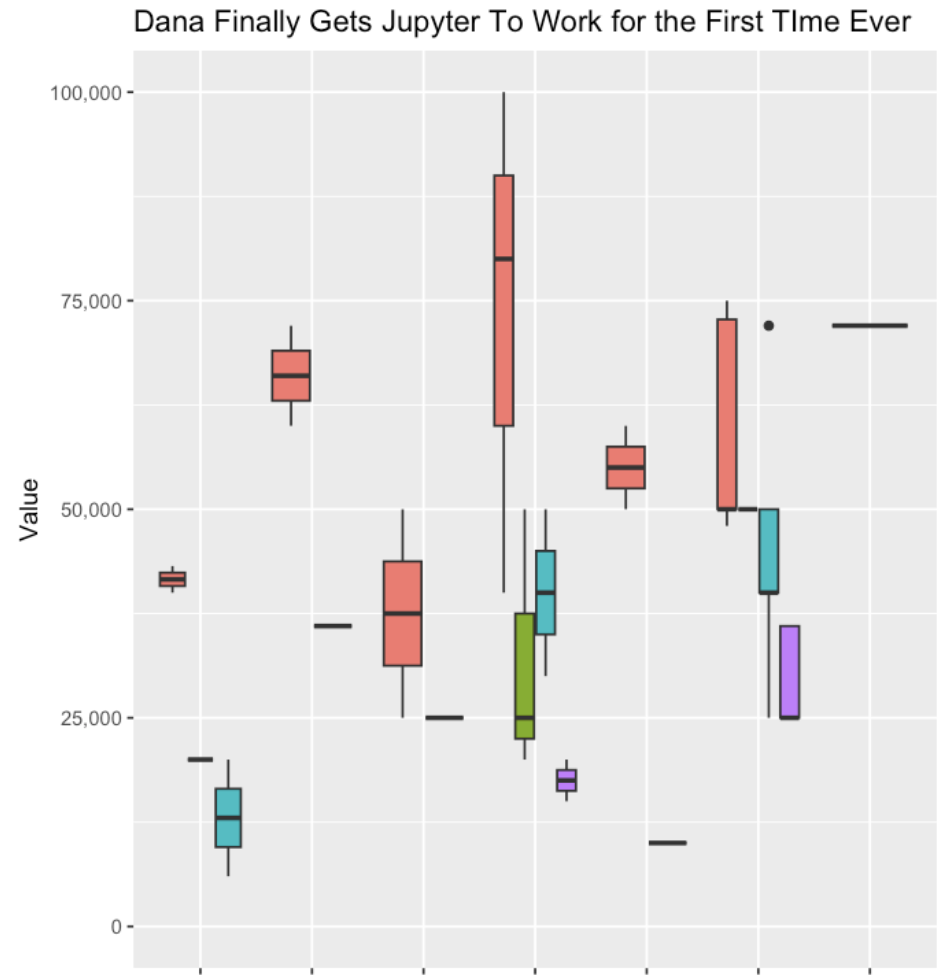
- Help me transform my data so I could generate a box and whisker plot.
- Ask it for other visuals that might be effective ways to illustrate and visualize the same dataset.
- Explain the difference between two similar formulas (e.g. COUNT and COUNTA or when to use IF and IFS).
This has been incredibly helpful especially with some of my self-tracked datasets (particularly around thyroid-related symptom data) where I’m still trying to figure out the relationship between thyroid levels, thyroid antibody levels, and symptom data (and things like menstrual cycle timing). I’ve used it for creating the formulas and solutions I’ve talked about in projects such as the one where I created a “today” line that dynamically updates in a chart.
It’s also helped me get past the friction of setting up new tools. Case in point, Jupyter notebooks. I’ve used them in the web browser version before, but often had issues running the notebooks people gave me. I debugged and did all kinds of troubleshooting, but have not for years been able to get it successfully installed locally on (multiple of) my computers. I had finally given up on effectively using notebooks and definitely given up on running it locally on my machine.
However, I decided to see if I could get ChatGPT to coax me through the install process.
I told it:
“I have this table with data. Pretend I am someone who has never used R before. Tell me, step by step, how to use a Jupyter notebook to generate a box and whisker plot using this data”
(and I pasted my data that I had copied from a spreadsheet, then hit enter).
It outlined exactly what I needed to do, saying to install Jupyter Notebook locally if I hadn’t, gave me code to do that, installing the R kernel, told me how to do that, then how to start a notebook all the way down to what code to put in the notebook, the data transformed that I could copy/paste, and all the code that generated the plot.
However, remember I have never been able to successfully get Jupyter Notebooks running! For years! I was stuck on step 2, installing R. I said:
“Step 2, explain to me how I enter those commands in R? Do I do this in Terminal?”
It said “Oh apologies, no, you run those commands elsewhere, preferably in Rstudio. Here is how to download RStudio and run the commands”.
So, like humans often do, it glossed over a crucial step. But it went back and explained it to me and kept giving more detailed instructions and helping me debug various errors. After 5-6 more troubleshooting steps, it worked! And I was able to open Jupyter Notebooks locally and get it working!
All along, most of the tutorials I had been reading had skipped or glossed over that I needed to do something with R, and where that was. Probably because most people writing the tutorials are already data scientists who have worked with R and RStudio etc, so they didn’t know those dependencies were baked in! Using ChatGPT helped me be able to put in every error message or every place I got stuck, and it coached me through each spot (with no judgment or impatience). It was great!
I was then able to continue with the other steps of getting my data transformed, into the notebook, running the code, and generating my first ever box and whisker plot with R!
This is where I really saw the power of these tools, reducing the friction of trying something new (a tool, a piece of software, a new method, a new language, etc.) and helping you troubleshoot patiently step by step.
Does it sometimes skip steps or give you solutions that don’t work? Yes. But it’s still a LOT faster than manually debugging, trying to find someone to help, or spending hours in a search engine or Stack Overflow trying to translate generic code/advice/solutions into something that works on your setup. The beauty of these tools is you can simply paste in the error message and it goes “oh, sorry, try this to solve that error”.
Because the barrier to entry is so low (compared to before), I’ve also asked it to help me with other project ideas where I previously didn’t want to spend the time needed to learn new software and languages and all the nuances of getting from start to end of a project.
Such as, building an iOS app by myself.
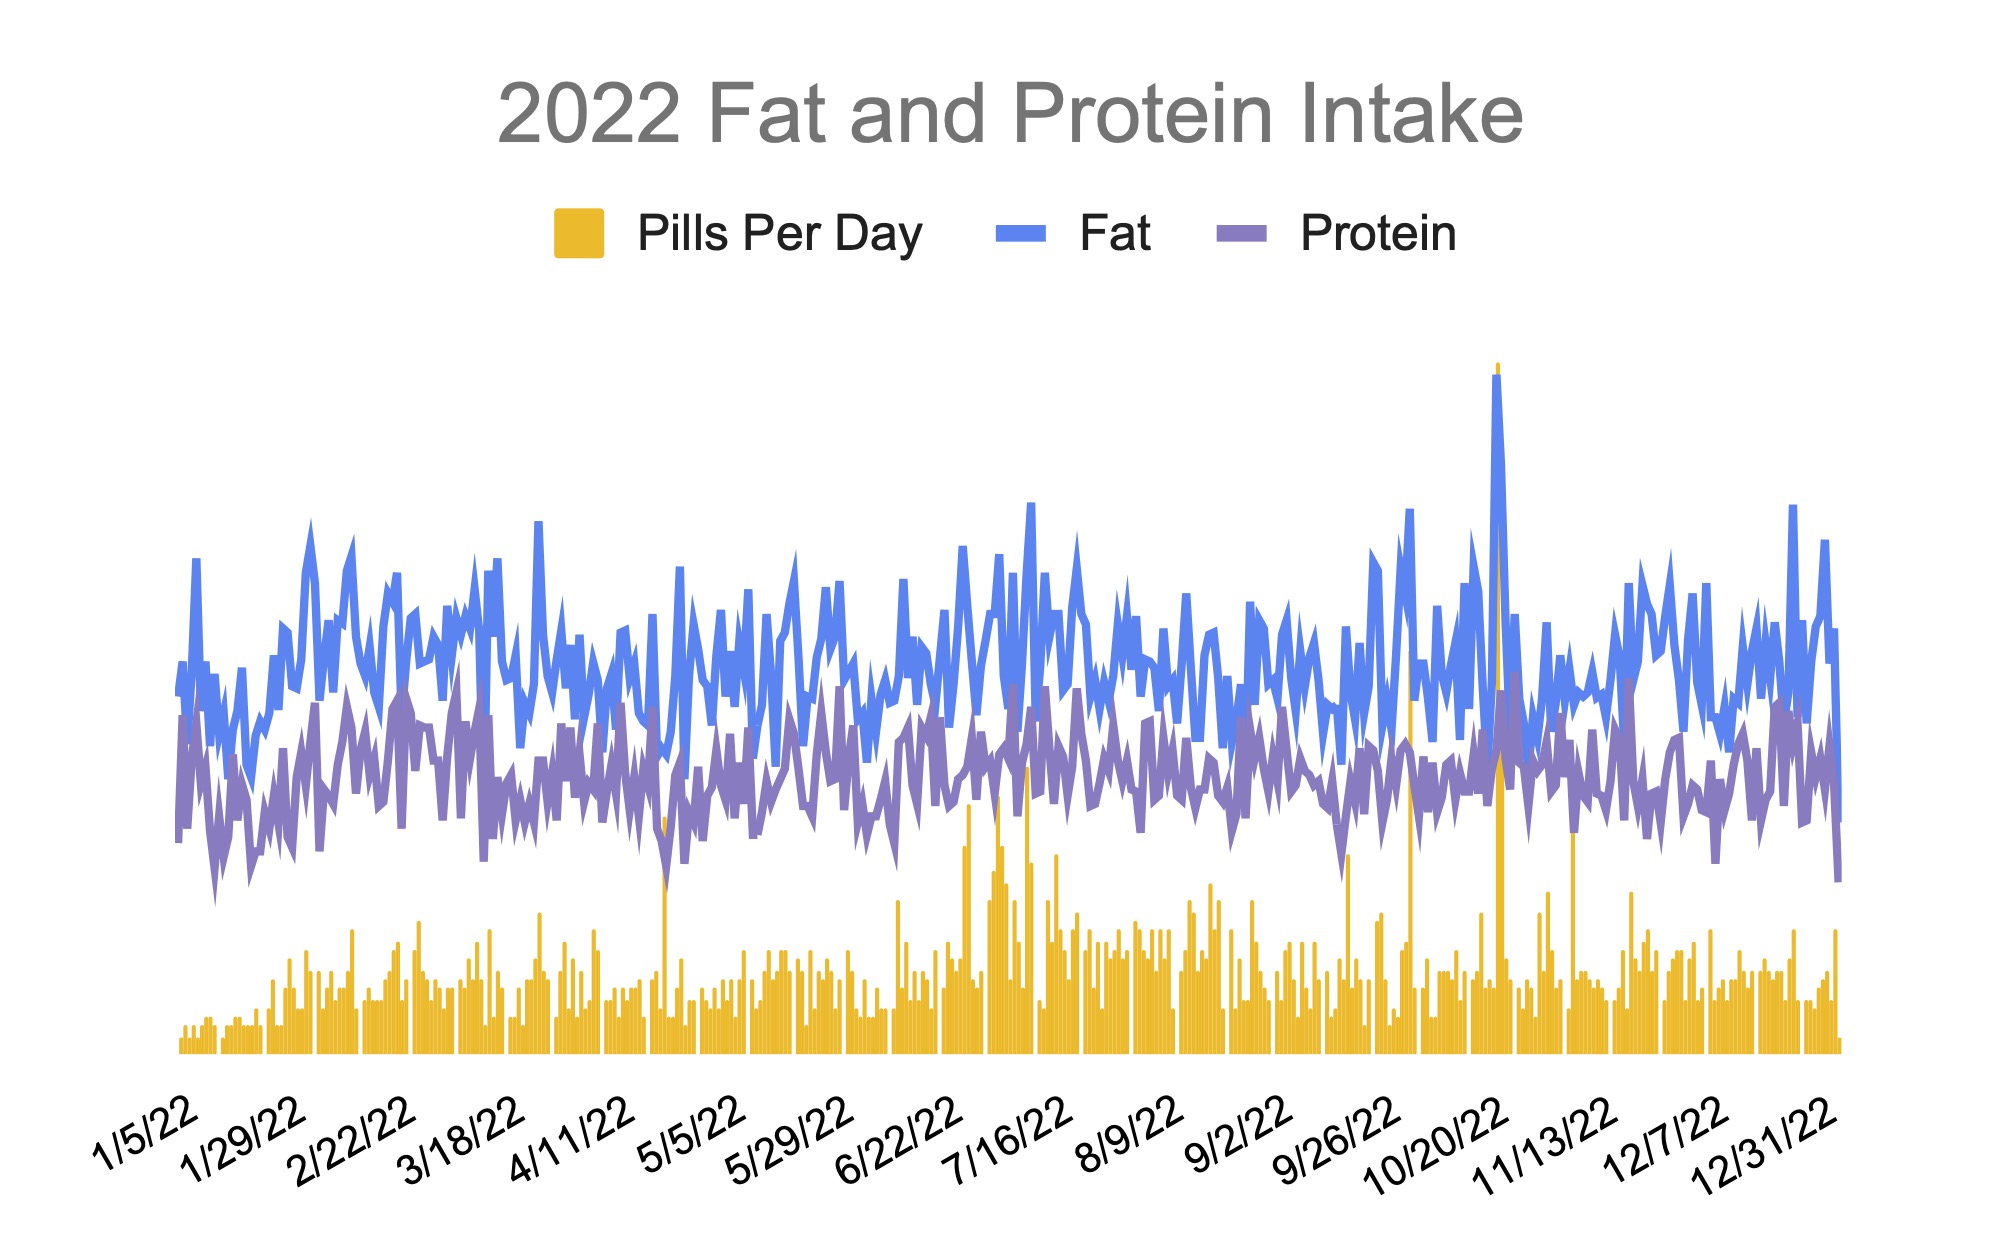
I have a ton of projects where I want to temporarily track certain types of data for a short period of time. My fall back is usually a spreadsheet on my phone, but it’s not always easy to quickly enter data on a spreadsheet on your phone, even if you set up a template with a drop down menu like I’ve done in the past (for my DIY macronutrient tool, for example). For example, I want to see if there’s a correlation in my blood pressure at different times and patterns of inflammation in my eyelid and heart rate symptoms (which are symptoms, for me, of thyroid antibodies being out of range, due to Graves’ disease). That means I need to track my symptom data, but also now some blood pressure data. I want to be able to put these datasets together easily, which I can, but the hardest part (so to speak) is finding a way that I am willing to record my blood pressure data. I don’t want to use an existing BP tracking app, and I don’t want a connected BP monitor, and I don’t want to use Apple Health. (Yes, I’m picky!)
I decided to ask ChatGPT to help me accomplish this. I told it:
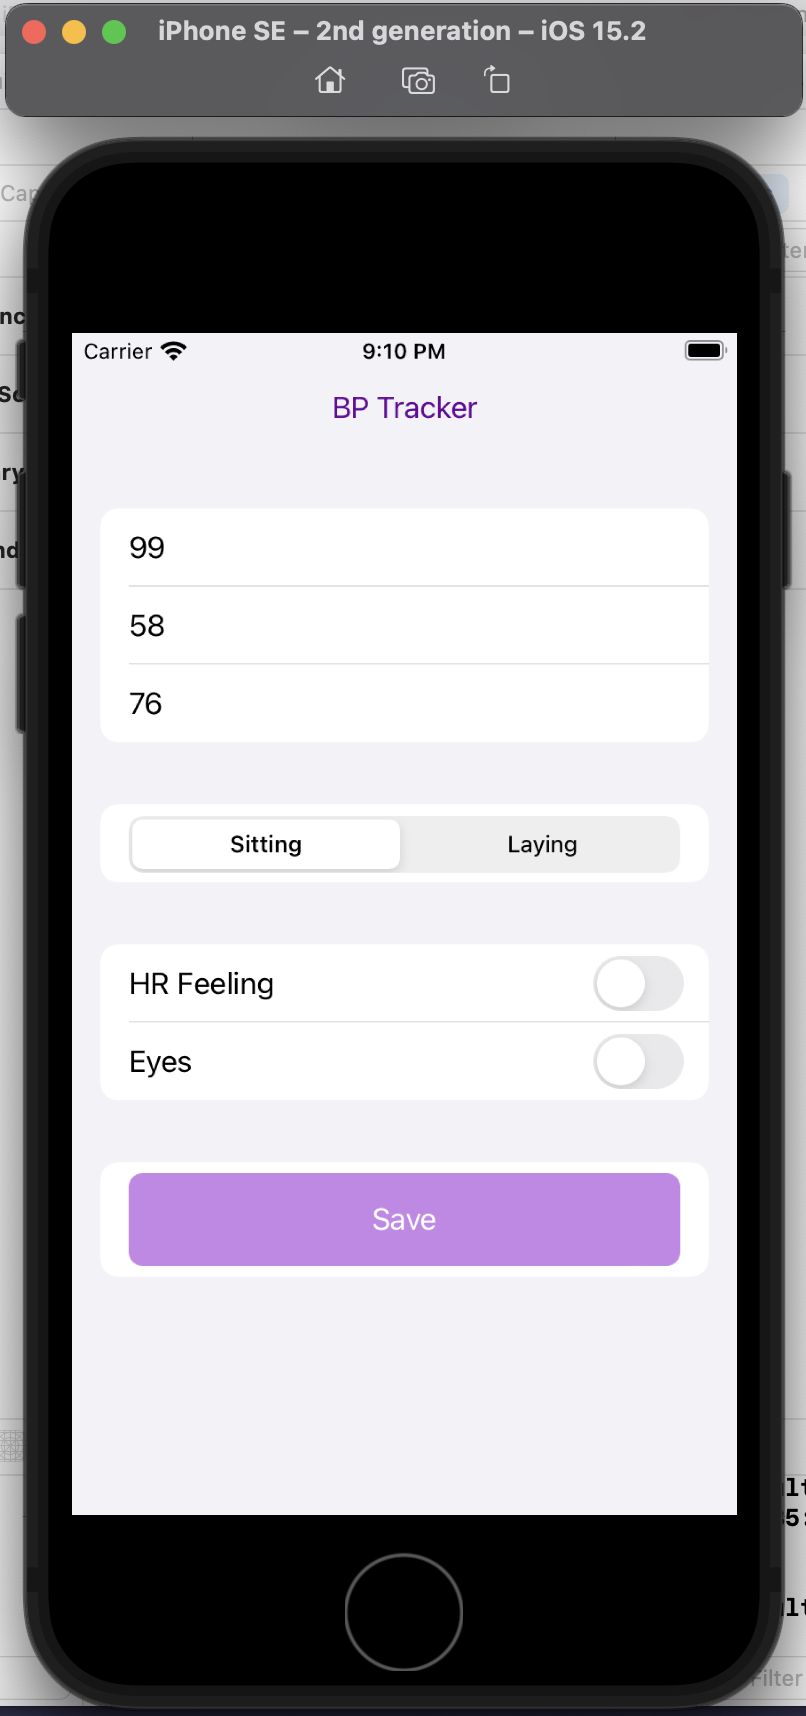
“You’re an AI programming assistant. Help me write a basic iOS app using Swift UI. The goal is a simple blood pressure tracking app. I want the user interface to default to the data entry screen where there should be three boxes to take the systolic, diastolic blood pressure numbers and also the pulse. There should also be selection boxes to indicate whether the BP was taken sitting up or laying down. Also, enable the selection of a section of symptom check boxes that include “HR feeling” and “Eyes”. Once entered on this screen, the data should save to a google spreadsheet.”
This is a completely custom, DIY, n of 1 app. I don’t care about it working for anyone else, I simply want to be able to enter my blood pressure, pulse, whether I’m sitting or laying down, and the two specific, unique to me symptoms I’m trying to analyze alongside the BP data.
And it helped me build this! It taught me how to set up a new SwiftUI project in XCode, gave me code for the user interface, how to set up an API with Google Sheets, write code to save the data to Sheets, and get the app to run.
(I am still debugging the connection to Google Sheets, so in the interim I changed my mind and had it create another screen to display the stored data then enable it to email me a CSV file, because it’s so easy to write scripts or formulas to take data from two sources and append it together!)
Is it fancy? No. Am I going to try to distribute it? No. It’s meeting a custom need to enable me to collect specific data super easily over a short period of time in a way that my previous tools did not enable.
Here’s a preview of my custom app running in a simulator phone:
I did this in a few hours, rather than taking days or weeks. And now, the barrier to entry to creating more custom iOS is reduced, because now I’m more comfortable working with XCode and the file structures and what it takes to build and deploy an app! Sure, again, I could have learned to do this in other ways, but the learning curve is drastically shortened and it takes away most of the ‘getting started’ friction.
That’s the theme across all of these projects:
- Barriers to entry are lower and it’s easier to get started
- It’s easier to try things, even if they flop
- There’s a quicker learning curve on new tools, technologies and languages
- You get customized support and troubleshooting without having to translate through as many generic placeholders
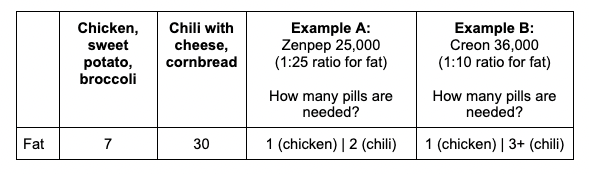
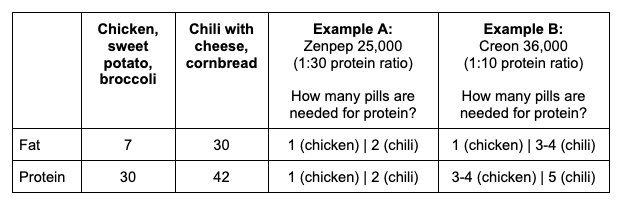
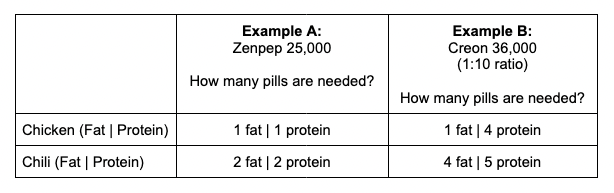
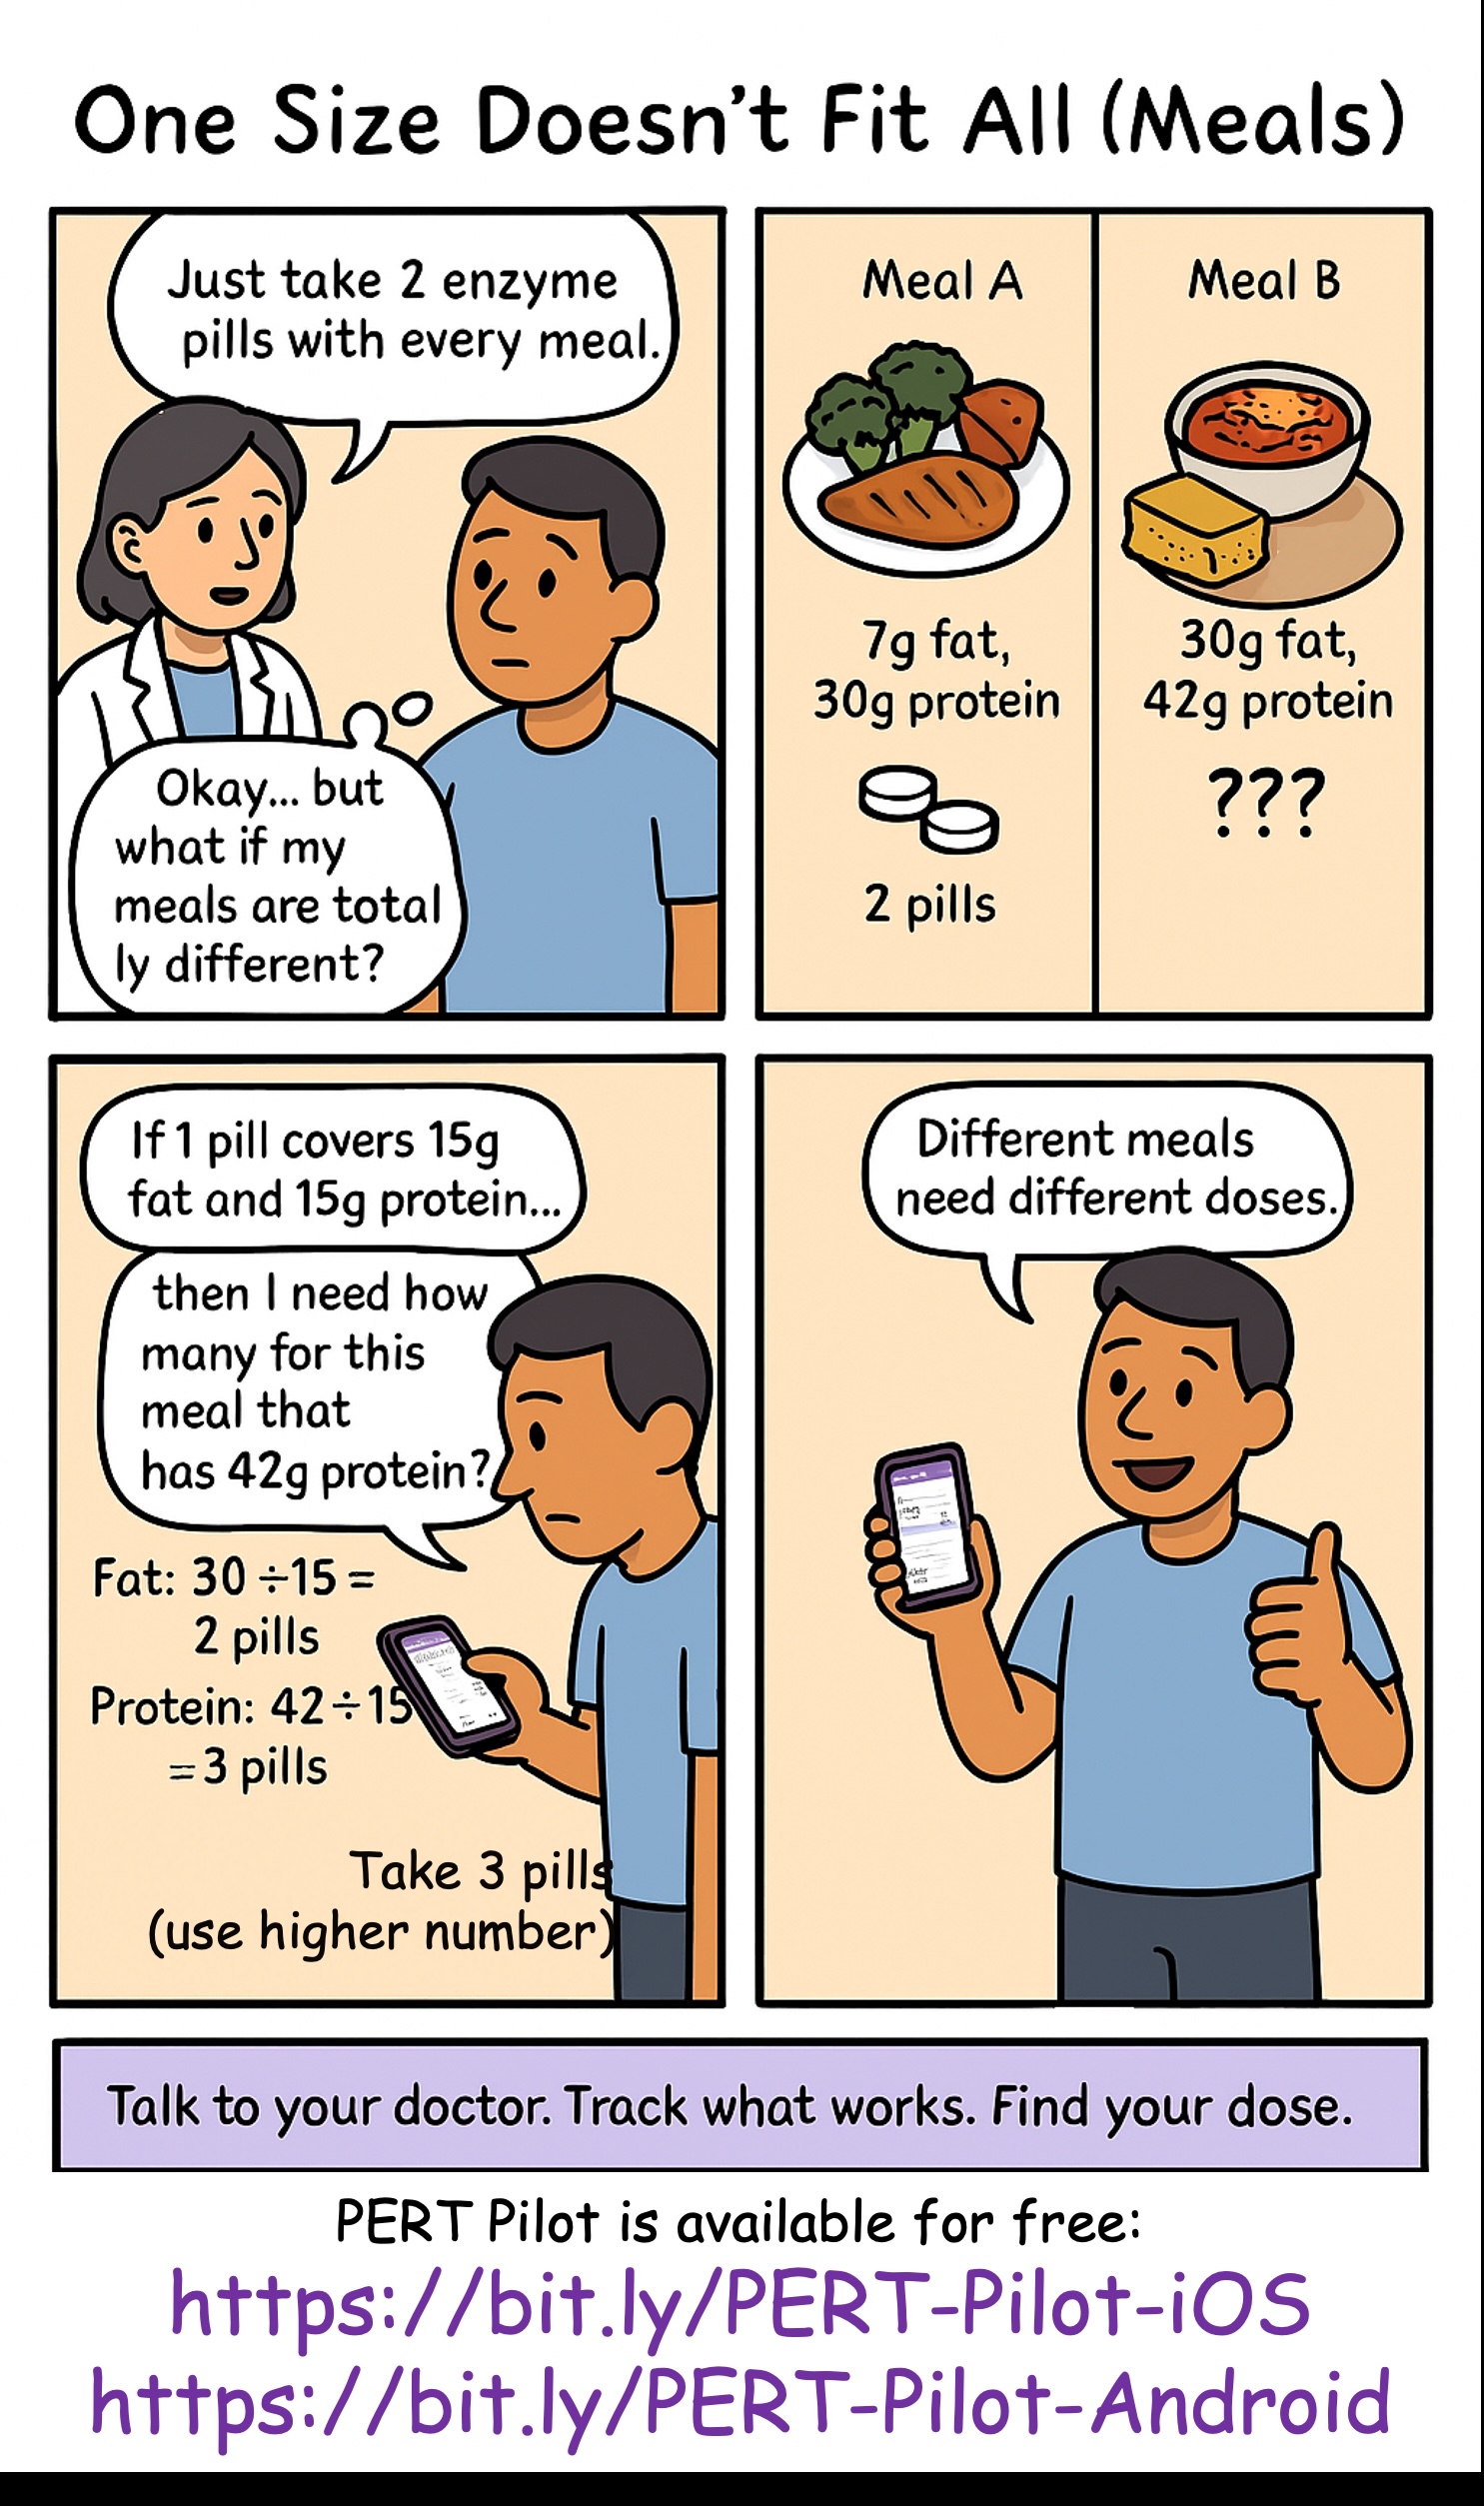
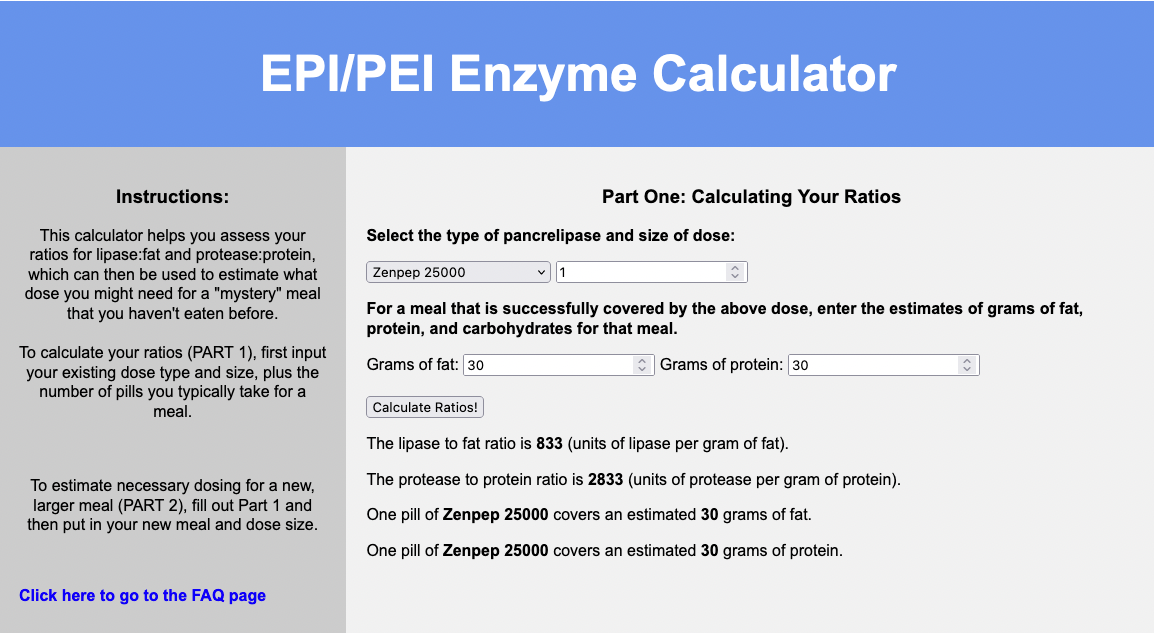
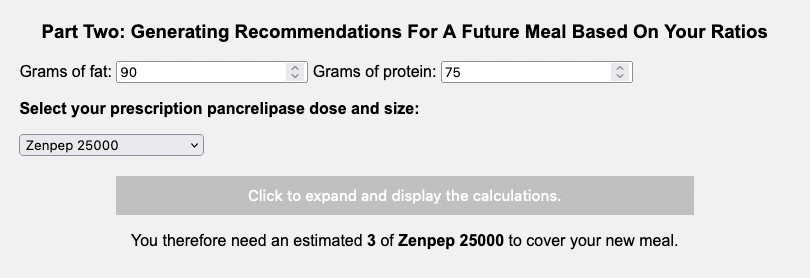
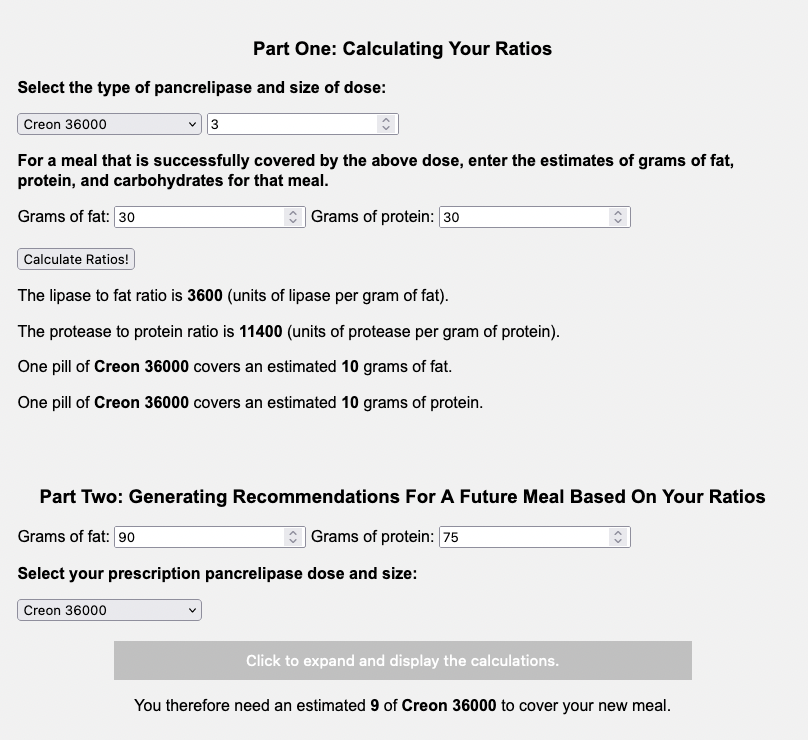
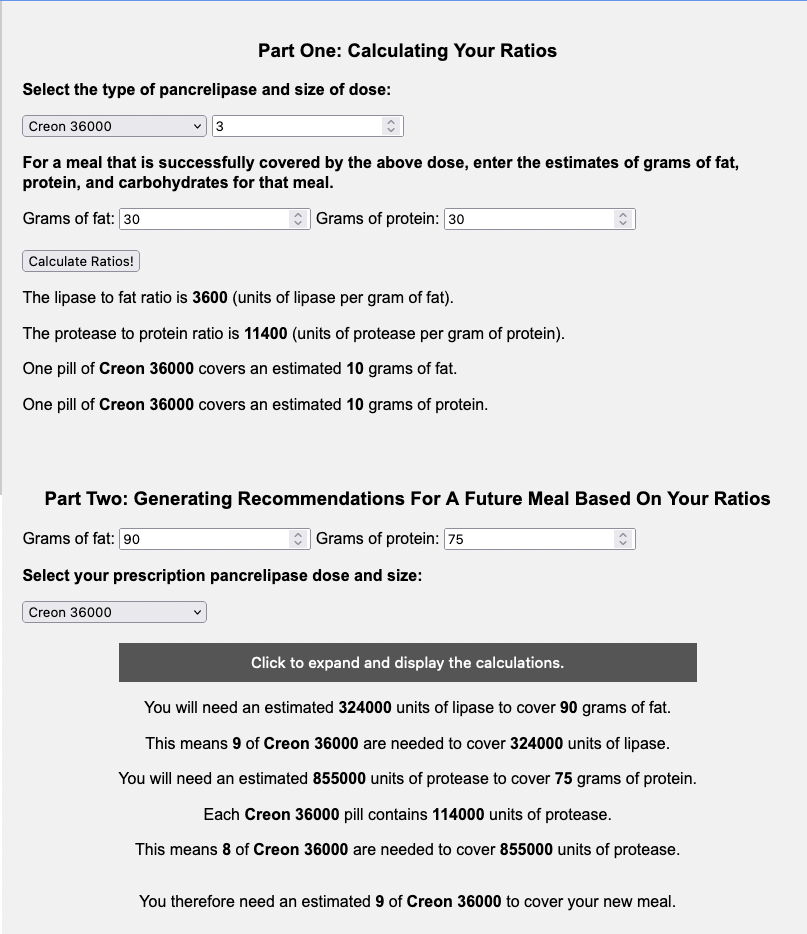
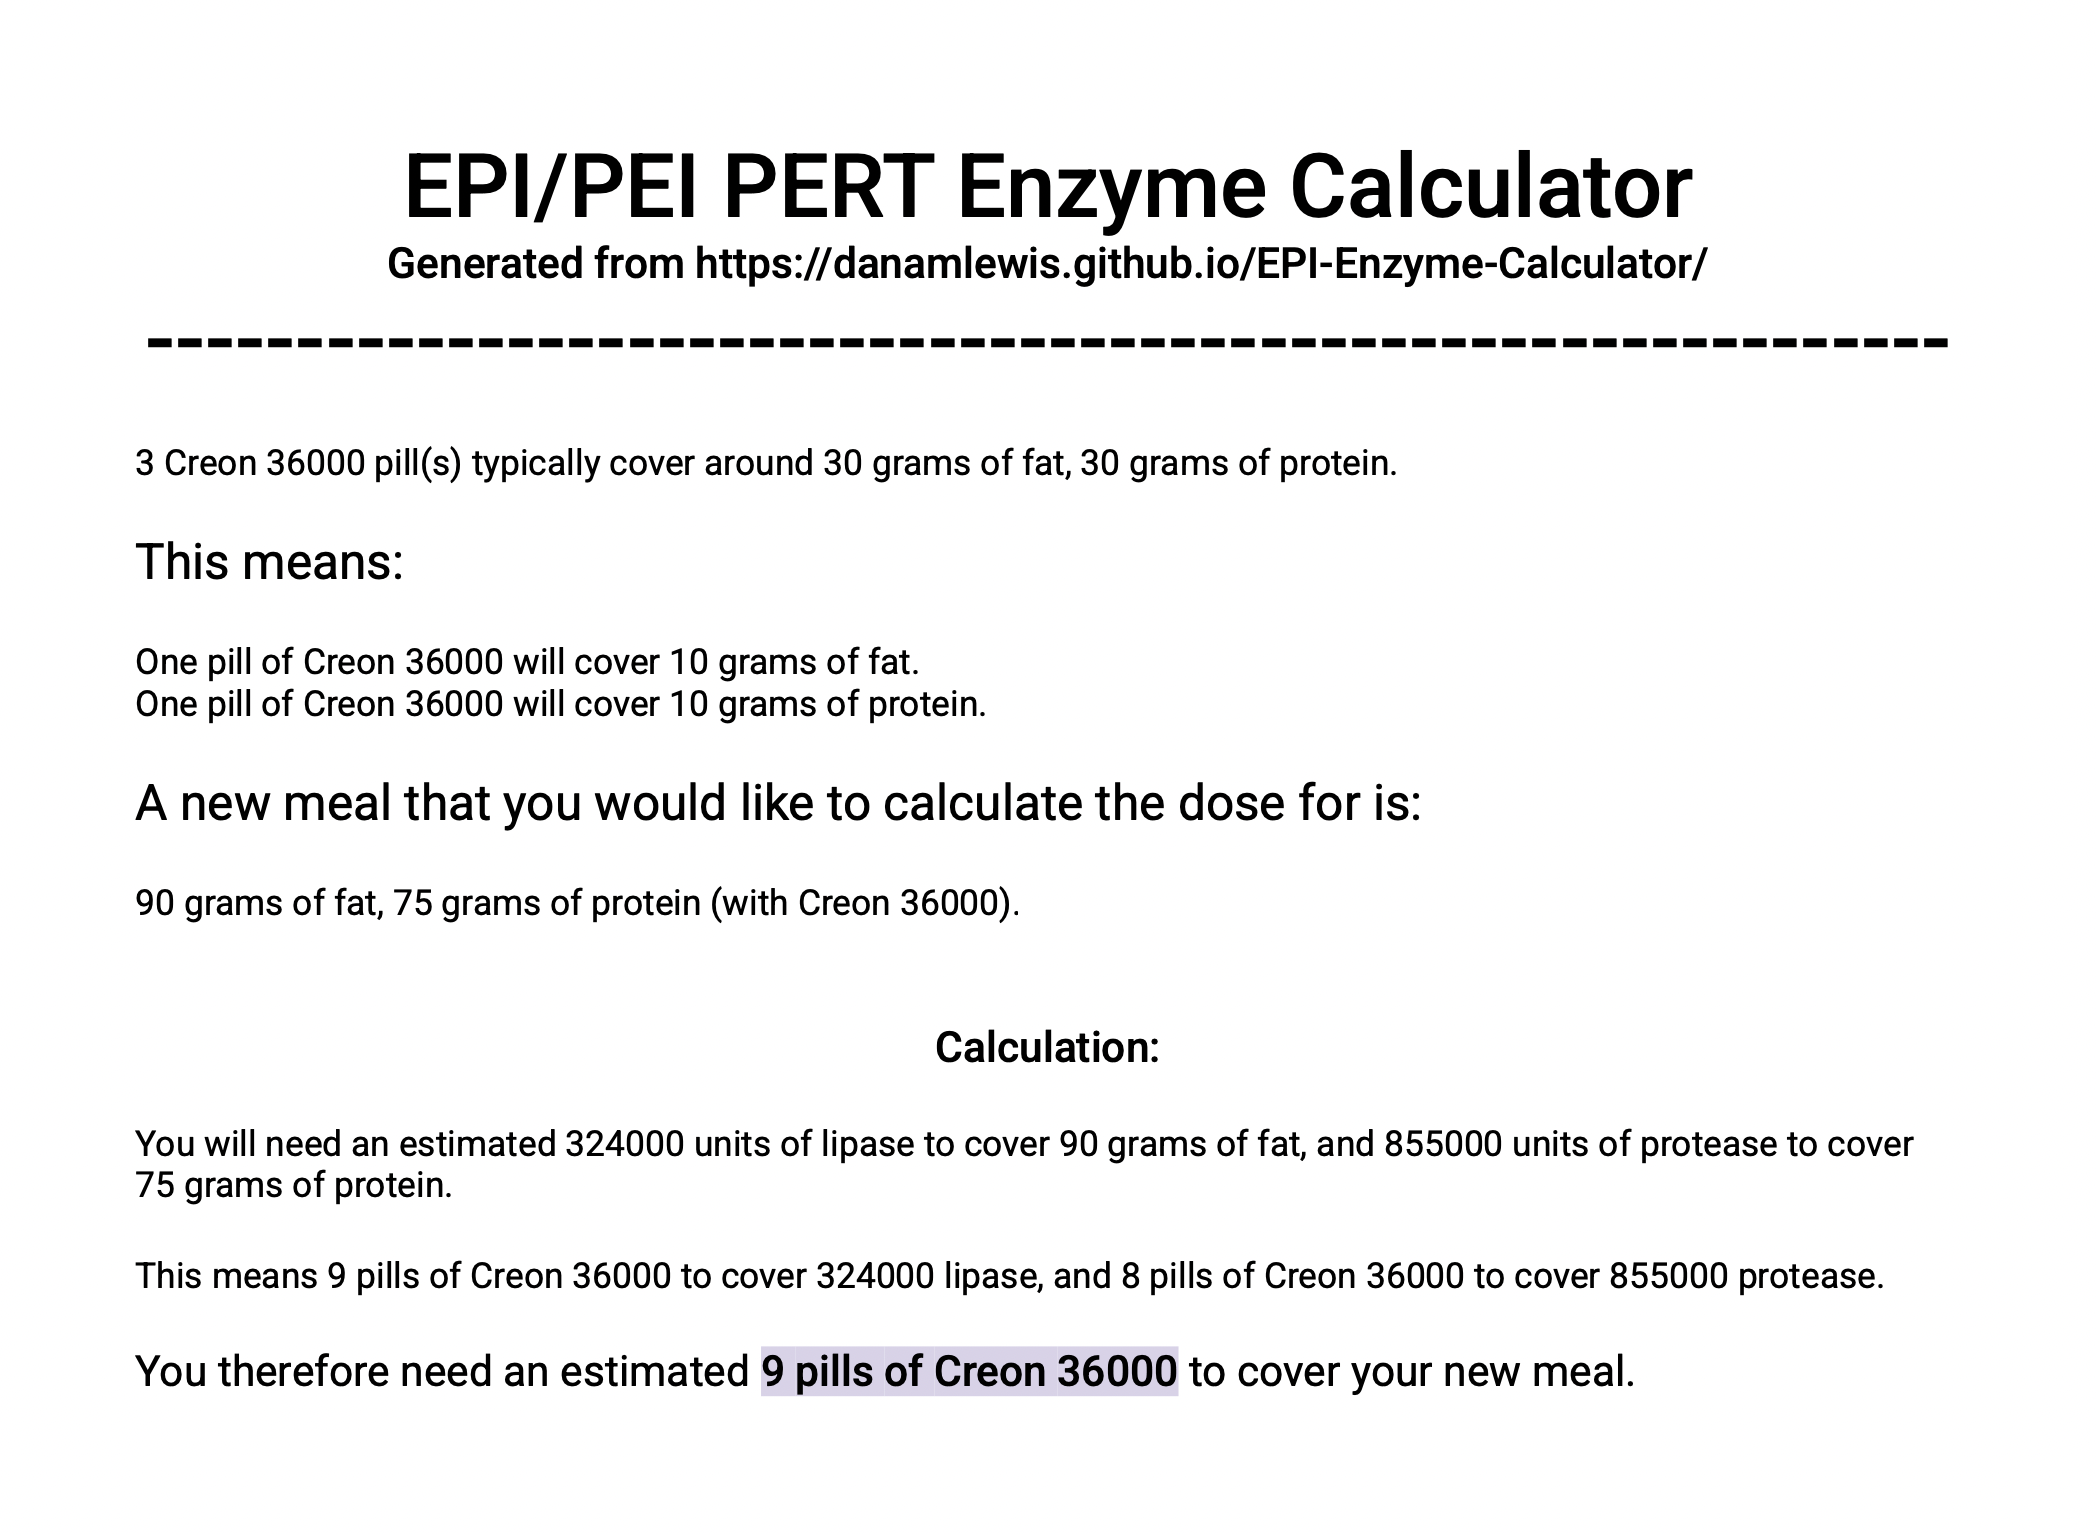
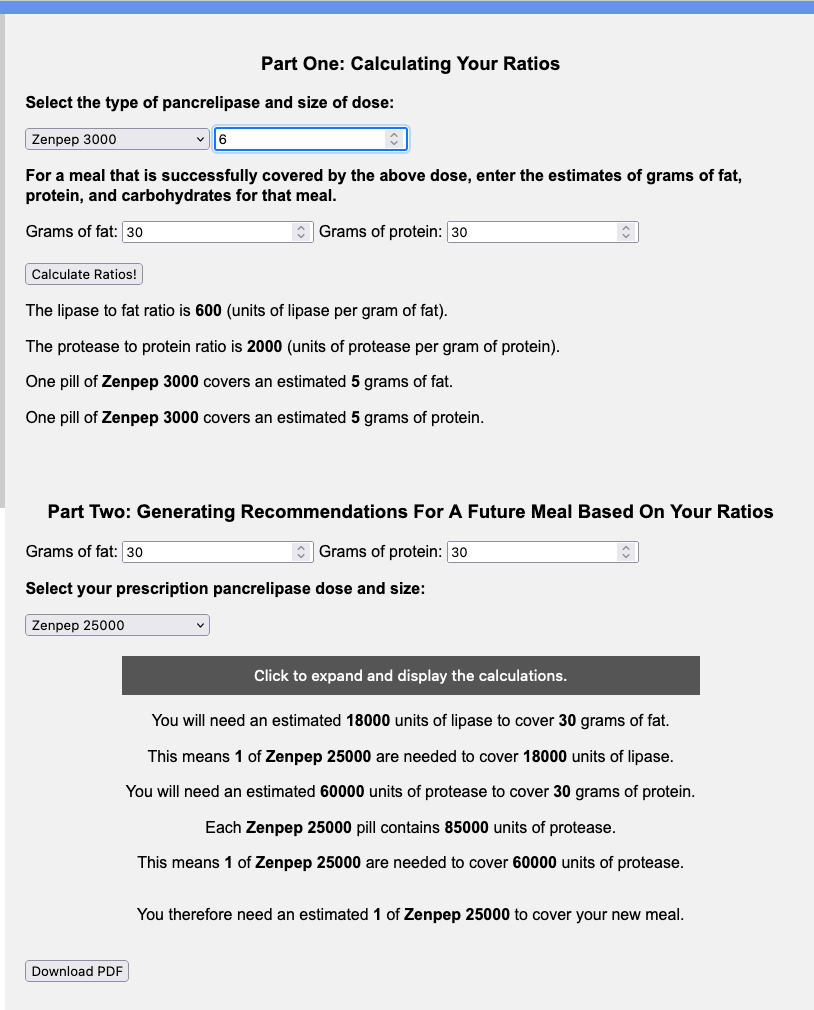
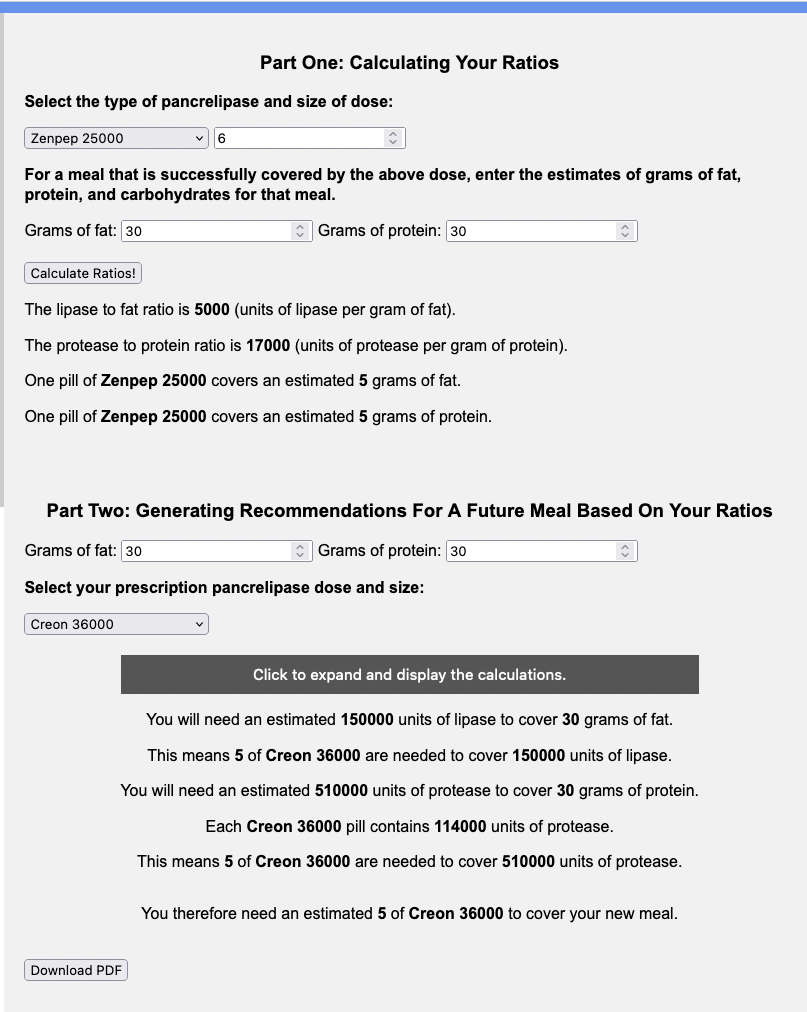
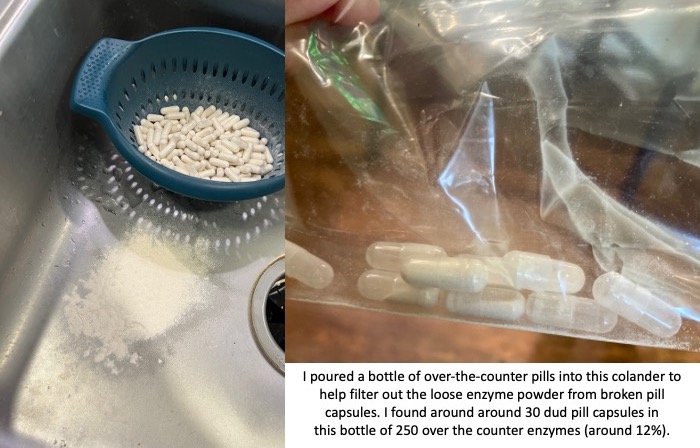
PS – speaking of iOS apps, based on building this one simple app I had the confidence to try building a really complex, novel app that has never existed in the world before! It’s for people with exocrine pancreatic insufficiency like me who want to log pancreatic enzyme replacement therapy (PERT) dosing and improve their outcomes – check out PERT Pilot and how I built it here.
4. Notes about what these tools cost
I found ChatGPT useful for writing projects in terms of getting started, even though the content wasn’t that great (on GPT-3.5, too). Then they came out with GPT-4 and made a ChatGPT Pro option for $20/month. I didn’t think it was worth it and resisted it. Then I finally decided to try it, because some of the more sophisticated use cases I wanted to use it for required a longer context window, and in addition to a better model it also gave you a longer context window. I paid the first $20 assuming I’d want to cancel it by the end of the month.
Nope.
The $20 has been worth it on every single project that I’ve used it for. I’ve easily saved 5x that on most projects in terms of reducing the energy needed to start a project, whether it was writing or developing code. It has saved 10x that in time cost recouped from debugging new code and tools.
GPT-4 does have caps, though, so even with the $20/month, you can only do 25 messages every 3 hours. I try to be cognizant of which projects I default to using GPT-3.5 on (unlimited) versus saving the more sophisticated projects for my GPT-4 quota.
For example, I saw a new tool someone had built called “AutoResearcher”, downloaded it, and tried to use it. I ran into a bug and pasted the error into GPT-3.5 and got help figuring out where the problem was. Then I decided I wanted to add a feature to output to a text file, and it helped me quickly edit the code to do that, and I PR’ed it back in and it was accepted (woohoo) and now everyone using that tool can use that feature. That was pretty simple and I was able to use GPT-3.5 for that. But sometimes, when I need a larger context window for a more sophisticated or content-heavy project, I start with GPT-4. When I run into the cap, it tells me when my next window opens up (3 hours after I started using it), and I usually have an hour or two until then. I can open a new chat on GPT-3.5 (without the same context) and try to do things there; switch to another project; or come back at the time it says to continue using GPT-4 on that context/setup.
Why the limit? Because it’s a more expensive model. So you have a tradeoff between paying more and having a limit on how much you can use it, because of the cost to the company.
—–
TLDR:
Most important note: LLMs don’t “think” or “know” things the way humans do. They output language they predict you want to see, based on its training and the inputs you give it. It’s like the autocomplete of a sentence in your email, but more words on a wider range of topics!
Also, the LLM can’t do math. But they can write code. Including code to do math.
(Some, but not all, LLMs have access to the internet to look up or incorporate facts; make sure you know which LLM you are using and whether it has this feature or not.)
Ways to get started:
- The most frequent way I use these AI tools is for getting started on a project, especially those related to writing.
- Ask it to help you expand on notes; write summaries of existing content; or write sections of content based on instructions you give it
- It can also help analyze data (caution alert!) if you understand the limitations of the LLM.
- The most effective way to work with data is to have it tell you how to run things in analytical software, whether that’s how to use R or a spreadsheet or other software for data analysis. Remember the LLM can’t do math, but it can write code so you can then do the math!
- You can get an LLM to teach you how to use new tools, solve problems, and lower the barrier to entry (and friction) on using new tools, languages, and software.
- Build a new habit of asking it “Can I do X” or “Is it possible to do Y” and when it says it’s possible, give it a try! Tell it to give you step-by-step instructions. Tell it where you get stuck. Give it your error messages or where you get lost and have it coach you through the process.
—
What’s been your favorite way to use an LLM? I’d love to know other ways I should be using them, so please drop a comment with your favorite projects/ways of using them!
Personally, the latest project that I built with an LLM has been PERT Pilot!


Recent Comments