Continuation Results On 48 Weeks of Use Of Open Source Automated Insulin Delivery From the CREATE Trial: Safety And Efficacy Data

In addition to the primary endpoint results from the CREATE trial, which you can read more about in detail here or as published in the New England Journal of Medicine, there was also a continuation phase study of the CREATE trial. This meant that all participants from the CREATE trial, including those who were randomized to the automated insulin delivery (AID) arm and those who were randomized to sensor-augmented insulin pump therapy (SAPT, which means just a pump and CGM, no algorithm), had the option to continue for another 24 weeks using the open source AID system.

These results were presented by Dr. Mercedes J. Burnside at #EASD2022, and I’ve summarized her presentation and the results below on behalf of the CREATE study team.

What is the “continuation phase”?

The CREATE trial was a multi-site, open-labeled, randomized, parallel-group, 24-week superiority trial evaluating the efficacy and safety of an open-source AID system using the OpenAPS algorithm in a modified version of AndroidAPS. Our study found that across children and adults, the percentage of time that the glucose level was in the target range of 3.9-10mmol/L [70-180mg/dL] was 14 percentage points higher among those who used the open-source AID system (95% confidence interval [CI], 9.2 to 18.8; P<0.001) compared to those who used sensor augmented pump therapy; a difference that corresponds to 3 hours 21 minutes more time spent in target range per day. The system did not contribute to any additional hypoglycemia. Glycemic improvements were evident within the first week and were maintained over the 24-week trial. This illustrates that all people with T1D, irrespective of their level of engagement with diabetes self-care and/or previous glycemic outcomes, stand to benefit from AID. This initial study concluded that open-source AID using the OpenAPS algorithm within a modified version of AndroidAPS, a widely used open-source AID solution, is efficacious and safe. These results were from the first 24-week phase when the two groups were randomized into SAPT and AID, accordingly.

The second 24-week phase is known as the “continuation phase” of the study.

There were 52 participants who were randomized into the SAPT group that chose to continue in the study and used AID for the 24 week continuation phase. We refer to those as the “SAPT-AID” group. There were 42 participants initially randomized into AID who continued to use AID for another 24 weeks (the AID-AID group).

One slight change to the continuation phase was that those in the SAPT-AID used a different insulin pump than the one used in the primary phase of the study (and 18/42 AID-AID participants also switched to this different pump during the continuation phase), but it was a similar Bluetooth-enabled pump that was interoperable with the AID system (app/algorithm) and CGM used in the primary outcome phase.

All 42 participants in AID-AID completed the continuation phase; 6 participants (out of 52) in the SAPT-AID group withdrew. One withdrew from infusion site issues; three with pump issues; and two who preferred SAPT.

What are the results from the continuation phase?

In the continuation phase, those in the SAPT-AID group saw a change in time in range (TIR) from 55±16% to 69±11% during the continuation phase when they used AID. In the SAPT-AID group, the percentage of participants who were able to achieve the target goals of TIR > 70% and time below range (TBR) <4% increased from 11% of participants during SAPT use to 49% during the 24 week AID use in the continuation phase. Like in the primary phase for AID-AID participants; the SAPT-AID participants saw the greatest treatment effect overnight with a TIR difference of 20.37% (95% CI, 17.68 to 23.07; p <0.001), and 9.21% during the day (95% CI, 7.44 to 10.98; p <0.001) during the continuation phase with open source AID.

Those in the AID-AID group, meaning those who continued for a second 24 week period using AID, saw similar TIR outcomes. Prior to AID use at the start of the study, TIR for that group was 61±14% and increased to 71±12% at the end of the primary outcome phase; after the next 6 months of the continuation phase, TIR was maintained at 70±12%. In this AID-AID group, the percentage of participants achieving target goals of TIR >70% and TBR <4% was 52% of participants in the first 6 months of AID use and 45% during the continuation phase. Similarly to the primary outcomes phase, in the continuation phase there was also no treatment effect by age interaction (p=0.39).

The TIR outcomes between both groups (SAPT-AID and AID-AID) were very similar after each group had used AID for 24 weeks (SAPT-AID group using AID for 24 weeks during the continuation phase and AID-AID using AID for 24 weeks during the initial RCT phase).. The adjusted difference in TIR between these groups was 1% (95% CI, -4 to 6; p=-0.67). There were no glycemic outcome differences between those using the two different study pumps (n=69, which was the SAPT-AID user group and 18 AID-AID participants who switched for continuation; and n=25, from the AID-AID group who elected to continue on the pump they used in the primary outcomes phase).

In the initial primary results (first 24 weeks of trial comparing the AID group to the SAPT group), there was a 14 percentage point difference between the groups. In the continuation phase, all used AID and the adjusted mean difference in TIR between AID and the initial SAPT results was a similar 12.10 percentage points (95% CI, p<0.001, SD 8.40).

Similar to the primary phase, there was no DKA or severe hypoglycemia. Long-term use (over 48 weeks, representing 69 person-years) did not detect any rare severe adverse events.

CREATE results from the full 48 weeks on open source AID with both SAPT (control) and AID (intervention) groups plotted on the graph.

Conclusion of the continuation study from the CREATE trial

In conclusion, the continuation study from the CREATE trial found that open-source AID using the OpenAPS algorithm within a modified version of AndroidAPS is efficacious and safe with various hardware (pumps), and demonstrates sustained glycaemic improvements without additional safety concerns.

Key points to takeaway:

  • Over 48 weeks total of the study (6 months or 24 weeks in the primary phase; 6 months/24 weeks in the continuation phase), there were 64 person-years of use of open source AID in the study, compared to 59 person-years of use of sensor-augmented pump therapy.
  • A variety of pump hardware options were used in the primary phase of the study among the SAPT group, due to hardware (pump) availability limitations. Different pumps were also used in the SAPT-AID group during the AID continuation phase, compared to the pumps available in the AID-AID group throughout both phases of trial. (Also, 18/42 of AID-AID participants chose to switch to the other pump type during the continuation phase).
  • The similar TIR results (14 percentage points difference in primary and 12 percentage points difference in continuation phase between AID and SAPT groups) shows durability of the open source AID and algorithm used, regardless of pump hardware.
  • The SAPT-AID group achieved similar TIR results at the end of their first 6 months of use of AID when compared to the AID-AID group at both their initial 6 months use and their total 12 months/48 weeks of use at the end of the continuation phase.
  • The safety data showed no DKA or severe hypoglycemia in either the primary phase or the continuation phases.
  • Glycemic improvements from this version of open source AID (the OpenAPS algorithm in a modified version of AndroidAPS) are not only immediate but also sustained, and do not increase safety concerns.
CREATE Trial Continuation Results were presented at #EASD2022 on 48 weeks of use of open source AID

Wondering about the “how” rather than the “why” of autoimmune conditions

I’ve been thinking a lot about stigma, per a previous post of mine, and how I generally react to, learn about, and figure out how to deal with new chronic diseases.

I’ve observed a pattern in my experiences. When I suspect an issue, I begin with research. I read medical literature to find out the basics of what is known. I read a high volume of material, over a range of years, to see what is known and the general “ground truth” about what has stayed consistent over the years and where things might have changed. This is true for looking into causal mechanisms as well as diagnosis and then more importantly to me, management/treatment.

I went down a new rabbit hole of research and most articles were publicly accessible

A lot of times with autoimmune related diseases…the causal mechanism is unknown. There are correlations, there are known risk factors, but there’s not always a clear answer of why things happen.

I realize that I am lucky that my first “thing” (type 1 diabetes) was known to be an autoimmune condition, and that probably has framed my response to celiac disease (6 years later); exocrine pancreatic insufficiency (19+ years after diabetes); and now Graves’ disease (19+ years after diabetes). Why do I think that is lucky? Because when I’m diagnosed with an autoimmune condition, it’s not a surprise that it IS an autoimmune condition. When you have a nicely overactive immune system, it interferes with how your body is managing things. In type 1 diabetes, it eventually makes it so the beta cells in your pancreas no longer produce insulin. In celiac, it makes it so the body has an immune reaction to gluten, and the villi in your small intestine freak out at the microscopic, crumb-level presence of gluten (and if you keep eating gluten, can cause all sorts of damage). In exocrine pancreatic insufficiency, there is possibly either atrophy as a result of the pancreas not producing insulin or other immune-related responses – or similar theories related to EPI and celiac in terms of immune responses. It’s not clear ‘why’ or which mechanism (celiac, T1D, or autoimmune in general) caused my EPI, and not knowing that doesn’t bother me, because it’s clearly linked to autoimmune shenanigans. Now with Graves’ disease, I also know that low TSH and increased thyroid antibodies are causing subclinical hyperthyroidism symptoms (such as occasional minor tremor, increased resting HR, among others) and Graves’ ophthalmology symptoms as a result of the thyroid antibodies. The low TSH and increased thyroid antibodies are a result of my immune system deciding to poke at my thyroid.

All this to say…I typically wonder less about “why” I have gotten these things, in part because the “why” doesn’t change “what” to do; I simply keep gathering new data points that I have an overactive immune system that gives me autoimmune stuff to deal with.

I have contrasted this with a lot of posts I observe in some of the online EPI groups I am a part of. Many people get diagnosed with EPI as a result of ongoing GI issues, which may or may not be related to other conditions (like IBS, which is often a catch-all for GI issues). But there’s a lot of posts wondering “why” they’ve gotten it, seemingly out of the blue.

When I do my initial research/learning on a new autoimmune thing, as I mentioned I do look for causal mechanisms to see what is known or not known. But that’s primarily, I think, to rule out if there’s anything else “new” going on in my body that this mechanism would inform me about. But 3/3 times (following type 1 diabetes, where I first learned about autoimmune conditions), it’s primarily confirmed that I have autoimmune things due to a kick-ass overactive immune system.

What I’ve realized that I often focus on, and most others do not, is what comes AFTER diagnosis. It’s the management (or treatment) of, and living with, these conditions that I want to know more about.

And sadly, especially in the latest two experiences (exocrine pancreatic insufficiency and Graves’ disease), there is not enough known about management and optimization of dealing with these conditions.

I’ve previously documented and written quite a bit (see a summary of all my posts here) about EPI, including my frustrations about “titrating” or getting the dose right for the enzymes I need to take every single time I eat something. This is part of the “management” gap I find in research and medical knowledge. It seems like clinicians and researchers spend a lot of time on the “why” and the diagnosis/starting point of telling someone they have a condition. But there is way less research about “how” to live and optimally manage these things.

My fellow patients (people with lived experiences) are probably saying “yeah, duh, and that’s the power of social media and patient advocacy groups to share knowledge”. I agree. I say that a lot, too. But one of the reasons these online social media groups are so powerful in sharing knowledge is because of the black hole or vacuum or utter absence of research in this space.

And it’s frustrating! Social media can be super powerful because you can learn about many n=1 experiences. If you’re like me, you analyze the patterns to see what might be reproducible and what is worth experimenting in my own n=1. But often, this knowledge stays in the real world. It is not routinely funded, studied, operationalized, and translated in systematic ways back to healthcare providers. When patients are diagnosed, they’re often told the “what” and occasionally the “why” (if it exists), but left to sometimes fall through the cracks in the “how” of optimally managing the new condition.

(I know, I know. I’m working on that, in diabetes and EPI, and I know dozens of friends, both people with lived experiences and researchers who ARE working on this, from diabetes to brain tumors to Parkinson’s and Alzheimer’s and beyond. And while we are moving the needles here, and making a difference, I’m wanting to highlight the bigger issue to those who haven’t previously been exposed to the issues that cause the gaps we are trying to fill!)

In my newest case of Graves’ disease, it presented with subclinical hyperthyroidism. As I wrote here, that for me means the lower TSH and higher thyroid antibodies but in range T3 and T4. In discussion with my physician, we decided to try an antithyroid drug, to try to lower the antibody levels, because the antibody levels are what cause the related eye symptoms (and they’re quite bothersome). The other primary symptom I have is higher resting HR, which is also really annoying, so I’m also hoping it helps with that, too. But the game plan was to start taking this medication every day; and get follow-up labs in about 2 months, because it takes ~6 weeks to see the change in thyroid levels.

Let me tell you, that’s a long time. I get that the medication works not on stored thyroid levels; thus, it impacts the new production only, and that’s why it takes 6 weeks to see it in the labs because that’s how long it takes to cycle through the stored thyroid stuff in your body.

My hope was that within 2-3 weeks I would see a change in my resting HR levels. I wasn’t sure what else to expect, and whether I’d see any other changes.

But I did.

It was in the course of DAYS, not weeks. It was really surprising! I immediately started to see a change in my resting HR (across two different wearable devices; a ring and a watch). Within a week, my phone’s health flagged it as a “trend”, too, and pinpointed the day (which it didn’t know) that I had started the new medication based on the change in the trending HR values.

Additionally, some of my eye symptoms went away. Prior to commencing the new medication, I would wake up and my eyes would hurt. Lubricating them (with eye drops throughout the day and gel before bed) helped some, but didn’t really fix the problem. I also had pretty significant red, patchy spots around the outside corner of one of my eyes, and eyelid swelling that would push on my eyeball. 4 days into the new medication, I had my first morning where I woke up without my eyes hurting. The next day it returned, and then I had two days without eye pain. Then I had 3-4 days with the painful eyes. Then….now I’m going on 2 weeks without the eye pain?! Meanwhile, I’m also tracking the eye swelling. It went down to match the eye pain going away. But it comes back periodically. Recently, I commented to Scott that I was starting to observe the pattern that the red/patchy skin at the corner and under my right eye would appear; then the next day the swelling of and above the eyelid would return. After 1-2 days of swelling, it would disappear. Because I’ve been tracking various symptoms, I looked at my data the other day and saw that it’s almost a 6-7 day pattern.

Interesting!

Again, the eye stuff is a result of antibody levels. So now I am curious about the production of antibodies and their timeline, and how that differs from TSH and thyroid hormones, and how they’re impacted with this drug.

None of that is information that is easy to get, so I’m deep in the medical literature trying again to find out what is known, whether this type of pattern is known; if it’s common; or if this level of data, like my within-days impact to resting HR change is new information.

Most of the research, sadly, seems to be on pre-diagnosis or what happens if you diagnose someone but not give them medication in hyperthyroid. For example, I found this systematic review on HRV and hyperthyroid and got excited, expecting to learn things that I could use, but found they explicitly removed the 3 studies that involved treating hyperthyroidism and are only studying what happens when you don’t treat it.

Sigh.

This is the type of gap that is so frustrating, as a patient or person who’s living with this. It’s the gap I see in EPI, where little is known on optimal titration and people don’t get prescribed enough enzymes and aren’t taught how to match their dosing to what they are eating, the way we are taught in diabetes to match our insulin dosing to what we’re eating.

And it matters! I’m working on writing up data from a community survey of people with EPI, many of whom shared that they don’t feel like they have their enzyme dosing well matched to what they are eating, in some cases 5+ years after their diagnosis. That’s appalling, to me. Many people with EPI and other conditions like this fall through the cracks with their doctors because there’s no plan or discussion on what managing optimally looks like; what to change if it’s not optimal for a person; and what to do or who to talk to if they need help managing.

Thankfully in diabetes, most people are supported and taught that it’s not “just” a shot of insulin, but there are more variables that need tracking and managing in order to optimize wellbeing and glucose levels when living with diabetes. But it took decades to get there in diabetes, I think.

What would it be like if more chronic diseases, like EPI and Graves’ disease (or any other hyper/hypothyroid-related diseases), also had this type of understanding across the majority of healthcare providers who treated and supported managing these conditions?

How much better would and could people feel? How much more energy would they have to live their lives, work, play with their families and friends? How much more would they thrive, instead of just surviving?

That’s what I wonder.

Wondering "how" rather than "why" of autimmune conditions, by @DanaMLewis from DIYPS.org

Graves’ Disease, Subclinical Hyperthyroidism, and Everything I Have Learned About It (So Far)

TLDR: I have newly diagnosed Graves’ Disease, I have associated eye stuff (called “Graves’ orbitopathy” or “Graves’ ophthalmopathy” or “thyroid eye disease”), subclinical hyperthyroidism, and a new learning curve. Below is what I’ve learned so far and what I’m still exploring.

As a person with type 1 diabetes (T1D) – which is an autoimmune disease – I am screened yearly for various high-risk related conditions. For example, celiac disease and thyroid issues, because those are fairly common in people with type 1 diabetes. I already have celiac disease (developed ~6 years after I developed T1D), but we have continued to screen every year in my annual blood work for thyroid markers, usually by screening T4 and TSH. Occasionally, T3 and/or TPO antibodies are also screened.

I remember vividly the chortle that my prior endocrinologist made after we diagnosed my celiac disease in college, probably in response to my comment about being frustrated of having “another” thing to deal with in addition to T1D. He chortled and said something like “once you have one (autoimmune thing), you’re likely to have two. Once you have two, you’ll be likely to have three.”

I didn’t like it at the time, and I don’t like it now. However, he’s not wrong. When your immune system has a little extra kick in it and you develop one autoimmune disease, the rates of having another autoimmune thing are increased. Thus, the typical yearly screening in T1D for celiac & thyroid.

I went 6 years between T1D and celiac, then almost 12-13 years to discover I now have exocrine pancreatic insufficiency (EPI). That’s not necessarily an autoimmune thing but may be a side effect of long-term T1D. Regardless, I was still thankful for the long period of time between T1D and celiac, then T1D+celiac and EPI. I was assuming that something else was coming eventually, but that I’d likely have a few years before the shoe dropped.

Nope.

I wasn’t terribly surprised when I scheduled my annual endocrinology appointment and did my annual blood work to find that one of my thyroid values was off. Specifically, my TSH (thyroid stimulating hormone) was low / below normal range. However, my T4 was smack dab in the middle of normal range. I got my blood work back Tuesday and waited for my virtual appointment on Friday to discuss in detail with my endocrinologist.

Since I’m me, I was curious about the interplay between normal thyroid levels (T4, and I suspected my T3 was likely still in range) but a low TSH value. What did that mean? General consensus seems to define this as “subclinical hyperthyroidism”. It’s not always treated, unless you are older (>65), have osteoporosis or heart disease, or TSH levels are <0.1.

I’m <65, don’t (as far as I know) have osteoporosis or heart disease, and my TSH levels are between 0.1 and 0.4, which is the low end of the normal range. So general treatment guidelines (see this example from the AAFP) suggest treatment isn’t necessarily warranted.

However…there’s more information that factors into the decision making. First, I had my last annual eye exam in October. All was well. Yet in November, I developed really gritty, dry eyes and went in for an appointment. I was diagnosed with dry eyes (gee, thanks!) and recommended to use gel drops at night before bed and regular eye drops during the day as needed. I did end up needing eye drops several times every day.

Then at the end of December or early January, we realized I had exocrine pancreatic insufficiency (EPI). I had been wondering if my dry eyes was related to the lack of digestion and absorption of nutrients, which also influences how my body uses the water content from food. It did seem to get a little better in the following months, because while I still needed the eye gel at night, I eventually moved to several days a week where I didn’t seem to need the eye drops during the day – yay!

However, in February and early March, I started to physically notice a shift in my resting overnight heart rate (HR). My Pebble 2+ HR watch and my Oura ring, both of which measure HR and heart rate variability (HRV), confirmed that both metrics were getting worse. I had a slowly increasing overnight HR and associated decrease in HRV. I am used to fluctuations, because the intensity of my ultrarunning can also influence HR the next day as a signal for whether my body has recovered yet or not. But instead of a day or two of increased numbers, I had an increasing trend line over several weeks, and it started to physically become bothersome. I actually raised the idea of getting my thyroid blood work done early this year, and was about to request the lab work, when after ~6 weeks or so the trend seemed to reverse and things (HR-wise) went back to “normal” for me.

Then I broke my toe in July and the same thing happened, but I chalked it up to sleep disruption from the pain and recovering from the fracture. My HR was continuing to rise even as the pain subsided and my toe was clearly healing. And looking back at my HR data, I can see it actually started to rise at the beginning of July, about two weeks before I broke my toe, so it’s not solely influenced by my broken toe.

As a result of these HR increases (that are noticeable and bothersome because I’m also not sleeping well at night and I physically feel the higher HR during the day), and the ongoing dry/gritty eyes, I suspected that the cause of my “subclinical hyperthyroidism” was Graves’ disease.

I’ve seen estimates that ~30% of people with Graves’ disease have what is called “Graves’ orbitopathy” (and other estimates suggest 20-50%, like this one), so the combination of my ongoing eye symptoms and the low TSH suggested that further lab work assessing various thyroid antibody levels would be able to confirm whether Graves’ disease was the likely source of the subclinical hyperthyroidism.

Therefore, I wasn’t surprised during my virtual visit that my endocrinologist ordered additional labs (repeat of T4 and TSH; adding in T3, TPO antibodies, and TSI (Thyroid Stimulating Immunoglobulin), Thyrotropin Receptor Ab, and Thyroglobulin Ab). Treatment plan, if any, would be based on these results.

I managed to get in that (Friday) afternoon for the repeat lab work, and my results started trickling in by the time I woke up Saturday morning. First, T3, T4, TPO, and TSH came back. T4 was still normal; as I expected, T3 was also normal. TPO antibodies were high, as expected, TSH was still low, as I expected. Saturday night, Thyroglobulin Ab came back high, as expected. Monday, TSI came back high, as expected. Tuesday, my last test result of Thyrotropin Receptor Ab came back, also high as expected.

The summary was: all antibodies high; TSH low; T3/T4 normal.

My endocrinologist messages me Tuesday afternoon confirming mild Graves’ disease with subclinical hyperthyroidism.

The challenge is that I have normal T3/T4 levels. If those were high, we’d treat based on those levels and use those levels coming back into normal range and any change in antibody levels to assess that things were going well.

But the guidelines for subclinical hyperthyroidism don’t really indicate treatment (except on an individual level based on age, other conditions, or undetectable TSH <0.1, as I mentioned).

However, from what I’ve read, the “eye stuff” seems to be driven not by thyroid levels but by the presence of the increased thyroid antibodies. Treatment would possibly bring down the thyroid antibody levels, which might help with the eye disease progression. But not a guarantee. So my doctor left it up to me to decide whether to treat it or not.

Given the ongoing presence of active eye disease (I haven’t been able to wear my contacts for two weeks right now due to swelling/pain in the eyes, plus itching and redness), and the bothersome heart rate feeling, I have decided to try antithyroid medication. I’ll be on a relatively low dose of an “antithyroid” drug, again with the goal of trying to reduce my antibody levels.

This is why I ended up deciding to write this blog post after all: I have not been able to find any clear treatment guidelines for subclinical hyperthyroidism and Graves’ disease with active eye symptoms (from Graves’ orbitopathy). The literature does suggest that treatment to reduce thyroid antibodies even with in-range T3 and T4, targeting a return to normal TSH levels, may be helpful in reducing Graves’ orbitopathy symptoms. This isn’t well known/established enough to have been documented in treatment guidelines, but does seem to occur in many people who are treated.

So hopefully, anyone else with low TSH and high antibodies suggesting Graves’ disease but normal T3 and T4 levels that suggests subclinical hyperthyroidism and also has other symptoms (whether that’s heart rate or other common hyperthyroid symptoms like increased sweating, shaking, heart palpitations, heat intolerance, sleep disturbances) that are bothersome, now have an example of what I chose, given my situation as described above.

I also thought sharing my question list at different stages for my endocrinologist would be helpful. After I saw that I had low TSH and in range T4, and suspected this meant I had subclinical hyperthyroidism from Graves’ disease, given my eye symptoms, the questions I asked my endocrinologist were:

  • What additional lab work did we need to confirm subclinical hyperthyroidism and Graves’ disease as the cause? What additional information or lab work would give us a treatment plan?As expected, he repeated TSH and T4, added T3 and TPO and the other antibody tests described above: TGAb, TRab, TSI. This would confirm subclinical hyperthyroidism and Graves’ as the likely source.


  • Do I need treatment, since the guidelines generally don’t suggest treatment with normal T3/T4 and TSH between .1 and .4?Initially he suggested treatment would be an option, and after the repeat and expanded lab work, left it up to my decision. Given my symptoms that are actively bothering me, I’m choosing to try low-dose antithyroid medication.
  • For hyperthyroidism treatment, beta blockers seem to be part of treatment guidelines for managing symptoms in the short-term, since it takes ~6 weeks for antithyroid medication to show up in lab results. Were beta blockers warranted in my case?My endo typically doesn’t like to prescribe beta blockers unless there are extreme symptoms. He gave an example of someone with a T4 (I think) around 10 and extreme visible shaking. He left it up to me, but his opinion was the side effects, such as lethargy, would outweigh the benefits for mild symptoms, so it is better to treat the root cause. I agreed and did not ask for a beta blocker prescription.
  • I also asked if a DEXA scan was warranted to check my bone density.I haven’t had one in over a decade, and celiac and EPI and now Graves’ puts me at possible higher risk of bone density issues. And, since the presence of osteoporosis changes the treatment recommendation for subclinical hyperthyroidism, we agreed it was worth doing. I have it scheduled in a few weeks. My last one over a decade ago was normal.
  • Finally, I asked about my eye care, now that I have a known eye thing (Graves’ orbitopathy). Do I need to get referred to an ophthalmologist, or can I continue to see my existing optometrist for annual eye care (including diabetes eye exam) and contact fittings?My endocrinologist suggested that my optometrist can continue to manage my eye care, unless something changes significantly. Ophthalmologists, based on his response and my research, seem to handle severe eye disease treatments that aren’t likely warranted for me. I’ll probably need supportive eye care (e.g. gel drops, regular eye drops) for now. However, I’m planning to send a note to my eye doctor and flag that I want to talk about Graves’ eye things and a plan for monitoring severity and progression over time, and check whether she’s comfortable supporting me or if she prefers to refer me to someone else. 


After my repeat labs came back, my endocrinologist messaged me to confirm things and ask if I wanted him to send in the prescription as previously discussed. This exchanged answered the additional questions I had at this time:

  • What is the treatment timeline? How soon might I see results?He suggested repeat labs at the 2 month mark. Ideally, we’d see reduced antibody levels and my hope is that my eye symptoms will have also improved and/or I won’t have any additional weeks without being able to wear contacts.

    Given I have a clear impact to my heart rate, I’m hypothesizing that I might see changes to the trend in my heart rate data sooner than 6 weeks – 2 months, so that’ll be interesting to track!


  • Side effects?Common side effects with antithyroid drugs are rash/allergic type response, headache, or agranulocytosis. He told me to discontinue and contact the office if I had any of those symptoms.

    He didn’t go into detail, but I’ve read about agranulocytosis and it seems like if you have a fever and strong sore throat, you need to discontinue and probably will have blood work ordered to make sure your white blood cell counts are ok. Don’t google too much on this one as it sounds scary, but it’s also rare – less than 2% of people seem to have this.


  • The only question he didn’t answer was whether it makes a difference in efficacy to take the antithyroid drugs at night or in the morning.Probably, the answer is it doesn’t matter, and whatever time you can take it consistently is best. However, I want to optimize and get the best results from taking this, so I’m bummed that there doesn’t seem to be any evidence (let me know if you’ve found anything in medical literature) suggesting how to optimize timing of it. 

So that’s where I am today.

I now have type 1 diabetes, celiac disease, exocrine pancreatic insufficiency, and Graves’ disease (contributing to subclinical hyperthyroidism). It’s possible that we can fix the subclinical hyperthyroidism, and that I won’t need to be on antithyroid medication long-term. However, the data for those of us with Graves’ orbitopathy isn’t super optimistic compared to those without Graves’ eye disease; so I am managing my expectations that managing my thyroid antibody and hormone levels will be an ongoing thing that I get to do along with managing insulin and blood sugars and managing pancreatic enzymes. We’ll see!

New Research on Glycemic Variability Assessment In Exocrine Pancreatic Insufficiency (EPI) and Type 1 Diabetes

I am very excited to share that a new article I wrote was just published, looking at glycemic variability in data from before and after pancreatic enzyme replacement therapy (PERT) was started in someone with type 1 diabetes with newly discovered exocrine pancreatic insufficiency (EPI or PEI).

If you’re not aware of exocrine pancreatic insufficiency, it occurs when the pancreas no longer produces the amount of enzymes necessary to fully digest food. If that occurs, people need supplementary enzymes, known as pancreatic enzyme replacement therapy (PERT), to help them digest their food. (You can read more about EPI here, and I have also written other posts about EPI that you can find at DIYPS.org/EPI.)

But, like MANY medications, when someone with type 1 diabetes or other types of insulin-requiring diabetes starts taking them, there is little to no guidance about whether these medications will change their insulin sensitivity or otherwise impact their blood glucose levels. No guidance, because there are no studies! In part, this may be because of the limited tools available at the time these medications were tested and approved for their current usage. Also this is likely in part because people with diabetes make up a small fraction of the study participants that most of these medications are tested on. If there are any specific studies on the medications in people with diabetes, these studies likely were done before CGM, so little data is available that is actionable.

As a result, the opportunity came up to review someone’s data who happened to have blood glucose data from a continuous glucose monitor (CGM) as well as a log of what was eaten (carbohydrate entries) prior to commencing pancreatic enzyme replacement therapy. The tracking continued after commencing PERT and was expanded to also include fat and protein entries. As a result, there was a useful dataset to compare the impacts of pancreatic enzyme replacement therapy on blood glucose outcomes and specifically, looking at glycemic variability changes!

(You can read an author copy here of the full paper and also see the supplementary material here, and the DOI for the paper is https://doi.org/10.1177/19322968221108414 . Otherwise, below is my summary of what we did and the results!)

In addition to the above background, it’s worth noting that Type 1 diabetes is known to be associated with EPI. In upwards of 40% of people with Type 1 diabetes, elastase levels are lowered, which in other cases is correlated with EPI. However, in T1D, there is some confusion as to whether this is always the case or not. Based on recent discussions with endocrinologists who treat patients with T1D and EPI (and have patients with lowered elastase that they think don’t have EPI), I don’t think there have been enough studies looking at the right things to assess whether people with T1D and lowered elastase levels would benefit from PERT and thus have EPI. More on this in the future!

Because we now have technology such as AID (automated insulin delivery) and CGM, it’s possible to evaluate things beyond simple metrics of “average blood sugar” or “A1c” in response to taking new medications. In this paper, we looked at some basic metrics like average blood sugar and percent time in range (TIR), but we also did quite a few calculations of variables that tell us more about the level of variability in glucose levels, especially in the time frames after meals.

Methods

This person had tracked carb entries through an open source AID system, and so carb entries and BG data were available from before they started PERT. We call this “pre-PERT”, and selected 4 weeks worth of data to exclude major holidays (as diet is known to vary quite a bit during those times). We then compared this to “post-PERT”, the first 4 weeks after the person started PERT. The post-PERT data not only included BGs and carb entries, but also had fat and protein entries as well as PERT data. Each time frame included 13,975 BG data points.

We used a series of open source tools to get the data (Nightscout -> Nightscout Data Transfer Tool -> Open Humans) and process the data (my favorite Unzip-Zip-CSVify-OpenHumans-data.sh script).

All of our code for this paper is open source, too! Check it out here. We analyzed time in range, TIR 70-180, time out of range, TOR >180, time below range, TBR <70 and <54, the number of hyperglycemic excursions >180. We also calculated total daily dose of insulin, average carbohydrate intake, and average carbohydrate entries per day. Then we calculated a series of variability related metrics such as Low Blood Glucose Index (LBGI), High Blood Glucose Index (HBGI), Coefficient of Variation (CV), Standard Deviation (SD), and J_index (which stresses both the importance of the mean level and variability of glycemic levels).

Results

This person already had an above-goal TIR. Standard of care goal for TIR is >70%; before PERT they had 92.12% TIR and after PERT it was 93.70%. Remember, this person is using an open source AID! TBR <54 did not change significantly, TBR <70 decreased slightly, and TOR >180 also decreased slightly.

More noticeably, the total number of unique excursions above 180 dropped from 40 (in the 4 weeks without PERT) to 26 (in 4 weeks when using PERT).

The paper itself has a few more details about average fat, protein, and carb intake and any changes. Total daily insulin was relatively similar, carb intake decreased slightly post-PERT but was trending back upward by the end of the 4 weeks. This is likely an artifact of being careful to adjust to PERT and dose effectively for PERT. The number of meals decreased but the average carb entry per meal increased, too.

What I find really interesting is the assessment we did on variability, overall and looking at specific meal times. The breakfast meal was identical during both time periods, and this is where you can really SEE visible changes pre- and post-PERT. Figure 2 (displayed below), shows the difference in the rate of change frequency. There’s less of the higher rate of changes (red) post-PERT than there is from pre-PERT (blue).

Figure 2 from GV analysis on EPI, showing lower frequency of high rate of change post-PERT

Similarly, figure 3 from the paper shows all glucose data pre- and post-PERT, and you can see the fewer excursions >180 (blue dotted line) in the post-PERT glucose data.

Figure 3 from GV analysis paper on EPI showing lower number of excursions above 180 mg/dL

Table 1 in the paper has all the raw data, and Figure 1 plots the most relevant graphs side by side so you can see pre- and post-PERT before and after after all meals on the left, versus pre and post-PERT before and after breakfast only. Look at TOR >180 and the reduction in post-breakfast levels after PERT! Similarly, HBGI post-PERT after-breakfast is noticeably different than HBGI pre-PERT after-breakfast.

Here’s a look at the HBGI for breakfast only, I’ve highlighted in purple the comparison after breakfast for pre- and post-PERT:

High Blood Glucose Index (HBGI) pre- and post-PERT for breakfast only, showing reduction in post-PERT after breakfast

Discussion

This is a paper looking at n=1 data, but it’s not really about the n=1 here. (See the awesome limitation section for more detail, where I point out it’s n=1, it’s not a clinical study, the person has ‘moderate’ EPI, there wasn’t fat/protein data from pre-PERT, it may not be representative of all people with diabetes with EPI or EPI in general.)

What this paper is about is illustrating the types of analyses that are possible, if only we would capture and analyze the data. There are gaping holes in the scientific knowledge base: unanswered and even unasked questions about what happens to blood glucose with various medications, and this data can help answer them! This data shows minimal changes to TIR but visible and significant changes to post-meal glycemic variability (especially after breakfast!). Someone who had a lower TIR or wasn’t using an open source AID may have more obvious changes in TIR following PERT commencement.

This paper shows several ways we can more easily detect efficacy of new-onset medications, whether it is enzymes for PERT or other commonly used medications for people with diabetes.

For example, we could do a similar study with metformin, looking at early changes in glycemic variability in people newly prescribed metformin. Wouldn’t it be great, as a person with diabetes, to be able to more quickly resolve the uncertainty of “is this even working?!” and not have to suffer through potential side effects for 3-6 months or longer waiting for an A1c lab test to verify whether the metformin is having the intended effects?

Specifically with regards to EPI, it can be hard for some people to tell if PERT “is working”, because they’re asymptomatic, they are relying on lab data for changes in fat soluble vitamin levels (which may take time to change following PERT commencement), etc. It can also be hard to get the dosing “right”, and there is little guidance around titrating in general, and no studies have looked at titration based on macronutrient intake, which is something else that I’m working on. So, having a method such as these types of GV analysis even for a person without diabetes who has newly discovered EPI might be beneficial: GV changes could be an earlier indicator of PERT efficacy and serve as encouragement for individuals with EPI to continue PERT titration and arrive at optimal dosing.

Conclusion

As I wrote in the paper:

It is possible to use glycemic variability to assess changes in glycemic outcomes in response to new-onset medications, such as pancreatic enzyme replacement therapy (PERT) in people with exocrine pancreatic insufficiency (EPI) and insulin-requiring diabetes. More studies should use AID and CGM data to assess changes in glycemic outcomes and variability to add to the knowledge base of how medications affect glucose levels for people with diabetes. Specifically, this n=1 data analysis demonstrates that glycemic variability can be useful for assessing post-PERT response in someone with suspected or newly diagnosed EPI and provide additional data points regarding the efficacy of PERT titration over time.

I’m super excited to continue this work and use all available datasets to help answer more questions about PERT titration and efficacy, changes to glycemic variability, and anything else we can learn. For this study, I collaborated with the phenomenal Arsalan Shahid, who serves as technology solutions lead at CeADAR (Ireland’s Centre for Applied AI at University College Dublin), who helped make this study and paper possible. We’re looking for additional collaborators, though, so feel free to reach out if you are interested in working on similar efforts or any other research studies related to EPI!

Findings from the world’s first RCT on open source AID (the CREATE trial) presented at #ADA2022

September 7, 2022 UPDATEI’m thrilled to share that the paper with the primary outcomes from the CREATE trial is now published. You can find it on the journal site here, or view an author copy here. You can also see a Twitter thread here, if you are interested in sharing the study with your networks.

Example citation:

Burnside, M; Lewis, D; Crocket, H; et al. Open-Source Automated Insulin Delivery in Type 1 Diabetes. N Engl J Med 2022;387:869-81. DOI:10.1056/NEJMoa2203913


(You can also see a previous Twitter thread here summarizing the study results, if you are interested in sharing the study with your networks.)

TLDR: The CREATE Trial was a multi-site, open-labeled, randomized, parallel-group, 24-week superiority trial evaluating the efficacy and safety of an open-source AID system using the OpenAPS algorithm in a modified version of AndroidAPS. Our study found that across children and adults, the percentage of time that the glucose level was in the target range of 3.9-10mmol/L [70-180mg/dL] was 14 percentage points higher among those who used the open-source AID system (95% confidence interval [CI], 9.2 to 18.8; P<0.001) compared to those who used sensor augmented pump therapy; a difference that corresponds to 3 hours 21 minutes more time spent in target range per day. The system did not contribute to any additional hypoglycemia. Glycemic improvements were evident within the first week and were maintained over the 24-week trial. This illustrates that all people with T1D, irrespective of their level of engagement with diabetes self-care and/or previous glycemic outcomes, stand to benefit from AID. This study concluded that open-source AID using the OpenAPS algorithm within a modified version of AndroidAPS, a widely used open-source AID solution, is efficacious and safe.

The backstory on this study

We developed the first open source AID in late 2014 and shared it with the world as OpenAPS in February 2015. It went from n=1 to (n=1)*2 and up from there. Over time, there were requests for data to help answer the question “how do you know it works (for anybody else)?”. This led to the first survey in the OpenAPS community (published here), followed by additional retrospective studies such as this one analyzing data donated by the community,  prospective studies, and even an in silico study of the algorithm. Thousands of users chose open source AID, first because there was no commercial AID, and later because open source AID such as the OpenAPS algorithm was more advanced or had interoperability features or other benefits such as quality of life improvements that they could not find in commercial AID (or because they were still restricted from being able to access or afford commercial AID options). The pile of evidence kept growing, and each study has shown safety and efficacy matching or surpassing commercial AID systems (such as in this study), yet still, there was always the “but there’s no RCT showing safety!” response.

After Martin de Bock saw me present about OpenAPS and open source AID at ADA Scientific Sessions in 2018, we literally spent an evening at the dinner table drawing the OpenAPS algorithm on a napkin at the table to illustrate how OpenAPS works in fine grained detail (as much as one can do on napkin drawings!) and dreamed up the idea of an RCT in New Zealand to study the open source AID system so many were using. We sought and were granted funding by New Zealand’s Health Research Council, published our protocol, and commenced the study.

This is my high level summary of the study and some significant aspects of it.

Study Design:

This study was a 24-week, multi-centre randomized controlled trial in children (7–15 years) and adults (16–70 years) with type 1 diabetes comparing open-source AID (using the OpenAPS algorithm within a version of AndroidAPS implemented in a smartphone with the DANA-i™ insulin pump and Dexcom G6® CGM), to sensor augmented pump therapy. The primary outcome was change in the percent of time in target sensor glucose range (3.9-10mmol/L [70-180mg/dL]) from run-in to the last two weeks of the randomized controlled trial.

  • This is a LONG study, designed to look for rare adverse events.
  • This study used the OpenAPS algorithm within a modified version of AndroidAPS, meaning the learning objectives were adapted for the purpose of the study. Participants spent at least 72 hours in “predictive low glucose suspend mode” (known as PLGM), which corrects for hypoglycemia but not hyperglycemia, before proceeding to the next stage of closed loop which also then corrected for hyperglycemia.
  • The full feature set of OpenAPS and AndroidAPS, including “supermicroboluses” (SMB) were able to be used by participants throughout the study.

Results:

Ninety-seven participants (48 children and 49 adults) were randomized.

Among adults, mean time in range (±SD) at study end was 74.5±11.9% using AID (Δ+ 9.6±11.8% from run-in; P<0.001) with 68% achieving a time in range of >70%.

Among children, mean time in range at study end was 67.5±11.5% (Δ+ 9.9±14.9% from run-in; P<0.001) with 50% achieving a time in range of >70%.

Mean time in range at study end for the control arm was 56.5±14.2% and 52.5±17.5% for adults and children respectively, with no improvement from run-in. No severe hypoglycemic or DKA events occurred in either arm. Two participants (one adult and one child) withdrew from AID due to frustrations with hardware issues.

  • The pump used in the study initially had an issue with the battery, and there were lots of pumps that needed refurbishment at the start of the study.
  • Aside from these pump issues, and standard pump site/cannula issues throughout the study (that are not unique to AID), there were no adverse events reported related to the algorithm or automated insulin delivery.
  • Only two participants withdrew from AID, due to frustration with pump hardware.
  • No severe hypoglycemia or DKA events occurred in either study arm!
  • In fact, use of open source AID improved time in range without causing additional hypoglycemia, which has long been a concern of critics of open source (and all types of) AID.
  • Time spent in ‘level 1’ and ‘level 2’ hyperglycemia was significantly lower in the AID group as well compared to the control group.

In the primary analysis, the mean (±SD) percentage of time that the glucose level was in the target range (3.9 – 10mmol/L [70-180mg/dL]) increased from 61.2±12.3% during run-in to 71.2±12.1% during the final 2-weeks of the trial in the AID group and decreased from 57.7±14.3% to 54±16% in the control group, with a mean adjusted difference (AID minus control at end of study) of 14.0 percentage points (95% confidence interval [CI], 9.2 to 18.8; P<0.001). No age interaction was detected, which suggests that adults and children benefited from AID similarly.

  • The CREATE study found that across children and adults, the percentage of time that the glucose level was in the target range of 3.9-10mmol/L [70-180mg/dL] was 14.0 percentage points higher among those who used the open-source AID system compared to those who used sensor augmented pump therapy.
  • This difference reflects 3 hours 21 minutes more time spent in target range per day!
  • For children AID users, they spent 3 hours 1 minute more time in target range daily (95% CI, 1h 22m to 4h 41m).
  • For adult AID users, they spent 3 hours 41 minutes more time in target range daily (95% CI, 2h 4m to 5h 18m).
  • Glycemic improvements were evident within the first week and were maintained over the 24-week trial. Meaning: things got better quickly and stayed so through the entire 24-week time period of the trial!
  • AID was most effective at night.
Difference between control and AID arms overall, and during day and night separately, of TIR for overall, adults, and kids

One thing I think is worth making note of is that one criticism of previous studies with open source AID is regarding the self-selection effect. There is the theory that people do better with open source AID because of self-selection and self-motivation. However, the CREATE study recruited a diverse cohort of participants, and the study findings (as described above) match all previous reports of safety and efficacy outcomes from previous studies. The CREATE study also found that the greatest improvements in TIR were seen in participants with lowest TIR at baseline. This means one major finding of the CREATE study is that all people with T1D, irrespective of their level of engagement with diabetes self-care and/or previous glycemic outcomes, stand to benefit from AID.

This therefore means there should be NO gatekeeping by healthcare providers or the healthcare system to restrict AID technology from people with insulin-requiring diabetes, regardless of their outcomes or experiences with previous diabetes treatment modalities.

There is also no age effect observed in the trail, meaning that the results of the CREATE Trial demonstrated that open-source AID is safe and effective in children and adults with type 1 diabetes. If someone wants to use open source AID, they would likely benefit, regardless of age or past diabetes experiences. If they don’t want to use open source AID or commercial AID…they don’t have to! But the choice should 100% be theirs.

In summary:

  • The CREATE trial was the first RCT to look at open source AID, after years of interest in such a study to complement the dozens of other studies evaluating open source AID.
  • The conclusion of the CREATE trial is that open-source AID using the OpenAPS algorithm within a version of AndroidAPS, a widely used open-source AID solution, appears safe and effective.
  • The CREATE trial found that across children and adults, the percentage of time that the glucose level was in the target range of 3.9-10mmol/L [70-180mg/dL] was 14.0 percentage points higher among those who used the open-source AID system compared to those who used sensor augmented pump therapy; a difference that reflects 3 hours 21 minutes more time spent in target range per day.
  • The study recruited a diverse cohort, yet still produced glycemic outcomes consistent with existing open-source AID literature, and that compare favorably to commercially available AID systems. Therefore, the CREATE Trial indicates that a range of people with type 1 diabetes might benefit from open-source AID solutions.

Huge thanks to each and every participant and their families for their contributions to this study! And ditto, big thanks to the amazing, multidisciplinary CREATE study team for their work on this study.


September 7, 2022 UPDATE – I’m thrilled to share that the paper with the primary outcomes from the CREATE trial is now published. You can find it on the journal site here, or like all of the research I contribute to, access an author copy on my research paper.

Example citation:

Burnside, M; Lewis, D; Crocket, H; et al. Open-Source Automated Insulin Delivery in Type 1 Diabetes. N Engl J Med 2022;387:869-81. DOI:10.1056/NE/Moa2203913

Note that the continuation phase study results are slated to be presented this fall at another conference!

Findings from the RCT on open source AID, the CREATE Trial, presented at #ADA2022

What You Should Know About Exocrine Pancreatic Insufficiency (EPI) or Pancreatic Exocrine Insufficiency (PEI)

I have a new part-time job as a pancreas, but this time, I don’t have any robot parts I can make to help.

This is a joke, because I have had type 1 diabetes for 19+ years and 7 years ago I helped make the world’s first open-source artificial pancreas, also known as an automated insulin delivery system, that we jokingly call my “robot parts” and takes care of 90+% of the work of living with type 1 diabetes. PS if you’re looking for more information, there’s a book for that, or a free 3 minute animated video explaining automated insulin delivery. 

The TL;DR of this post is that I have discovered I have a mild or moderate exocrine pancreatic insufficiency, known as EPI (or PEI, pancreatic exocrine insufficiency, depending on which order and acronym you like). There’s a treatment called pancreatic enzyme replacement therapy (PERT) which I have been trying.

It took a long time for me to get diagnosed (almost 2 years), so this post walks through my history and testing process with my gastroenterologist (GI doctor) and the importance of knowing your own body and advocating for yourself when something is wrong or not quite right.

Background

About six years after I was diagnosed with type 1 diabetes, I was doing a summer internship in Washington, D.C. (away from home) and started getting chest tightness and frequent abdominal pain. Sometimes it felt like my abdominal muscles were “knitting” into each other. Because I had type 1 diabetes, I had heard at one point that about 10% of people with type 1 also develop celiac disease. So, thankfully, it was as simple as calling my endocrinologist and scheduling testing, and getting an endoscopy and biopsy to confirm I had celiac disease. It took about 2 months, and the timing was mostly that long due to getting back to Alabama after my internship and the testing schedule of the hospital. This is relevant detail, because I later read that it takes an average of 7 years for most people to get diagnosed with celiac disease. That has been floating around in my brain now for over a decade, this awareness that GI stuff is notoriously hard to diagnose when you’re not lucky enough to have a clear idea, like I did, of an associated condition.

So, with type 1 diabetes and celiac disease, I use automated insulin delivery to get great outcomes for my diabetes and a 100% very careful gluten-free diet to manage my celiac disease, and have not had any GI problems ever since I went gluten-free.

Until January/February 2020, when I took an antibiotic (necessary for an infection I had) and started to get very minor GI side effects on day 5 of the 7-day antibiotic course. Because this antibiotic came with a huge warning about C. diff, and I really didn’t want C. diff, I discontinued the antibiotic. My infection healed successfully, but the disruption to my GI system continued. It wasn’t C. diff and didn’t match any of the C. diff symptoms, but I really lost my appetite for a month and didn’t want to eat, so I lost 10 pounds in February 2020. On the one hand, I could afford to lose the weight, but it wasn’t healthy because all I could bring myself to eat was one yogurt a day. I eventually decided to try eating some pecans to add fiber to my diet, and that fiber and change in diet helped me get back to eating more in March 2020, although I generally was eating pecans and dried cranberries (to increase my fiber intake) for breakfast and wasn’t hungry until late afternoon or early evening for another meal. So, since my body didn’t seem to want anything else, I essentially was eating two meals a day. My GI symptoms were better: not back to how they were before February 2020, but seemed manageable.

However, in July 2020, one night I woke up with incredibly painful stabbing abdominal pain and thought I would need to go to the ER. Thankfully, it resolved enough within minutes for me to go back to sleep, but that was scary. I decided to schedule an appointment with my gastroenterologist. I took in a record of my symptoms and timing and explained what was most worrisome to me (sudden stabbing pains after I ate or overnight, not seemingly associated with one particular type of food; changes in bathroom habits, like steatorrhea, but not as severe as diarrhea). He made a list of suspected things and we began testing: we checked for C. diff (nope), parasites (nope), bloodwork for inflammation (nope, so no Crohn’s or IBS or IBD), my celiac markers to make sure I wasn’t being accidentally glutened (nope: 100% gluten-free as proven by the blood work), H. pylori (nope), and did a CT scan to check for structural abnormalities (all good, again no signs of inflammation or any obvious issues).

Because all of this happened during the global COVID-19 pandemic, I was cautious about scheduling any in-person tests such as the CT scan or the last test on my list, a colonoscopy and endoscopy. I have a double family history of colon cancer, so although it was extremely unlikely, given everything else on the list was coming back as negative, it needed to be done. I waited until I was fully vaccinated (e.g. 2 weeks after 2 shots completed) to have my colonoscopy and endoscopy scheduled. The endoscopy was to check for celiac-related damage in my small intestine since I hadn’t had an endoscopy since my diagnosis with celiac over a decade ago. Thankfully, there’s no damage from celiac (I wasn’t expecting there to be any damage, but is a nice confirmation of my 100% very careful gluten free diet!), and the colonoscopy also came back clear.

Which was good, but also bad, because…SOMETHING was causing all of my symptoms and we still didn’t know what that was. The last thing on my doctor’s list was potentially small intestine bacterial overgrowth (SIBO), but the testing is notoriously non-specific, and he left it up to me as to whether I decided to treat it or not. Having run out of things to test, I decided to do a two-week course of an antibiotic to target the bacteria. It helped for about two weeks, and then my symptoms came back with a vengeance. However, I had realized in spring 2021 (after about 9 months of feeling bad) that sometimes the stabbing abdominal pain happened when I ate things with obvious onion or garlic ingredients, so January-July 2021 I had avoided onion and garlic and saw a tiny bit of improvement (but nowhere near my old normal). Because of my research on onion and garlic intolerances, and then additional research looking into GI things, I realized that the low FODMAP diet which is typically prescribed for IBS/IBD (which I don’t have) could be something I could try without a lot of risk: if it helped, that would be an improvement, regardless of whatever I actually had.

So in August 2021, as noted in this blog post, I began the low FODMAP diet first starting with a careful elimination phase followed by testing and adding foods back into my diet. It helped, but over time I’ve realized that I still get symptoms (such as extreme quantities of gas, abdominal discomfort and distention, changed bathroom habits) even when I’m eating low FODMAP. It’s possible low FODMAP itself helped by avoiding certain types of food, but it’s also possible that it was helping because I was being so careful about the portions and timing of when I was eating, to avoid “stacking” FODMAPs.

One other thing I had tried, as I realized my onion and garlic intolerance was likely tied to being “fructans”, and that I had discovered I was sensitive to fructans in other foods, was an enzyme powder called Fodzyme. (I have no affiliation with this company, FYI). The powder works to target the FODMAPs in food to help neutralize them so they don’t cause symptoms. It worked for me on the foods I had experimented with, and it allowed me to eat food that had onion powder or garlic powder listed as a minor ingredient (I started small and cautious and am working my way up in testing other foods and different quantities). I longingly wished that there were other enzymes I could take to help improve digestion, because Fodzyme seemed to not only reduce the symptoms I had after I ate, but also seemed to improve my digestion overall (e.g. improved stool formation). I did some research but “digestive enzymes” are generally looked down upon and there’s no good medical research, so I chalked it up to snake oil and didn’t do anything about it.

Until, oddly enough, in November 2021 I noticed a friend’s social media post talking about their dog being diagnosed with exocrine pancreatic insufficiency (EPI). It made me go look up EPI in humans to see if it was a thing, because their experience sounded a lot like mine. Turns out, EPI is a thing, and it’s very common in humans who have cystic fibrosis; pancreas-related surgeries or pancreatic cancer; and there is also a known correlation with people with type 1 diabetes or with celiac disease.

Oh hey, that’s me (celiac and type 1 diabetes).

I did more research and found that various studies estimate 40% of people with type 1 diabetes have low levels of pancreatic elastase, which is a proxy for determining if you have insufficient enzymes being produced by your pancreas to help you digest your food. The causal mechanism is unclear, so they don’t know whether it’s just a ‘complication’ and side effect of diabetes and the pancreas no longer producing insulin, or if there is something else going on.

Given the ties to diabetes and celiac, I reached out to my GI doctor again in December 2021 and asked if I should get my pancreatic elastase levels tested to check for exocrine pancreatic insufficiency (EPI), given that my symptoms matching the textbook definition and my risk factors of diabetes and celiac. He said sure, sent in the lab request, and I got the lab work done. My results are on the borderline of ‘moderate’ insufficiency, and given my very obvious and long-standing symptoms, and given my GI doc said there would be no harm from trying, I start taking pancreatic enzyme replacement therapy (called PERT). Basically, this means I swallow a pill that contains enzymes with the first bite of food that I eat, and the enzymes help me better digest the food I am eating.

And guess what? For me, it works and definitely has helped reduce symptoms after I’m eating and with next-day bathroom habits. So I consider myself to have mild or moderate exocrine pancreatic insufficiency (EPI).

(Also, while I was waiting on my test results to come back, I found that there is a lipase-only version of digestive enzymes available to purchase online, so I got some lipase and began taking it. It involves some titration to figure out how much I needed, but I saw some improvement already from low doses of lipase, so that also led me to want to try PERT, which contains all 3 types of enzymes your pancreas normally naturally produces, even though my elastase levels were on the borderline of ‘moderate’ insufficiency. Not everyone with lower levels of elastase has insufficiency in enzymes, but my symptoms and response to lipase and PERT point to the fact that I personally do have some insufficiency.)

More about my experiences with exocrine pancreatic insufficiency

Unfortunately, there is no cure for exocrine pancreatic insufficiency. Like Type 1 diabetes, it requires lifelong treatment. So, I will be taking insulin and now PERT likely for the rest of my life. Lazy pancreas! (Also, it’s possible I will need to increase my PERT dose over time if my insufficiency increases.)

Why treat EPI? Well, beyond managing very annoying symptoms that impact quality of life, if left untreated it’s associated with increased mortality (e.g. dying earlier than you would otherwise) due to malnutrition (because you’re not properly absorbing the nutrients in the food you’re eating) and bone density problems.

Oddly enough, there seem to be two versions of the name (and therefore two acronyms) for the same thing: EPI and PEI, meaning exocrine pancreatic insufficiency or pancreatic exocrine insufficiency. I haven’t found a good explanation for why there are two names and if there are any differences. Luckily, my research into the medical literature shows they both pop up in search results pretty consistently, so it’s not like you end up missing a big body of literature if you use one search term or the other.

Interestingly, I learned 90% of people with cystic fibrosis may need PERT, and thankfully my friend with CF didn’t mind me reaching out to ask her if she had ever taken PERT or had any tips to give me from her knowledge of the CF community. That was nice that it turns out I do know some other people with EPI/PEI, even though they don’t usually talk about it because it seems to go hand in hand with CF. Some of the best resources of basic information about EPI/PEI are written either by CF foundations or by pancreatic cancer-related organizations, because those are the two biggest associated conditions that also link to EPI/PEI. There are also other conditions like diabetes and celiac with strong correlations, but these communities don’t seem to talk about it or have resources focused on it. (As with low FODMAP resources where everything is written for IBS/IBD, you can extrapolate and ignore everything that’s IBS/IBD specific. Don’t be afraid to read EPI/PEI information from communities that aren’t your primary community!)

Sadly, like so many GI conditions (remember in the intro I referenced 7 years average diagnosis time with celiac), it seems ridiculously hard to get to a diagnosis of EPI. I essentially self-diagnosed myself (and confirmed the diagnosis in partnership with my GI doc who agreed to run the tests). I am still very surprised that it never came up on his list of possible conditions despite having symptoms that are textbook EPI and having diabetes and celiac, which are known correlations. Apparently, this is common: I read one study that says even people with super high-risk factors (e.g. pancreas surgery, pancreatic cancer) aren’t necessarily screened, either! So it’s not just me falling through the cracks, and this is something the gastroenterology world needs to be better about. It’s also common for patients to bring this up to their doctors vs their doctors suggesting it as a potential diagnosis – this study found 24% of people brought up EPI, like I did, to their doctors.

Also, unfortunately, I had a few people (including family members) suggest to me in the last two years that my symptoms are psychosomatic, or stress-related. They’re clearly, as proven by lab work, not psychosomatic or stress-related but are a result of my exocrine pancreatic functions failing. Please, don’t ever suggest someone dealing with GI issues is experiencing symptoms due to stress – this is the kind of comment you should keep to yourself. (The last time someone mentioned this to me was months ago, and it still bothers me to think about it.)

Advocate for yourself

One of the very important things I learned early on when living with type 1 diabetes was the importance of knowing my own body, and advocating for myself. This unfortunately was a hard lesson learned, because I had general practice (GP or primary care / PCP) doctors who would refuse to treat me because I had diabetes because they were concerned about prescribing something that would mess up my blood sugars. They’d completely ignore the point that whatever infection I had would cause MORE disruption to my blood sugars by having me be sick and suffer longer, than I would have disruption to my blood sugar levels from a prescription. Sigh. So for the last almost two decades, I have had to go into every health encounter prepared to advocate for myself and make sure I get the medical expertise for whatever I’m there for, and not the less experienced take on diabetes (assuming I wasn’t there for diabetes, which I usually wasn’t).

This has translated into how I approached finding solutions for my GI symptoms. Per my history described above, I had increasing but minor GI symptoms from February-July 2020. Having new, stabbing pains in my abdomen led me to the gastroenterologist for a long list of testing for various things, but I had to continue to push for the next round of testing and schedule and manage everything to proceed through the list we had discussed at my appointment. Later, after we ran through the list, I had to try things like low FODMAP for myself, and then do additional research and identify the test for EPI as a likely next step to try.

I felt a little like the ‘boiling frog’ analogy, where my symptoms gradually worsened over time, but they weren’t startling bad (except for the points in time when I had stabbing abdominal pain). Or the two times, almost one year apart (Oct 2020 and Dec 2021) where I had what I considered bad “flares” of something where I got really hot and feeling really ill all of a sudden, but it wasn’t COVID-19 and it wasn’t anything specific causing it, there were no obvious food triggers, and the only thing I could do was lay down for 2-3 hours and rest before I started to feel better. Those were probably correlated with “overdoing it” with physical activity, but I’ve also run a marathon and a 50k ultramarathon in the last year and didn’t have problems on those days, so there’s not a certain threshold of activity that appears to cause that. Thankfully, that has only happened two times.

Other than those scenarios, it wasn’t like breaking my ankle where there was a clear “everything was fine and now something is broken”, but it was more like “I have had not-good-digestion and various increasing GI symptoms that don’t fit any clear problem or diagnosis on our shortlist of the 5 likely things it might be. It’s not excruciating but it is increasingly impacting my quality of life, and twisting myself into a pretzel with an evolving pattern of dietary modifications is not solving it”. It took me continuing to advocate for myself and not accepting suffering for the rest of my life (hopefully!) with these symptoms to get to an answer, which for me, so far, seems to be moderate exocrine pancreatic insufficiency.

What it’s like to start taking pancreatic enzyme replacement therapy (PERT)

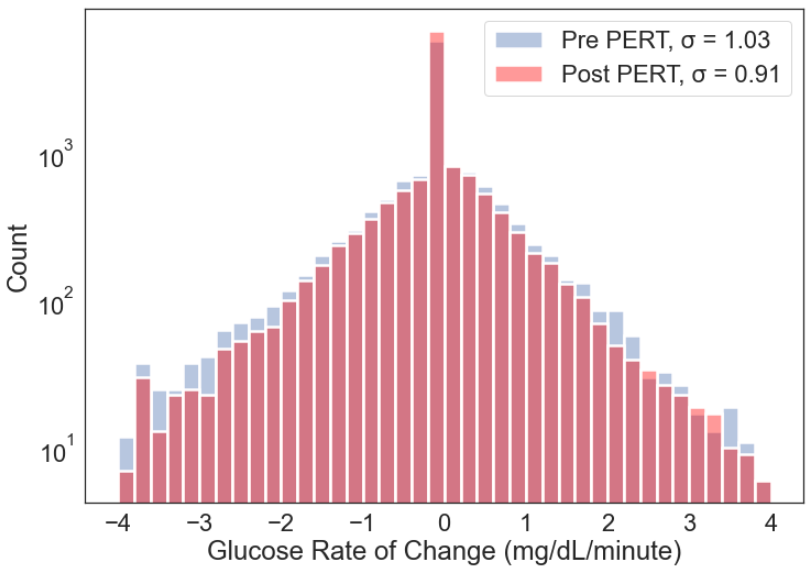
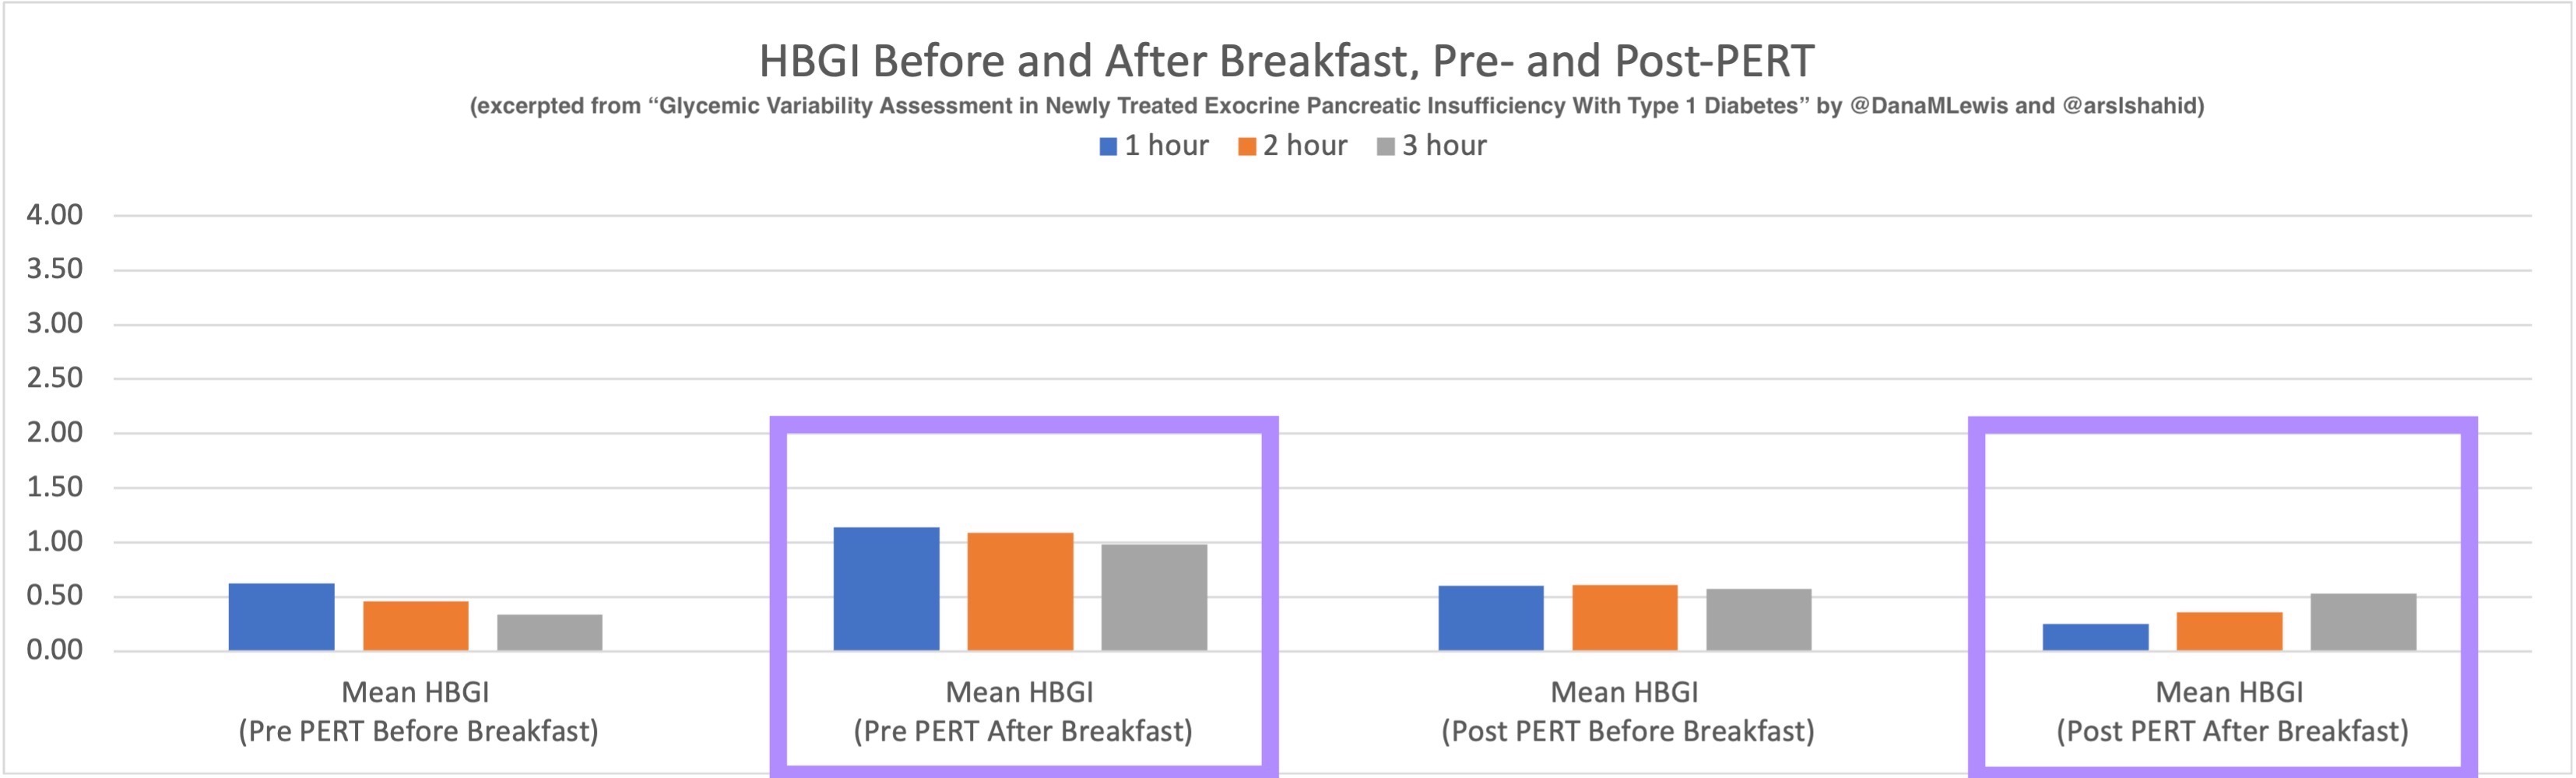
PERT is typically measured by the units/amount of lipase it contains, even though it contains all 3 types of enzymes. (Some of the Medicare documents in different states actually are really helpful for comparing the size of dosing across the different brands of PERT. That also helped me look up the various brands in my insurance plan to see whether there would be a price difference between two of the most common brands.) Depending on symptoms and your level of insufficiency, like insulin, it requires some titration to figure out the right doses. I’ve been attempting to track generally the amount of fat that I’m eating to try to get a sense of my “ratio” of fat to lipase needed, although the research shows there is likely not a linear correlation between grams of fat and units of lipase needed. Another way to think about it is at what level of grams of fat in your meal do you need more than your current dose. For example, one pill of PERT at my current dose seems to work up to around 70 or so grams of fat per meal, as long as it doesn’t have more than 50% protein. Meals containing much more fat (120 g or so) definitely require more, as do meals with either a higher quantity of protein or a closer ratio of 1:1 fat to protein.

Different people have different needs with regard to whether they need enzyme support “just” for fat, or also for protein and carbs. I appear to at least need some support for carbs as well as protein, but am still establishing at what levels I need which dosing of which enzymes.

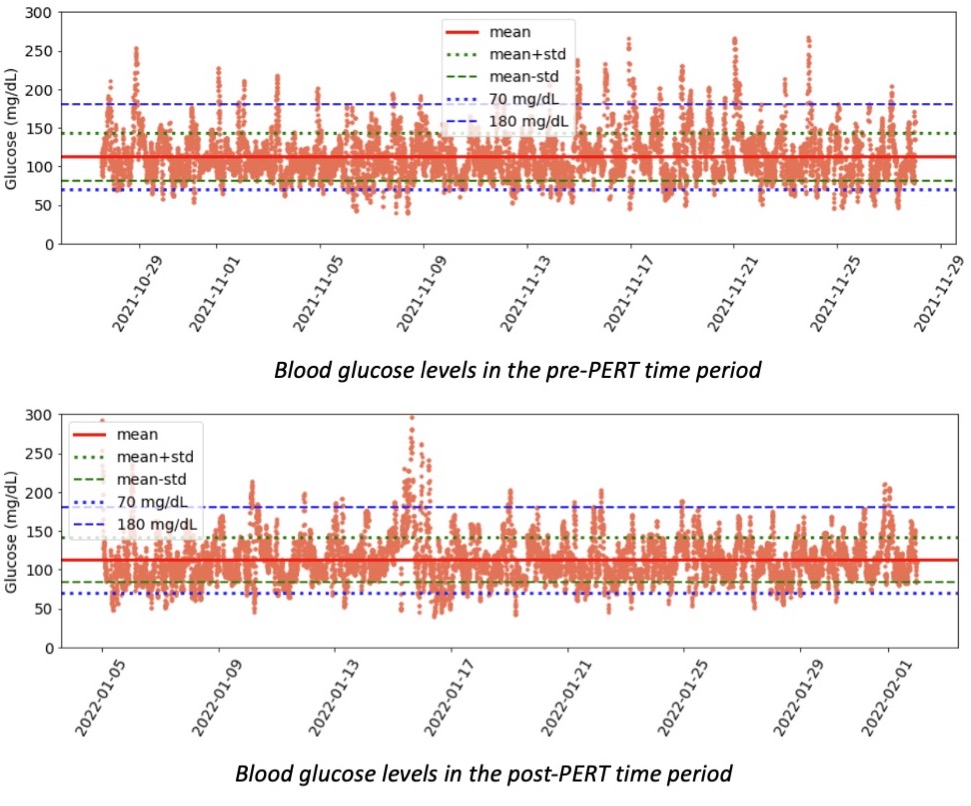
Personally, I am tracking to see whether my symptoms are reduced or eliminated in the hours following my meals (gas, abdominal discomfort, a sick feeling after eating) as well as the next day (bloating/abdominal distension, bathroom habits such as reduced steatorrhea), and overall whether I have any more of those really bad “flares”. My initial tests of taking PERT show improvements after my meals (I don’t feel sick after I eat anymore!) and often the next day.

After the first few days of trying food that was low FODMAP but giving me minor symptoms before PERT, I’ve also felt confident enough to try meals that I’ve avoided eating for over a year, such as a gluten free burger from one of our nearby local favorites! Even though it’s been well over a year since I’ve had it last, I immediately could tell a difference in how I felt eating it, due to taking PERT with it. There was no wave of fatigue before I was halfway through the burger, and no gas or feeling sick to my stomach after eating. I had clearly forgotten what it was like to not feel miserable after eating and to actually enjoy eating food! So far, PERT has been exceeding my expectations (although those were rather low).

It makes it slightly less annoying, then, to think about the price of PERT. Roughly, one month of PERT at the dosage I’m currently on costs the same as 3 vials of insulin in the US (in the ballpark of $800). Like insulin, PERT is necessary and worthwhile (and thankfully I do have health insurance).

Pancreases are great when they work…and expensive to replace!

A play on the spiderman meme of two spiderman's pointing at each other, indicating similar things. Labeled "exocrine pancreatic functions" and "endocrine pancreatic functions", indicating both of mine are not working as they should be.

TLDR: I have a new thing, exocrine pancreatic insufficiency, to deal with. Thankfully, there’s a treatment (PERT) that I can use to reduce symptoms and hopefully limit the potential impacts on morbidity long term. If you have diabetes or celiac and you have unexplained GI symptoms over time, you might want to do some research into EPI and discuss it with your gastroenterologist.

Also…for any endocrinologist reading this…or any other healthcare providers…if you have patients with diabetes and suspected GI issues, please consider EPI as a possible diagnosis once you’ve ruled out celiac disease and other likely suspects. Given the high rates of lowered elastase in all types of diabetes, it’s worth screening for EPI in patients with otherwise-unexplained steatorrhea or similar symptoms.

PS – if you land on this post and haven’t seen it already, you may want to check out PERT Pilot, the first iOS app for Exocrine Pancreatic Insufficiency! It’s an iOS app that I built that allows you to record as many meals as you want, the PERT dosing and outcomes, to help you visualize and review more of your PERT dosing data!


You can also contribute to a research study and help us learn more about EPI/PEI – take this anonymous survey to share your experiences with EPI-related symptoms!

Looking back at work and accomplishments in 2021

I decided to do a look back at the last year’s worth of work, in part because it was a(nother) weird year in the world and also because, if you’re interested in my work, unless you read every single Tweet, there may have been a few things you missed that are of interest!

In general, I set goals every year that stretch across personal and professional efforts. This includes a daily physical activity streak that coincides with my walking and running lots of miles this year in pursuit of my second marathon and first (50k) ultramarathon. It’s good for my mental and physical health, which is why I post almost daily updates to help keep myself accountable. I also set goals like “do something creative” which could be personal (last year, knitting a new niece a purple baby blanket ticked the box on this goal!) or professional. This year, it was primarily professional creativity that accomplished this goal (more on that below).

Here’s some specifics about goals I accomplished:

RUNNING

  • My initial goal was training ‘consistently and better’ than I did for my first marathon, with 400 miles as my stretch goal if I was successfully training for the marathon. (Otherwise, 200 miles for the year would be the goal without a marathon.) My biggest-ever running year in 2013 with my first marathon was 356 miles, so that was a good big goal for me. I achieved it in June!
  • I completed my second marathon in July, and PR’d by over half an hour.
  • I completed my first-ever ultramarathon, a 50k!
  • I re-set my mileage goal after achieving 400 miles..to 500..600…etc. I ultimately achieved the biggest-ever mileage goal I’ve ever hit and think I ever will hit: I ran 1,000 miles in a single year!
  • I wrote lots of details about my methods of running (primarily, run/walking) and running with diabetes here. If you’re looking for someone to cheer you on as you set a goal for daily activity, like walking, or learning to run, or returning to running…DM or @ me on Twitter (@DanaMLewis). I love to cheer people on as they work toward their activity goals! It helps keep me inspired, too, to keep aiming at my own goals.

CREATIVITY

  • My efforts to be creative were primarily on the professional side this year. The “Convening The Center” project ended up having 2 out of 3 of my things that I categorized as being creative. The first was the design of the digital activities and the experience of CTC overall (more about that here). The second were the items in the physical “kit” we mailed out to participants: we brainstormed and created custom playing cards and physical custom keychains. They were really fun to make, especially in partnership with our excellent project artist, Rebeka Ryvola, who did the actual design work!
  • My third “creative” endeavor was a presentation, but it was unlike the presentations I usually give. I was tasked to create a presentation that was “visually engaging” and would not involve showing my face in the presentation. I’ve linked to the video below in the presentation section, but it was a lot of work to think about how to create a visually and auditory focused presentation and try to make it engaging, and I’m proud of how it turned out!

RESEARCH AND PUBLICATIONS

  • This is where the bulk of my professional work sits right now. I continue to be a PI on the CREATE trial, the world’s first randomized control trial assessing open-source automated insulin delivery technology, including the algorithm Scott and I dreamed up and that I have been using every day for the past 7 years. The first data from the trial itself is forthcoming in 2022. 
  • Convening The Center also was a grant-funded project that we turned into research with a publication that we submitted, assessing more of what patients “do”, which is typically not assessed by researchers and those looking at patient engagement in research or innovation. Hopefully, the publication of the research article we just submitted will become a 2022 milestone! In the meantime, you can read our report from the project here (https://bit.ly/305iQ1W ), as this grant-funded project is now completed.
  • Goal-wise, I aim to generate a few publications every year. I do not work for any organization and I am not an academic. However, I come from a communications background and see the benefit of reaching different audiences where they are, which is why I write blog posts for the patient community and also seek to disseminate knowledge to the research and clinical communities through traditional peer-reviewed literature. You can see past years’ research articulated on my research page (DIYPS.org/research), but here’s a highlight of some of the 2021 publications:
  • Also, although I’m not a traditional academic researcher, I also participate in the peer review process and frequently get asked to peer-review submitted articles to a variety of journals. I skimmed my email and it looks like I completed (at least) 13 peer reviews, most of which included also reviewing subsequent revisions of those submitted articles. So it looks like my rate of peer reviewing (currently) is matching my rate of publishing. I typically get asked to review articles related to open-source or DIY diabetes technology (OpenAPS, AndroidAPS, Loop, Nightscout, and other efforts), citizen science in healthcare, patient-led research or patient engagement in research, digital health, and diabetes data science. If you’re submitting articles on that topic, you’re welcome to recommend me as a potential reviewer.

PRESENTATIONS

  • I continued to give a lot of virtual presentations this year, such as at conferences like the “Insulin100” celebration conference (you can see the copy I recorded of my conference presentation here). I keynoted at the European Patients Forum Congress as well as at ADA’s Precision Diabetes Medicine 2021; an invited talk ADA Scientific Sessions (session coverage here); the 2021 Federal Wearables Summit: (video here); and the BIH Clinician Scientist Symposium (video here), to name a few (but not all).
  • Additionally, as I mentioned, one of the presentations I’m most proud of was created for the Fall 2021 #DData Exchange event:

OTHER STUFF

I did quite a few other small projects that don’t fit neatly into the above categories.

One final thing I’m excited to share is that also in 2021, Amazon came out with a beta program for producing hardcover/hardback books, alongside the ability to print paperback books on demand (and of course Kindle). So, you can now buy a copy of my book about Automated Insulin Delivery: How artificial pancreas “closed loop” systems can aid you in living with diabetes in paperback, hardback, or on Kindle. (You can also, still, read it 100% for free online via your phone or desktop at ArtificialPancreasBook.com, or download a PDF for free to read on your device of choice. Thousands of people have downloaded the PDF!)

Now available in hardcover, the book about Automated Insulin Delivery by Dana M. Lewis

Update – 2021 Convening The Center!

2020 did not go exactly as planned, and that includes Convening the Center (see original announcement/plan here), which we had intended to be an awesome, in-person gathering of individuals who are new or have previous experience working to improve healthcare through advocacy, innovation, design, research, entrepreneurship, or some other category of “doing” and “fixing” problems they see for themselves and their community. But, as an early “I see COVID-19 is going to be a problem” person (see this post Scott and I posted March 7 begging people to stay home), by early February I was warning my co-PI and RWJF contacts that we would likely be postponing Convening the Center, and by May that was pretty clear. So we decided to request (and received) an extension on our grant from RWJF to enable us to push the grant into 2021…and ultimately, ::waves hand at everything still going on:: decided to shift to an all-virtual experience.

I’ll be honest – I was a little disappointed! But now, after several more months of work with John (Harlow, my Co-PI), I’m now very excited about the opportunities an all-virtual experience for Convening the Center will bring. First and foremost, although we planned to pay participants for ALL travel costs, hotel, food, AND for their time, I knew there would likely be people who would still not be able to travel to participate. I am hoping with a virtual experience (where we still pay people for their time!), the reduced time commitment to participate will enable those people to potentially participate.

Secondly, we’ve been thinking quite a bit about the design of virtual meetings and gatherings and have some ideas up our sleeve (which we’ll share as we finish developing them!) about how to achieve the goals of our gathering, online, without triggering video conference fatigue. If you’ve had any fantastic virtual experiences in 2020 (or ever), please let us know what they were, and what you loved (or what to avoid!), so that we can draw on as many inputs as possible to design this virtual experience.

Here’s what Convening the Center will now look like:

  • Starting now: recruitment. We are looking to solicit interest from individuals who are new or have some experience working to change or improve health, healthcare, communities, etc. If that’s you, please self-nominate yourself here, and/or please also consider sharing this with your communities or a friend from another community!
  • January: we will reach out to nominees with another short form to gather a bit more information to help us create the cohort.
  • Early February: we will notify selected participants.
  • February: Phase 1 (2 hours scheduled time commitment from participants, plus some asynchronous opportunities)
  • April: Phase 2 (2-4 hour schedule time commitment from participants, plus some asynchronous opportunities)
  • June: Phase 3 (2-4 hour scheduled time commitment from participants, plus some asynchronous opportunities)

We’ll be sharing more in the future about what the “phases” look like, and this virtual format will allow us to also invite participation from a broader group beyond the original cohort of participants. Stay tuned!

Again, here is the nomination link you can self-nominate or nominate others at. Thanks!

Nominate someone you know for Convening The Center!

Poster and presentation content from @DanaMLewis at #ADA2020 and #DData20

In previous years (see 2019 and 2018), I mentioned sharing content from ADA Scientific Sessions (this year it’s #ADA2020) with those not physically present at the conference. This year, NO ONE is present at the event, and we’re all virtual! Even more reason to share content from the conference. :)

I contributed to and co-authored two different posters at Scientific Sessions this year:

  • “Multi-Timescale Interactions of Glucose and Insulin in Type 1 Diabetes Reveal Benefits of Hybrid Closed Loop Systems“ (poster 99-LB) along with Azure Grant and Lance Kriegsfeld, PhD.
  • “Do-It-Yourself Artificial Pancreas Systems for Type 1 Diabetes Reduce Hyperglycemia Without Increasing Hypoglycemia” (poster 988-P in category 12-D Clinical Therapeutics/New Technology—Insulin Delivery Systems), alongside Jennifer Zabinsky, MD MEng, Haley Howell, MSHI, Alireza Ghezavati, MD, Andrew Nguyen, PhD, and Jenise Wong, MD PhD.

And, while not a poster at ADA, I also presented the “AID-IRL” study funded by DiabetesMine at #DData20, held in conjunction with Scientific Sessions. A summary of the study is also included in this post.

First up, the biological rhythms poster, “Multi-Timescale Interactions of Glucose and Insulin in Type 1 Diabetes Reveal Benefits of Hybrid Closed Loop Systems” (poster 99-LB). (Twitter thread summary of this poster here.)

Building off our work as detailed last year, Azure, Lance, and I have been exploring the biological rhythms in individuals living with type 1 diabetes. Why? It’s not been done before, and we now have the capabilities thanks to technology (pumps, CGM, and closed loops) to better understand how glucose and insulin dynamics may be similar or different than those without diabetes.

Background:

Mejean et al., 1988
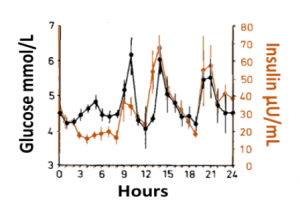
Blood glucose and insulin exhibit coupled biological rhythms at multiple timescales, including hours (ultradian, UR) and the day (circadian, CR) in individuals without diabetes. The presence and stability of these rhythms are associated with healthy glucose control in individuals without diabetes. (See right, adapted from Mejean et al., 1988).

However, biological rhythms in longitudinal (e.g., months to years) data sets of glucose and insulin outputs have not been mapped in a wide population of people with Type 1 Diabetes (PWT1D). It is not known how glucose and insulin rhythms compare between T1D and non-T1D individuals. It is also unknown if rhythms in T1D are affected by type of therapy, such as Sensor Augmented Pump (SAP) vs. Hybrid Closed Loop (HCL). As HCL systems permit feedback from a CGM to automatically adjust insulin delivery, we hypothesized that rhythmicity and glycemia would exhibit improvements in HCL users compared to SAP users. We describe longitudinal temporal structure in glucose and insulin delivery rate of individuals with T1D using SAP or HCL systems in comparison to glucose levels from a subset of individuals without diabetes.

Data collection and analysis:

We assessed stability and amplitude of normalized continuous glucose and insulin rate oscillations using the continuous wavelet transformation and wavelet coherence. Data came from 16 non-T1D individuals (CGM only, >2 weeks per individual) from the Quantified Self CGM dataset and 200 (n = 100 HCL, n = 100 SAP; >3 months per individual) individuals from the Tidepool Big Data Donation Project. Morlet wavelets were used for all analyses. Data were analyzed and plotted using Matlab 2020a and Python 3 in conjunction with in-house code for wavelet decomposition modified from the “Jlab” toolbox, from code developed by Dr. Tanya Leise (Leise 2013), and from the Wavelet Coherence toolkit by Dr. Xu Cui. Linear regression was used to generate correlations, and paired t-tests were used to compare AUC for wavelet and wavelet coherences by group (df=100). Stats used 1 point per individual per day.

Wavelets Assess Glucose and Insulin Rhythms and Interactions

Wavelet Coherence flow for glucose and insulin

Morlet wavelets (A) estimate rhythmic strength in glucose or insulin data at each minute in time (a combination of signal amplitude and oscillation stability) by assessing the fit of a wavelet stretched in window and in the x and y dimensions to a signal (B). The output (C) is a matrix of wavelet power, periodicity, and time (days). Transform of example HCL data illustrate the presence of predominantly circadian power in glucose, and predominantly 1-6 h ultradian power in insulin. Color map indicates wavelet power (synonymous with Y axis height). Wavelet coherence (D) enables assessment of rhythmic interactions between glucose and insulin; here, glucose and insulin rhythms are highly correlated at the 3-6 (ultradian) and 24 (circadian) hour timescales.

Results:

Hybrid Closed Loop Systems Reduce Hyperglycemia

Glucose distribution of SAP, HCL, and nonT1D
  • A) Proportional counts* of glucose distributions of all individuals with T1D using SAP (n=100) and HCL (n=100) systems. SAP system users exhibit a broader, right shifted distribution in comparison to individuals using HCL systems, indicating greater hyperglycemia (>7.8 mmol/L). Hypoglycemic events (<4mmol/L) comprised <5% of all data points for either T1D dataset.
  • B) Proportional counts* of non-T1D glucose distributions. Although limited in number, our dataset from people without diabetes exhibits a tighter blood glucose distribution, with the vast majority of values falling in euglycemic range (n=16 non-T1D individuals).
  • C) Median distributions for each dataset.
  • *Counts are scaled such that each individual contributes the same proportion of total data per bin.

HCL Improves Correlation of Glucose-Insulin Level & Rhythm

Glucose and Insulin rhythms in SAP and HCL

SAP users exhibit uncorrelated glucose and insulin levels (A) (r2 =3.3*10-5; p=0.341) and uncorrelated URs of glucose and insulin (B) (r2 =1.17*10-3; p=0.165). Glucose and its rhythms take a wide spectrum of values for each of the standard doses of insulin rates provided by the pump, leading to the striped appearance (B). By contrast, Hybrid Closed Loop users exhibit correlated glucose and insulin levels (C) (r2 =0.02; p=7.63*10-16), and correlated ultradian rhythms of glucose and insulin (D) (r2 =-0.13; p=5.22*10-38). Overlays (E,F).

HCL Results in Greater Coherence than SAP

Non-T1D individuals have highly coherent glucose and insulin at the circadian and ultradian timescales (see Mejean et al., 1988, Kern et al., 1996, Simon and Brandenberger 2002, Brandenberger et al., 1987), but these relationships had not previously been assessed long-term in T1D.

coherence between glucose and insulin in HCL and SAP, and glucose swings between SAP, HCL, and non-T1D
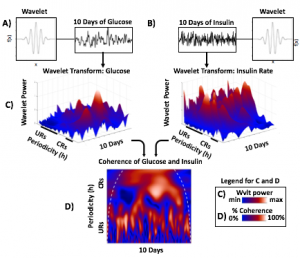
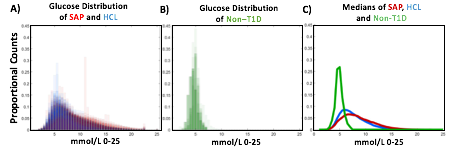
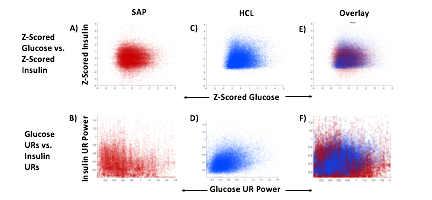
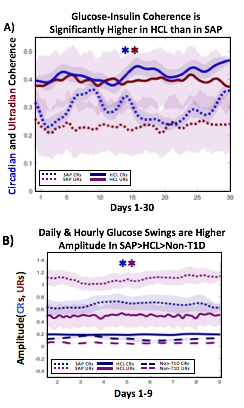
A) Circadian (blue) and 3-6 hour ultradian (maroon) coherence of glucose and insulin in HCL (solid) and SAP (dotted) users. Transparent shading indicates standard deviation. Although both HCL and SAP individuals have lower coherence than would be expected in a non-T1D individual,  HCL CR and UR coherence are significantly greater than SAP CR and UR coherence (paired t-test p= 1.51*10-7 t=-5.77 and p= 5.01*10-14 t=-9.19, respectively). This brings HCL users’ glucose and insulin closer to the canonical non-T1D phenotype than SAP users’.

B) Additionally, the amplitude of HCL users’ glucose CRs and URs (solid) is closer (smaller) to that of non-T1D (dashed) individuals than are SAP glucose rhythms (dotted). SAP CR and UR amplitude is significantly higher than that of HCL or non-T1D (T-test,1,98, p= 47*10-17 and p= 5.95*10-20, respectively), but HCL CR amplitude is not significantly different from non-T1D CR amplitude (p=0.61).

Together, HCL users are more similar than SAP users to the canonical Non-T1D phenotype in A) rhythmic interaction between glucose and insulin and B) glucose rhythmic amplitude.

Conclusions and Future Directions

T1D and non-T1D individuals exhibit different relative stabilities of within-a-day rhythms and daily rhythms in blood glucose, and T1D glucose and insulin delivery rhythmic patterns differ by insulin delivery system.

Hybrid Closed Looping is Associated With:

  • Lower incidence of hyperglycemia
  • Greater correlation between glucose level and insulin delivery rate
  • Greater correlation between ultradian glucose and ultradian insulin delivery rhythms
  • Greater degree of circadian and ultradian coherence between glucose and insulin delivery rate than in SAP system use
  • Lower amplitude swings at the circadian and ultradian timescale

These preliminary results suggest that HCL recapitulates non-diabetes glucose-insulin dynamics to a greater degree than SAP. However, pump model, bolusing data, looping algorithms and insulin type likely all affect rhythmic structure and will need to be further differentiated. Future work will determine if stability of rhythmic structure is associated with greater time in range, which will help determine if bolstering of within-a-day and daily rhythmic structure is truly beneficial to PWT1D.
Acknowledgements:

Thanks to all of the individuals who donated their data as part of the Tidepool Big Data Donation Project, as well as the OpenAPS Data Commons, from which data is also being used in other areas of this study. This study is supported by JDRF (1-SRA-2019-821-S-B).

(You can download a full PDF copy of the poster here.)

Next is “Do-It-Yourself Artificial Pancreas Systems for Type 1 Diabetes Reduce Hyperglycemia Without Increasing Hypoglycemia” (poster 988-P in category 12-D Clinical Therapeutics/New Technology—Insulin Delivery Systems), which I co-authored alongside Jennifer Zabinsky, MD MEng, Haley Howell, MSHI, Alireza Ghezavati, MD, Andrew Nguyen, PhD, and Jenise Wong, MD PhD. There is a Twitter thread summarizing this poster here.

This was a retrospective double cohort study that evaluated data from the OpenAPS Data Commons (data ranged from 2017-2019) and compared it to conventional sensor-augmented pump (SAP) therapy from the Tidepool Big Data Donation Project.

Methods:

  • From the OpenAPS Data Commons, one month of CGM data (with more than 70% of the month spent using CGM), as long as they were >1 year of living with T1D, was used. People could be using any type of DIYAPS (OpenAPS, Loop, or AndroidAPS) and there were no age restrictions.
  • A random age-matched sample from the Tidepool Big Data Donation Project of people with type 1 diabetes with SAP was selected.
  • The primary outcome assessed was percent of CGM data <70 mg/dL.
  • The secondary outcomes assessed were # of hypoglycemic events per month (15 minutes or more <70 mg/dL); percent of time in range (70-180mg/dL); percent of time above range (>180mg/dL), mean CGM values, and coefficient of variation.
Methods_DIYAPSvsSAP_ADA2020_DanaMLewis

Demographics:

  • From Table 1, this shows the age of participants was not statistically different between the DIYAPS and SAP cohorts. Similarly, the age at T1D diagnosis or time since T1D diagnosis did not differ.
  • Table 2 shows the additional characteristics of the DIYAPS cohort, which included data shared by a parent/caregiver for their child with T1D. DIYAPS use was an average of 7 months, at the time of the month of CGM used for the study. The self-reported HbA1c in DIYAPS was 6.4%.
Demographics_DIYAPSvsSAP_ADA2020_DanaMLewis DIYAPS_Characteristics_DIYAPSvsSAP_ADA2020_DanaMLewis

Results:

  • Figure 1 shows the comparison in outcomes based on CGM data between the two groups. Asterisks (*) indicate statistical significance.
  • There was no statistically significant difference in % of CGM values below 70mg/dL between the groups in this data set sampled.
  • DIYAPS users had higher percent in target range and lower percent in hyperglycemic range, compared to the SAP users.
  • Table 3 shows the secondary outcomes.
  • There was no statistically significant difference in the average number of hypoglycemic events per month between the 2 groups.
  • The mean CGM glucose value was lower for the DIYAPS group, but the coefficient of variation did not differ between groups.
CGM_Comparison_DIYAPSvsSAP_ADA2020_DanaMLewis SecondaryOutcomes_DIYAPSvsSAP_ADA2020_DanaMLewis

Conclusions:

    • Users of DIYAPS (from this month of sampled data) had a comparable amount of hypoglycemia to those using SAP.
    • Mean CGM glucose and frequency of hyperglycemia were lower in the DIYAPS group.
    • Percent of CGM values in target range (70-180mg/dL) was significantly greater for DIYAPS users.
    • This shows a benefit in DIYAPS in reducing hyperglycemia without compromising a low occurrence of hypoglycemia. 
Conclusions_DIYAPSvsSAP_ADA2020_DanaMLewis

(You can download a PDF of the e-poster here.)

Finally, my presentation at this year’s D-Data conference (#DData20). The study I presented, called AID-IRL, was funded by Diabetes Mine. You can see a Twitter thread summarizing my AID-IRL presentation here.

AID-IRL-Aim-Methods_DanaMLewis

I did semi-structured phone interviews with 7 users of commercial AID systems in the last few months. The study was funded by DiabetesMine – both for my time in conducting the study, as well as funding for study participants. Study participants received $50 for their participation. I sought a mix of longer-time and newer AID users, using a mix of systems. Control-IQ (4) and 670G (2) users were interviewed; as well as (1) a CamAPS FX user since it was approved in the UK during the time of the study.

Based on the interviews, I coded their feedback for each of the different themes of the study depending on whether they saw improvements (or did not have issues); had no changes but were satisfied, or neutral experiences; or saw negative impact/experience. For each participant, I reviewed their experience and what they were happy with or frustrated by.

Here are some of the details for each participant.

AID-IRL-Participant1-DanaMLewisAID-IRL-Participant1-cont_DanaMLewis
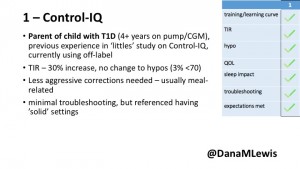
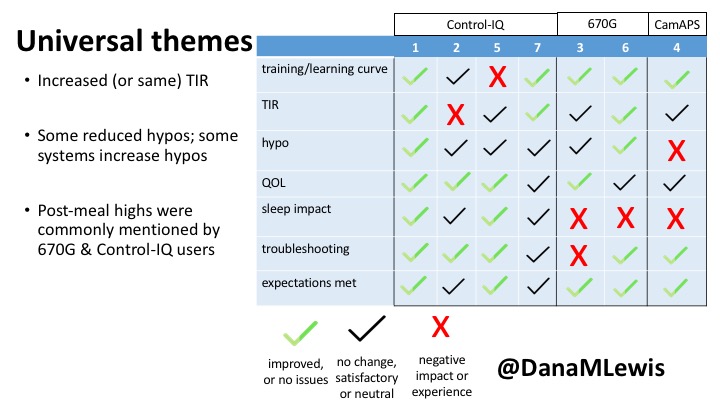
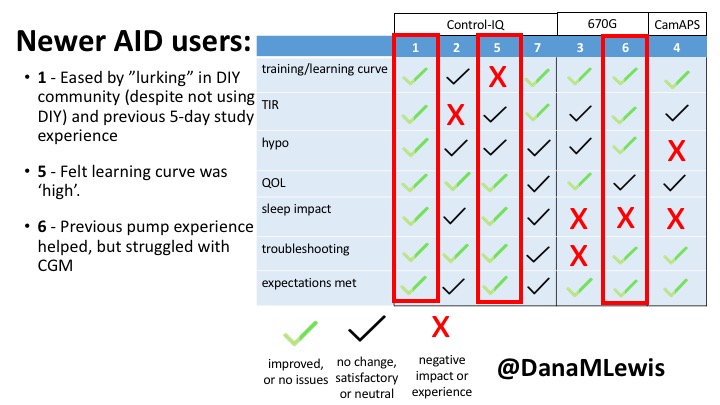
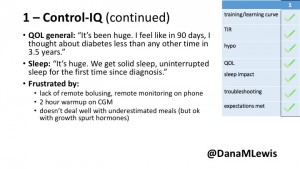
1 – A parent of a child using Control-IQ (off-label), with 30% increase in TIR with no increased hypoglycemia. They spend less time correcting than before; less time thinking about diabetes; and “get solid uninterrupted sleep for the first time since diagnosis”. They wish they had remote bolusing, more system information available in remote monitoring on phones. They miss using the system during the 2 hour CGM warmup, and found the system dealt well with growth spurt hormones but not as well with underestimated meals.

AID-IRL-Participant2-DanaMLewis AID-IRL-Participant2-cont-DanaMLewis
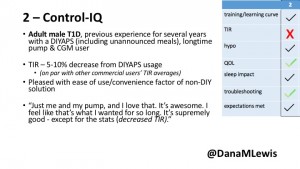
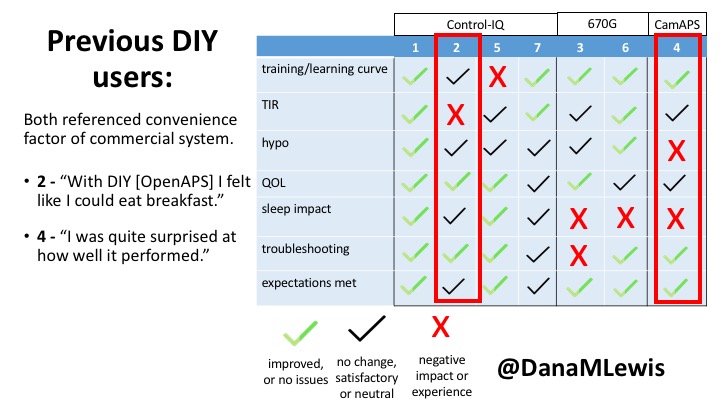
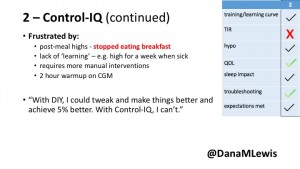
2 – An adult male with T1D who previously used DIYAPS saw 5-10% decrease in TIR (but it’s on par with other participants’ TIR) with Control-IQ, and is very pleased by the all-in-one convenience of his commercial system.He misses autosensitivity (a short-term learning feature of how insulin needs may very from base settings) from DIYAPS and has stopped eating breakfast, since he found it couldn’t manage that well. He is doing more manual corrections than he was before.

AID-IRL-Participant5-DanaMLewis AID-IRL-Participant5-cont_DanaMLewis
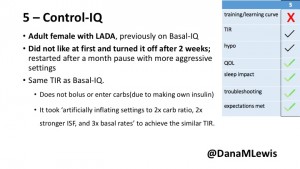
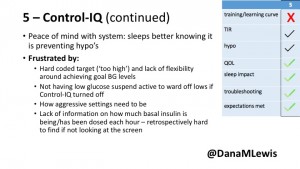
5 – An adult female with LADA started, stopped, and started using Control-IQ, getting the same TIR that she had before on Basal-IQ. It took artificially inflating settings to achieve these similar results. She likes peace of mind to sleep while the system prevents hypoglycemia. She is frustrated by ‘too high’ target; not having low prevention if she disables Control-IQ; and how much she had to inflate settings to achieve her outcomes. It’s hard to know how much insulin the system gives each hour (she still produces some of own insulin).

AID-IRL-Participant7-DanaMLewis AID-IRL-Participant7-cont-DanaMLewis
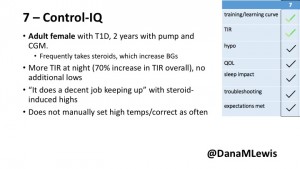
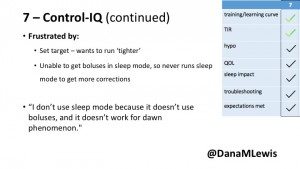
7 – An adult female with T1D who frequently has to take steroids for other reasons, causing increased BGs. With Control-IQ, she sees 70% increase in TIR overall and increased TIR overnight, and found it does a ‘decent job keeping up’ with steroid-induced highs. She also wants to run ‘tighter’ and have an adjustable target, and does not ever run in sleep mode so that she can always get the bolus corrections that are more likely to bring her closer to target.

AID-IRL-Participant3-DanaMLewis AID-IRL-Participant3-cont-DanaMLewis
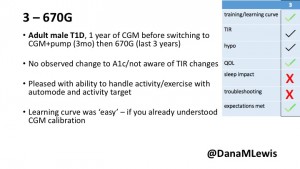
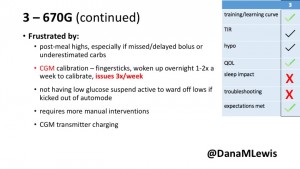
3 – An adult male with T1D using 670G for 3 years didn’t observe any changes to A1c or TIR, but is pleased with his outcomes, especially with the ability to handle his activity levels by using the higher activity target.  He is frustrated by the CGM and is woken up 1-2x a week to calibrate overnight. He wishes he could still have low glucose suspend even if he’s kicked out of automode due to calibration issues. He also commented on post-meal highs and more manual interventions.

AID-IRL-Participant6-DanaMLewis AID-IRL-Participant6-contDanaMLewis
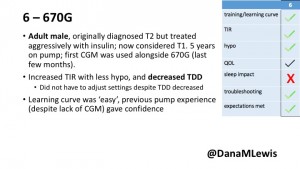
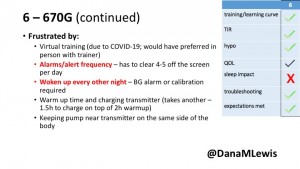
6 – Another adult male user with 670G was originally diagnosed with T2 (now considered T1) with a very high total daily insulin use that was able to decrease significantly when switching to AID. He’s happy with increased TIR and less hypo, plus decreased TDD. Due to #COVID19, he did virtually training but would have preferred in-person. He has 4-5 alerts/day and is woken up every other night due to BG alarms or calibration. He does not like the time it takes to charge CGM transmitter, in addition to sensor warmup.

AID-IRL-Participant4-DanaMLewis AID-IRL-Participant4-contDanaMLewis
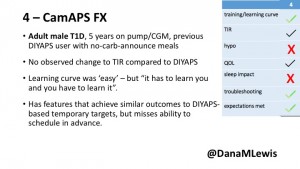
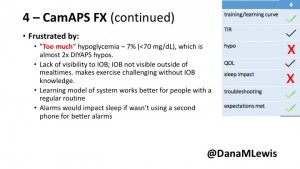
4 – The last participant is an adult male with T1 who previously used DIYAPS but was able to test-drive the CamAPS FX. He saw no TIR change to DIYAPS (which pleased him) and thought the learning curve was easy – but he had to learn the system and let it learn him. He experienced ‘too much’ hypoglycemia (~7% <70mg/dL, 2x his previous), and found it challenging to not have visibility of IOB. He also found the in-app CGM alarms annoying. He noted the system may work better for people with regular routines.
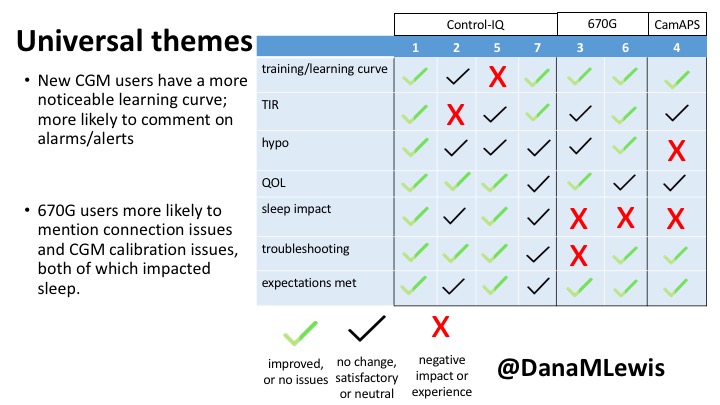
You can see a summary of the participants’ experiences via this chart. Overall, most cited increased or same TIR. Some individuals saw reduced hypos, but a few saw increases. Post-meal highs were commonly mentioned.

AID-IRL-UniversalThemes2-DanaMLewis AID-IRL-UniversalThemes-DanaMLewis

Those newer to CGM have a noticeable learning curve and were more likely to comment on number of alarms and system alerts they saw. The 670G users were more likely to describe connection/troubleshooting issues and CGM calibration issues, both of which impacted sleep.

This view highlights those who more recently adopted AID systems. One noted their learning experience was ‘eased’ by “lurking” in the DIY community, and previously participating in an AID study. One felt the learning curve was high. Another struggled with CGM.

AID-IRL-NewAIDUsers-DanaMLewis

Both previous DIYAPS users who were using commercial AID systems referenced the convenience factor of commercial systems. One DIYAPS saw decreased TIR, and has also altered his behaviors accordingly, while the other saw no change to TIR but had increased hypo’s.

AID-IRL-PreviousDIYUsers-DanaMLewis

Companies building AID systems for PWDs should consider that the onboarding and learning curve may vary for individuals, especially those newer to CGM. Many want better displays of IOB and the ability to adjust targets. Remote bolusing and remote monitoring is highly desired by all, regardless of age. Post-prandial was frequently mentioned as the weak point in glycemic control of commercial AID systems. Even with ‘ideal’ TIR, many commercial users still are doing frequent manual corrections outside of mealtimes. This is an area of improvement for commercial AID to further reduce the burden of managing diabetes.

AID-IRL-FeedbackForCompanies-DanaMLewis

Note – all studies have their limitations. This was a small deep-dive study that is not necessarily representative, due to the design and small sample size. Timing of system availability influenced the ability to have new/longer time users.

AID-IRL-Limitations-DanaMLewis

Thank you to all of the participants of the study for sharing their feedback about their experiences with AID-IRL!

(You can download a PDF of my slides from the AID-IRL study here.)

Have questions about any of my posters or presentations? You can always reach me via email at Dana@OpenAPS.org.

Convening The Center

(Update: see the latest about Convening the Center in 2021 here)

Patients and care partners who want to make a difference in health care are advised to give up our day jobs, create non-profits, or change previously identified career paths to “go work for a healthcare organization.” These formal constructs are not the only ways to achieve change or make a difference.

Those who choose to work outside of traditional pathways often end up with fewer resources and fewer opportunities (not just financial, but also the opportunity of collaborations and connections).

Thinking about these gaps in resources and opportunities has been swimming around my head since the Convening we hosted as part of the Opening Pathways project (more about it here). As a project, we learned so much from the conversations we had when we were able to just bring people together.

The feedback we received from non-traditional healthcare stakeholders was one of the most surprising results of the Convening. These are people who are not necessarily working professionally in healthcare, but doing a lot of work in the nontraditional spaces. In the year since the Convening we’ve repeatedly heard how valuable it was for this group to come together, in person, to connect with others with a similar drive and passion.

Fast forward to early last year. My friend Liz Salmi (of #BTSM) reached out Alicia Staley (of #BCSM) and me to share about an exciting, random conversation and brainstorm she had with Steve Downs from Robert Wood Johnson Foundation (RWJF).  The idea: What if there was an ‘unconference’ to bring together more of these individuals–those working outside of traditional pathways–to learn and collaborate, without the agenda driven by an existing organization, association, established conference, or company?

This concept sounded great to me! It feels like a next logical step to take with Opening Pathways especially if we pair it with a few structured activities similar to what we did at the Convening to create more equitable participation opportunities for patients and care partners to help people feel comfortable engaging together in person.

When Liz said she didn’t have time to lead this project I volunteered to take it on. Liz and Alicia agreed and expressed their full support.

I put together a proposal in partnership with John Harlow who also worked on Opening Pathways, and was instrumental in designing the original Convening. We submitted a proposal to RWJF, did a few rounds of feedback and discussion about the proposal, waited a bit, and found out right around the new year that the proposal was accepted and had been awarded funding! Yay!

We’re calling this project “Convening The Center.” This both picks up on the name of the previous Convening, and emphasizes the people/patients as the center on which all of health and healthcare should be focused.

Convening The Center: What if there was a gathering for individuals working outside of traditional healthcare pathways?

What this means:

  • We have funding to put together a ~2 day meeting for ~25 individuals who are doing both the possible and the impossible to change and improve healthcare.
  • The funding includes travel (ground transportation, flights), lodging (hotel), food during the event, and an honorarium for the participants’ time.
  • The meeting was originally scheduled to be sometime in 2020 (August or September was goal; COVID-19 disrupted this planning, TBD for new dates but looking at 2021 instead).

Who will be involved:

Convening The Center project team:

  • Dana Lewis (me), Principal Investigator (PI)
  • John Harlow, Co-Principal Investigator (PI)
  • Convening Advisors: Liz Salmi, Alicia Staley, Nick Dawson

Who can participate?:

  • TBD! Here’s why and how:

Why must we convene the Center?

If you’re reading this, you likely have your own story of doing the “impossible” — you’ve faced barriers and obstacles, but have found a way to innovate, overcome, or steer around. There are a LOT of people doing this “work,” whether it’s their professional work, their personal passion, or a necessity driving them to improve things for themselves or a loved one, building and supporting their communities as unfunded labors of love. But we also know that geography, socioeconomic background, and financial resources, among other reasons, commonly leave some of these individuals siloed, or prevent them and their work from reaching its full potential.

We know there is a lack of connectedness among individual innovators, researchers, and advocates who are not employed in the traditional healthcare system. While there have been a handful of attempts to convene patient advocates to share ideas and connect with opportunities and resources, none have been devoted solely to this type of community. Existing attempts have included ad-hoc social media groups and inclusion at existing conferences and meetings. Both face serious limitations.

Social media is limited by one’s ability to stumble across a network, while conferences or meetings—which are traditionally held by legacy institutions—usually include people who are already “in” a network that invites them to such physical events, and are thus already “doing” the work, but these do not do enough to encourage new participants. Additionally, conferences and meetings prioritize the hosting organization’s agenda rather than facilitating the development of non-traditional innovators. Given the limitations of social media and existing conferences, the status quo leads new “doers” to (unknowingly and repeatedly) duplicate the work of others and fail to effectively share knowledge and scale tools that could help others. Overall, there are not a lot of resources for people who do this outside of a professional job.

Therefore, we aim to do something different to identify participants for this meeting.

Rather than just invite the same individuals who have the resources to participate, or have already succeeded somewhat, even in the face of all the existing barriers, we plan to solicit attendees from a mix of health communities, from a range of experiences, with diverse demographics, including those who are newly working in this space, as well as experienced individuals with established credibility.

How will we reach all of these different communities and individuals? This is where we need your help!

We have a two-phase recruitment process to identify potential attendees.

Phase 1 (right now)

  • Fill out this form! 
    • We’d love for you to nominate yourself, if you’re potentially interested in participating.
    • But a crucial part of this is to ALSO nominate someone else – a friend or someone you know who may not otherwise hear about this opportunity.
  • We’d also love for you to help share this form widely and help us reach people in different networks. If you TikTok, post it on TikTok. If you’re on LinkedIn, share it on your LinkedIn or a group. If you’re part of an offline support group, talk about it there. Or reach out and share the link with your advocacy organization and encourage them to nominate other advocates and ‘doers’ that they know.

Nominate someone you know for Convening The Center!
Phase 2 (in a few weeks):

  • Based on the first wave of nominated folks, we’ll work to make sure we’re striking the balance between people who are longer-timers in this space and people who are newly emerging in this type of work.
  • We’ll reach out to a selection of folks identified in phase 1 and ask for a little bit more information to help determine the final cohort of participants for the in-person meeting. (Goal: ~25 participants).

We’ve learned through Opening Pathways and other work in this space that more — and perhaps different — resources are needed for “doers” in healthcare who are not traditionally employed in this space.

We don’t expect the outcome of this project to solve all problems or identify a one-size-fits-all resource. However, we do hope to help manifest a new, more inclusive, and more effective vision for changing the future of healthcare.

The future we seek augments the existing health efforts of legacy institutions by coordinating the work of individual innovators, researchers, and advocates in a more inclusive community of practice. We do not think this will solve all problems around under-representation and the static network of those already “in” and doing this work, but it’s an important step and one we’re happy to be able to take.

FREQUENTLY ASKED QUESTIONS

  • Who is funding this project? How is it being funded? What organization are you partnering with?Robert Wood Johnson Foundation (RWJF) is a great partner, and I’m proud that they’re willing to fund this meeting. Paul Tarini is our project officer at RWJF. While my co-PI is based at an academic institution, we decided to experiment with using a fiscal sponsorship organization to manage the grant. We identified and selected Trailhead Institute, a 501(c)(3) organization that works with a variety of projects and organizations in the public health space. I’ll write more about this in the future, but so far they have been GREAT administrative partners and have been seamless to work with during the application and kickoff of the grant process. Also, we learned from the past Convening that it would be beneficial to directly fund a meeting planner to do logistics work (rather than me), so we included in our budget a meeting planner that is coming from Trailhead to help with administrative and logistics planning for the meeting. Yay!
  • How will you select participants?Our goal is to gain a diverse slate of people, including diversity in socioeconomic background, ethnicity, gender, education, area of healthcare, type of work, how long they have been doing the work, etc. Before finalizing the list of participants we will collect information from potential participants and make sure they’d be interested and available to participate once the date is selected.
  • What are the outputs?We anticipate one primary output from this meeting to be relationships among attendees. After observing the strength and resilience generated for individuals by participating in our Opening Pathways convening, we see relationships as a powerful support for the efforts of healthcare “doers”. By relationships, we do not mean a community of 25. Community building is long-term labor-intensive work. Rather, we hope that some attendees will find common ground and collaborate in various ways after Convening the Center.We do not expect to produce a particular report or website from this work. However, we do expect to write blog posts about our process of developing the meeting, the experience of facilitating the meeting, and the insights derived from conversations at the meeting. We anticipate those insights to be about the wants and needs of healthcare doers, what they wish they had when they started out, what they’d tell their younger selves, and how to refine and scale various healthcare improvement efforts.
  • What about COVID-19?While we have been planning this meeting for August or September 2020, we are aware that currently (in March 2020) there is a lot of uncertainty about how COVID-19 may impact meetings after the next few months. While we are beginning virtual recruitment of participants, we will work with public health officials to get guidance on whether August/September still makes sense, and if not, work with both participants and public health to determine a suitable alternative timeline for holding the meeting. If that’s not feasible, we may find ways to meet this goal virtually.Update: Obviously, it does not make sense to convene the center physically for an in-person meeting in 2020. We are aiming for a gathering – in-person if safe and appropriate, otherwise adapting to virtual – in 2021. We’ll keep everyone posted!

(Update: see the latest about Convening the Center in 2021 here)