PS – check out PERT Pilot, the first app for Exocrine Pancreatic Insufficiency! It’s an app that allows you to record as many meals as you want, the PERT dosing and outcomes, to help you visualize and review more of your PERT dosing data! It’s available on iOS here and on Android here.
—
I’ve had exocrine pancreatic insufficiency (known as EPI or PEI) for a year now. I have had type 1 diabetes for 20+ years and am experienced in adjusting my medication (previously insulin) in response to everything that I eat or drink.
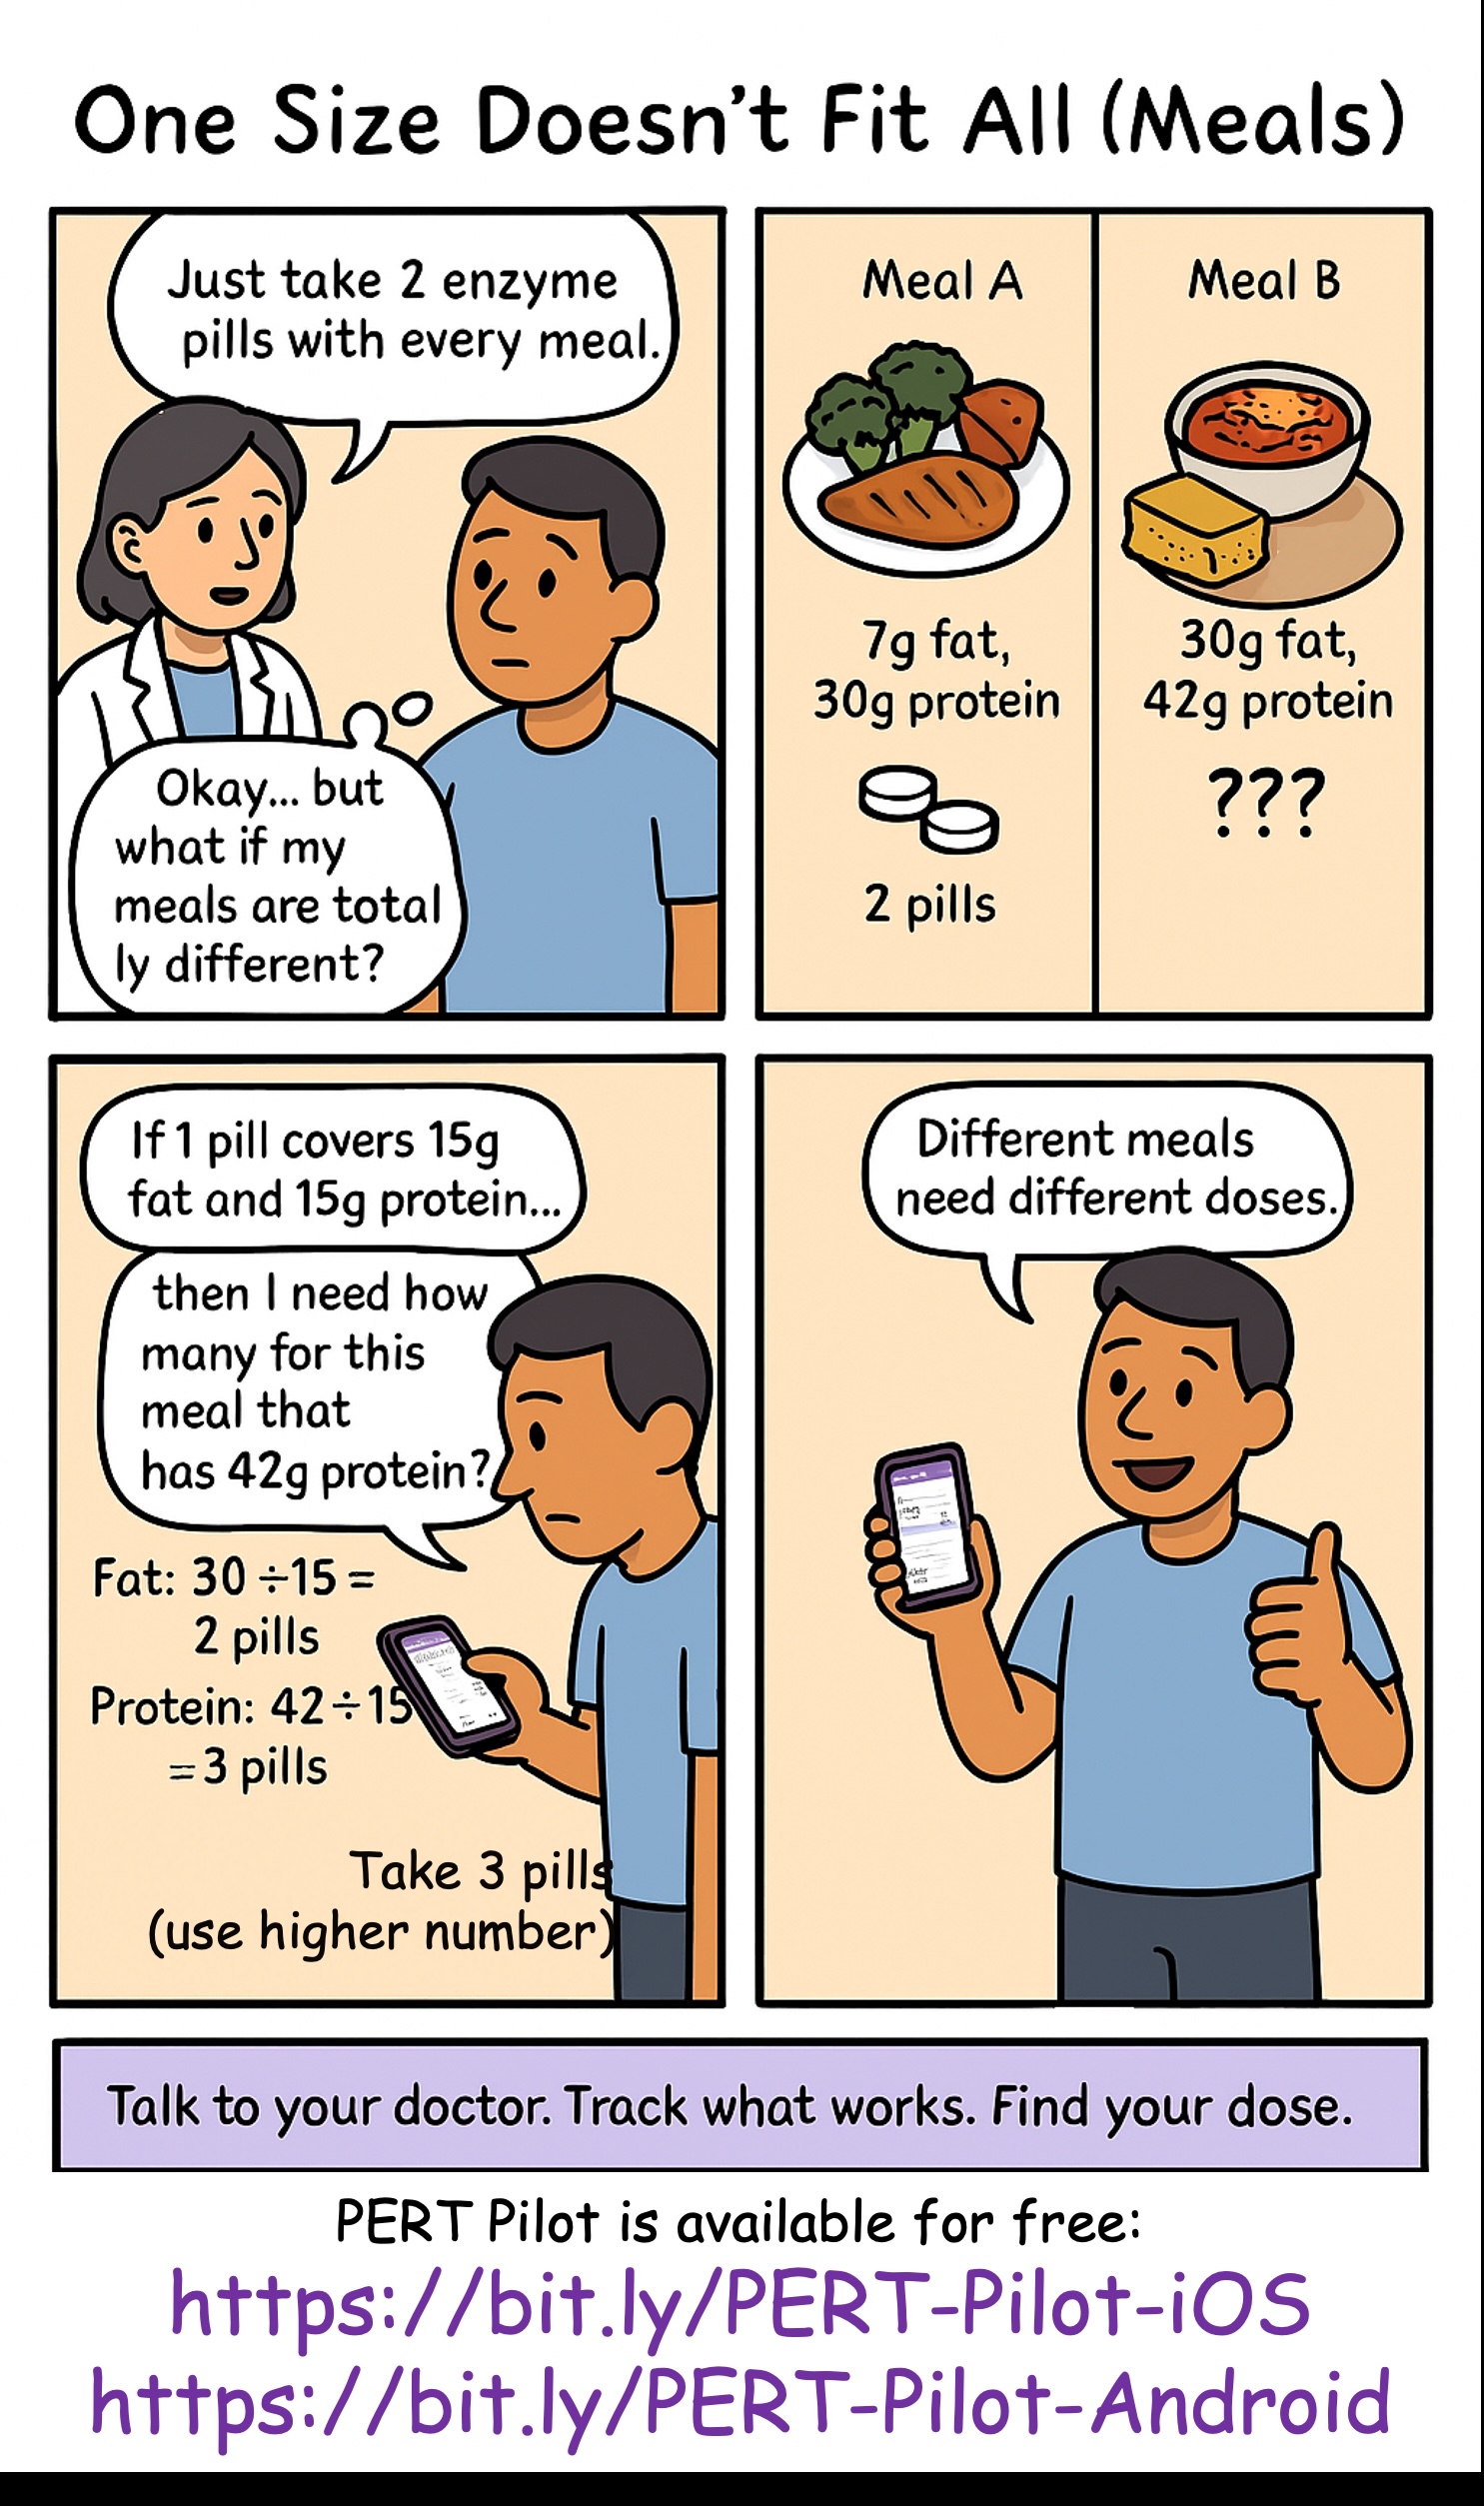
With EPI, though, most people are given a static prescription, such as one saying “take 3 pills with each meal”.
Well, what if every meal is not the same size?
Let’s think about a couple of hypothetical meals.
Meal A: Baked chicken, sweet potato, and broccoli. This meal likely results in ~31 grams of carbohydrates; 7 grams of fat; and ~30 grams of protein.
How would you dose for this meal? Most people do what they are told and dose based on the fat content of the meal. If they typically take 3 pills, they may take all 3 pills or take fewer pills if this is less fat than their typical meal.
Many people post in EPI social media groups post about restaurant dinners that sound like this complaining about side effects they experience with this type of meal. The commonly mentioned theory is that maybe the chicken is cooked in oil. However, the entire meal is so low in fat compared to other meals that it is unlikely to be the fat content causing symptoms if the typical meal dose of PERT is used, even if the chicken is cooked in oil.
Let’s discuss another meal.
Meal B: A bowl of chili topped with cheddar cheese and a piece of cornbread.
This meal results in ~45 grams of carbs; ~30 grams of fat; and ~42 grams of protein.
—
The fat content between these two meals is quite a bit different (7 grams of fat versus 30 grams of fat). Yet, again, most people are told simply to dose by the amount of fat, so someone might take a lower dose for the chicken meal because it has so little fat relative to other meals.
This could result in symptoms, though. The pancreas actually produces THREE kinds of enzymes. That’s why pancreatic enzyme replacement therapy medicine, called pancrelipase as a common name, has THREE types of enzymes: lipase, to help digest fat; protease, to help digest protein; and amylase, to help digest carbohydrates. A typical PERT pill has different amounts of these three enzymes, although it is usually described by the size/quantity of lipase it has – yet the other enzymes still play an important role in digestion.
I’ve observed that it’s pretty common for people to completely ignore the protein in what they’re eating. But as I mentioned, that seems to be the most obvious thing to try dosing for if “low fat” meals are causing issues. (It could also be sensitivity to carbohydrates, but the above example meal is fairly low carbohydrate.) My personal experience has also been that I am sensitive to fat and protein, and dose my meals based on these macronutrients, but other than eating fruit on an empty stomach (when I would add PERT/enzyme, despite the zero fat and protein in it), I don’t need to dose based on carbohydrates.
But I do need to dose for BOTH fat AND protein in what I’m eating. And I have a theory that a lot of other people with EPI do, too.
So how do you do this?
How do you dose for meals of different sizes, and take into account both fat and protein for these varying meals?
First, you need to figure out what dosing “works” for you.
Most people begin experimenting and find a quantity of food that they can eat with the dose that they typically take. This meal size is going to vary person to person; it’ll also vary based on what it is in the meal they’re eating (such as chicken vs chili, from the above examples).
Once you find a dose that “works” and try it out a few times on the same meal, you can use this to determine what your dosing should be.
How?
Let’s use two examples with different dose sizes and types of PERT.
(PS – did you know there are 6 FDA-approved PERT brands in the US? Sometimes one works for someone where a different brand does not. If you’re struggling with the first type of PERT you’ve been prescribed, and you’ve already ruled out that you’re dosing correctly (see below), make sure to talk to your doctor and ask about trying a different brand.)
First, you can calculate the ratios of lipase needed per gram of fat.
Let’s say the meal that “works” with your typical dose is 30 grams of fat. If 30 grams of fat is fine on your current dose, I would eat another meal with a slightly higher amount of fat (such as 35 or 40 grams of fat). When you get to an amount that “doesn’t work” – meaning you get symptoms – then you go back to the dose that does “work” to use in the math.
If the meal that “worked” was 30 grams of fat I would do the following math for each of these two examples:
—
Example A: You need 1 pill of Zenpep 25,000 to cover this meal
Example B: You need 3 pills of Creon 36,000 to cover this meal
—
Example A: 1 pill of Zenpep 25,000 is 1 multiplied by 25,000, or 25,000 units of lipase. Take that (25,000) and divide it by the grams of fat in the meal that works (30 grams). This would be 25,000/30 = 833. This means you need 833 units of lipase to “cover” 1 gram of fat. You can round up to ~1000 units of lipase to make it easier; your ratio would be 1000 units of lipase for every 1 gram of fat.
Example B: 3 pills of Creon 36,000 is 3 multiplied by 36,000, which is 108,000 units of lipase. Take that number (108,000) and divide it by the grams of fat in the meal that works (30 grams). This would be 108,000/30 = 3,600. This means you need 3,600 units of lipase to “cover” 1 gram of fat.
The next time you wanted to eat a meal, you would look at the grams of fat in a meal.
Let’s say you’re going to eat two bowls of chili and two pieces of cornbread. Let’s assume that is about 64 grams of fat. (Two bowls of chili and two cornbread is 30×2=60, plus a bit of butter for the cornbread so we’re calling it 64 grams of fat).
Example A: Take the meal and multiply it by your ratio. 64 (grams of fat) x 1,000 (how many units of lipase you need to cover 1 grant of fat) = 64,000. A Zenpep 25,000 has 25,000 lipase. Since you need 64,000 (units of lipase needed to cover the meal), you would divide it by your pill/dose size of 25,000. 64,000 divided by 25,000 is 2.56. That means for these ratios and a prescription of Zenpep 25,000 pill size, you need *3* Zenpep 25,000 to cover a meal of 64g of fat. (Remember, you can’t cut a PERT, so you have to round up to the next pill size.)
Example B: Take the meal and multiply it by your ratio. 64 (grams of fat) times 3,600 (how many units of lipase you need to cover 1 grant of fat) = 230,400. A Creon 36,000 has 36,000 lipase. Since you need 230,400 units of lipase to cover the meal, you would divide it by your pill/dose size of 36,000. 230,400 divided by 36,000 is 6.4. This means you need *7* Creon 36,000 to cover a meal of 64g of fat. (Again, you can’t cut a PERT, so you have to round up to 7 from 6.4.)
Another way to think about this and make it easier in the future is to determine how much one pill “covers”.
Example A: A Zenpep 25,000 “covers” 25 grams of fat if my ratio is 1000 units of lipase for every gram of fat (25,000/1000=25).
So if a meal is under 25g of fat? 1 pill. A meal under 50g (25×2)? 2 pills. 75g (25×3)? 3 pills. And so on. Once you know what a pill “covers”, it’s a little easier; you can simply assess whether a meal is above/below your pill size of 1 (25g), 2 (50g), 3 (75g) etc.
Round up if it’s in between, because you can’t divide a pill.
Example B: A Creon 36,000 “covers” 10 grams of fat if my ratio is 3,600 units of lipase for every gram of fat (36,000/3600=10).
So if a meal is under 10 grams of fat? 1 pill. 20 grams of fat is 2 pills (10×2); 30 grams of fat is 3 pills (10×3); etc.
—
When people with EPI share experiences online, they often describe their dose size (such as 1 x 25,000 or 3 x 36,000 like examples A and B above) for most meals, but the meal size and composition is rarely discussed.
Personally, I can eat pretty widely varying amounts of fat in each meal on a day to day basis.
That’s why, instead of a flat dosing that works for everything (because I would be taking a LOT of pills at every meal if I was trying to take enough to cover my highest fat meals every time), I have found it to be more effective to estimate each meal to determine my meal dosing.
Remember that meal estimates aren’t very precise. If you use a nutrition panel on a box serving, the serving size can vary a bit. Restaurants (especially chains) have nutrition information, but the serving size can vary. So recognize that if you are calculating or estimating 59 grams of fat and that means either 2 vs 3 pills or 6 vs 7 pills, that you should use your judgment on whether you want to round up to the next pill number – or not.
Let’s put the hypothetical meals side by side and compare dosing with examples A and B from above:
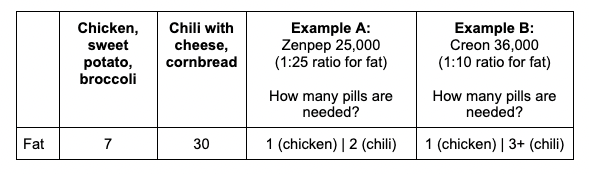
Using the previous meal examples with either 7 or 30 grams of fat:
- With Example A (ratio of 25g of fat for every 1 pill, or 1000 units of lipase to cover 1 gram of fat), we would need 1 pill for the chicken meal and 2 for the chili meal. Why? The chili is >25 grams of fat which means we need to round up to 2 pills.
- With Example B (ratio of 10 grams of fat for every 1 pill or 3600 units of lipase to cover 1 gram of fat), we would need 1 pill to cover the chicken (because it’s less than 10 grams of fat) and 3 – or more – pills for the chili. Why “or more”? Well, something like chili is likely to be imprecisely counted – and if you’re like me, you’d want a bit of extra cheese, so chances are I would round up to a 4th pill here to take in the imprecision of the measurements of the ingredients.
–
PERT Dosing for Protein
Wait, didn’t you say something about protein?
Yes, I did. Fat isn’t the only determinant in this math!
I do the same type of math with grams of protein and units of protease. (Remember, PERT has all 3 types of enzymes, even though it is labeled by the amount of lipase. You can look online or on the bottle label to see how much protease is in your PERT.)
For our examples, Zenpep 25,000 contains 85,000 units of protease. Creon 36,000 contains 114,000 units of protease.
For the meal that ‘worked’ of 30 grams of fat, we also want to know the protein that worked. For easy math, let’s also say 30 grams of protein is in this meal.
Following the same math as before:
Example A (Zenpep 25,000): 30 grams of protein divided by 1×85,000 units of protease is ~2,833 units of protease to every 1 gram of protein. Again, I like to think about how much 1 pill “covers” protein-wise. In this case, 1 Zenpep 25,000 “covers” 30 grams of protein.
Example B (Creon 36,000): 30 grams of protein divided into 3 x 114,000 units of protease is 11,400 units of protease per gram of protein. Again, I like to think about how much 1 pill “covers” protein-wise as well. In this case, 1 Creon 36,000 “covers” 10 grams of protein.
Here’s how many pills are needed for protein:
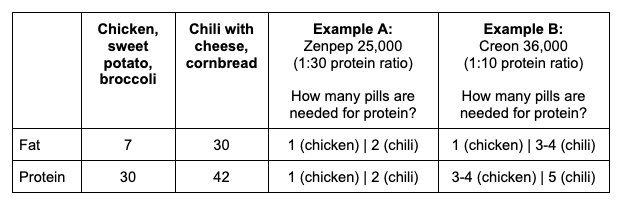
- With Example A (ratio of 30g of protein for every 1 pill), we would need 1 pill for the chicken meal and 2 for the chili meal. Why? The chili is 42, which is greater than (30×1) grams of protein which means we need to round up to 2 pills.
- With Example B (ratio of 10 grams of protein for every 1 pill), we would need 3 or more pills to cover the chicken. Why 3 or more? Again, it’s on the top edge of what 3 pills would cover, so I’d be likely to round up to 4 pills here. For the chili, 5 pills are needed (42 is more than 4 x 10 and is less than 5 x 10).
So how do you decide the number of pills to take for these meals? Let’s go back to our two example meals and compare the amount needed, pill-wise, for both fat and protein for each meal and each example.
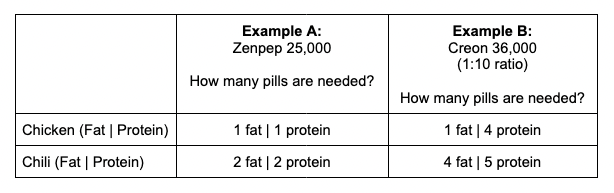
When the pill numbers MATCH (e.g. the same number needed for fat and protein), which is the case for both examples with Zenpep 25,000, it’s easy: take that number of pills total! For Zenpep 25,000, I would take 1 pill for the Chicken (1 fat | 1 protein); and I would take 2 pills for the Chili (2 fat | 2 protein). Remember that PERT pills contain all three enzymes, so the fat and protein are sufficiently *each* covered by the quantities of lipase and protease in this pill type.
When the pill numbers are DIFFERENT between your fat and protein estimates, you use the LARGER number of pills. For Creon 36,000, with the chicken meal the protein quantity is much larger than the fat quantity; I would in this case dose 4 total pills (1 fat | 4 protein), which would then cover the protein in this meal and would also sufficiently cover the amount of fat in this meal. For the chili meal, it is closer: I estimated needing 4 pills for fat and 5 for protein; in this case, I would take 5 total pills which would then successfully cover the protein and the fat in the meal.
If you find the math challenging to do, don’t worry: once you determine your ratios and figure out how much one pill “covers”, it gets a lot easier.
And I made a few tools to help you!
Check out this free enzyme calculator which does the math to determine the ratios on exactly how much one pill “covers” for your successful meal.
(The calculator is for entering one meal at a time, and doesn’t save them, but if you’d like AI to estimate what is in your meal and help you log and save multiple meals, check out PERT Pilot if you have an iPhone or an Android phone.)
Here’s what it looks like using the two examples above:
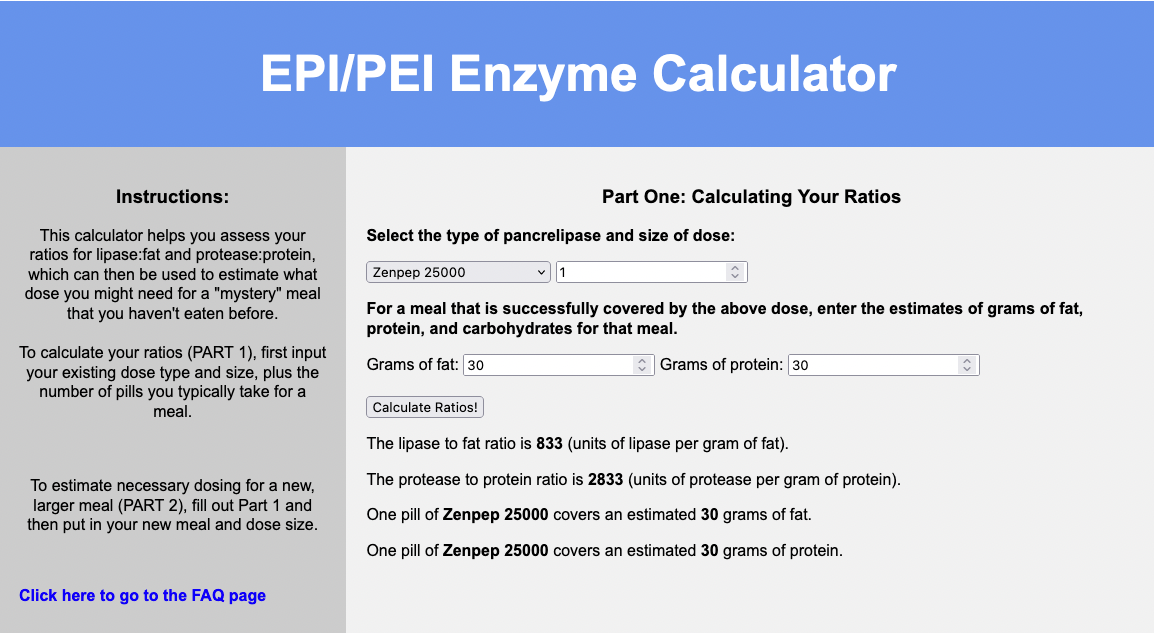

You can input your meal that “works”, what your dose is that “works” (the number of pills and pill type), and it will share what your ratios are and what one pill “covers”.
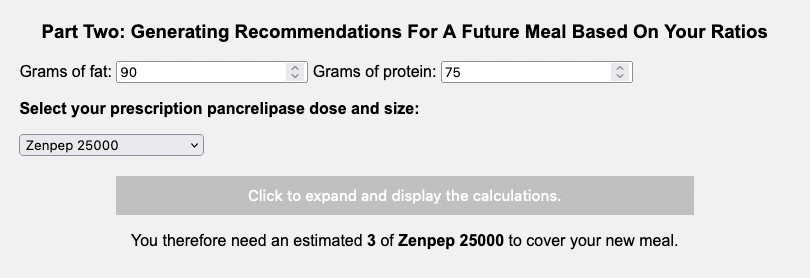
You can also use the second part of the calculator to estimate the amount you need for a future meal! Say it’s coming up on a holiday and you’re going to eat a much larger meal than you normally do.
You can input into the calculator that you’ll be eating 90 grams of fat and 75 grams of protein.
Here’s the example with our dose from Example A (Zenpep 25,000):
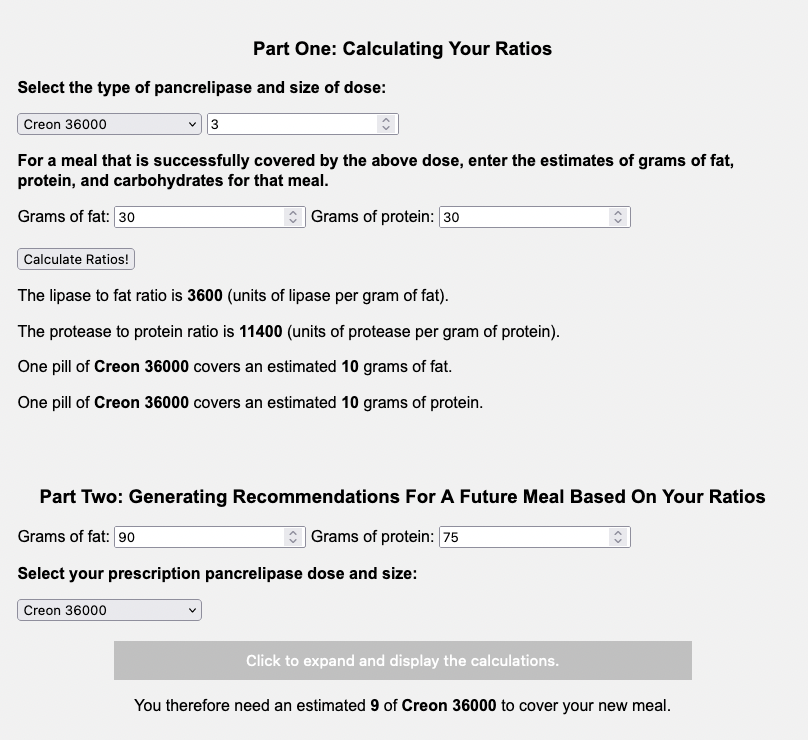
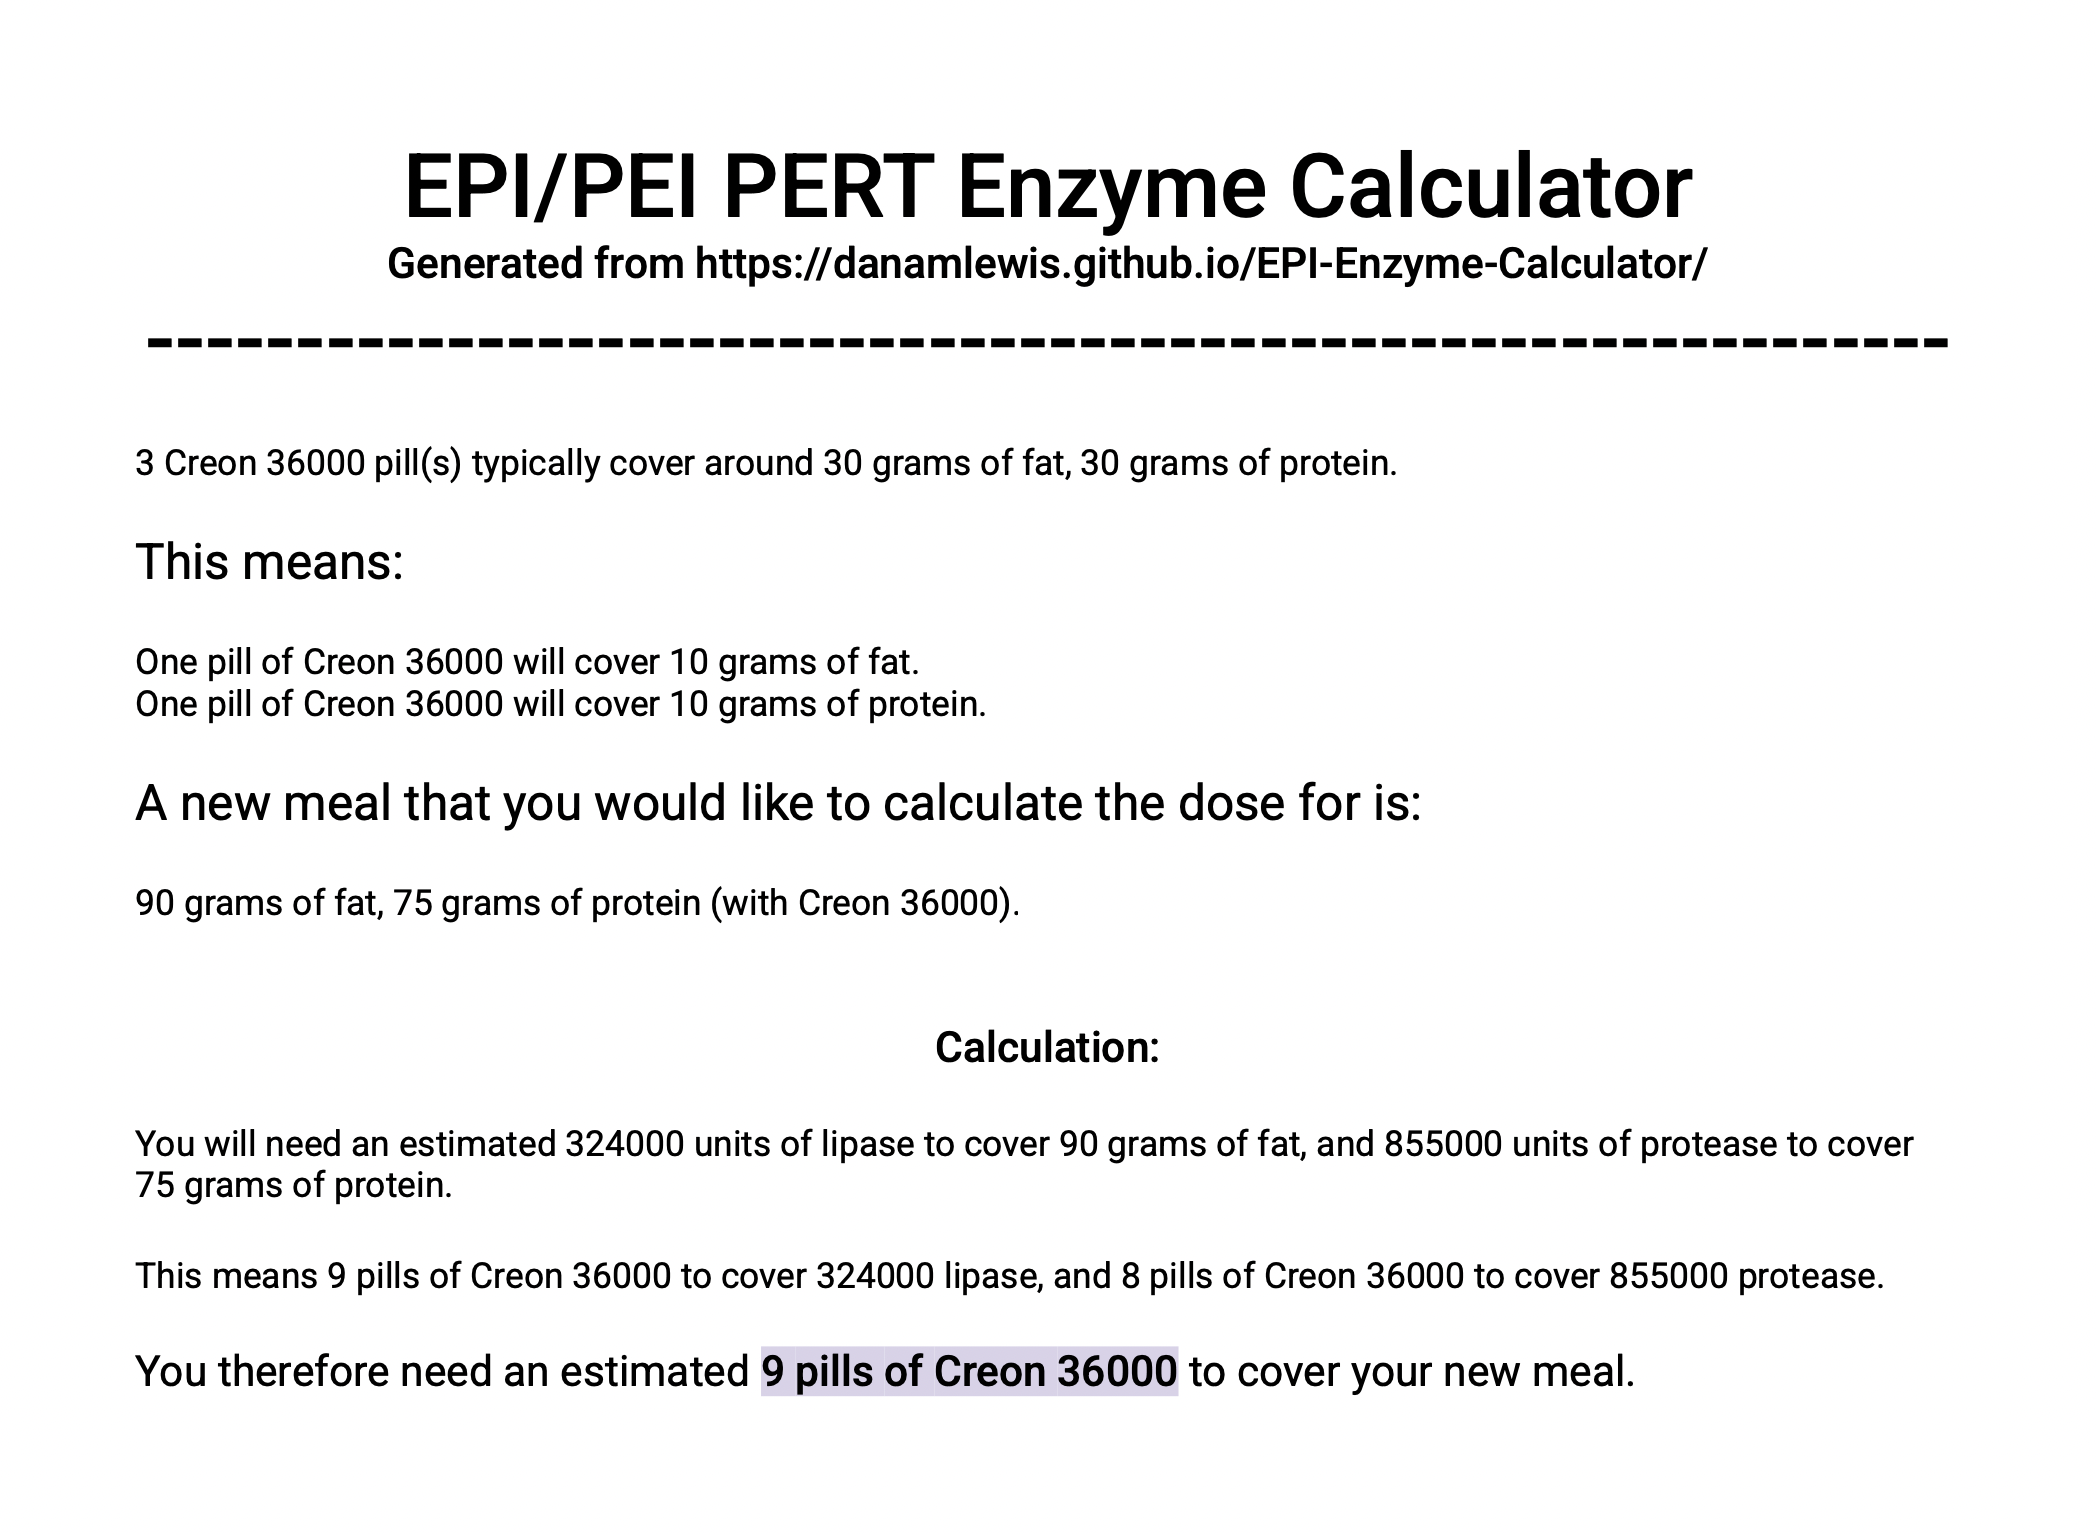
Here’s the example large meal with our dose from Example B (Creon 36,000):
You can also hit the button to expand the calculations to see the math it is doing, and how it compares between the fat and protein pill estimates to see what “drives” the total number of pills needed.
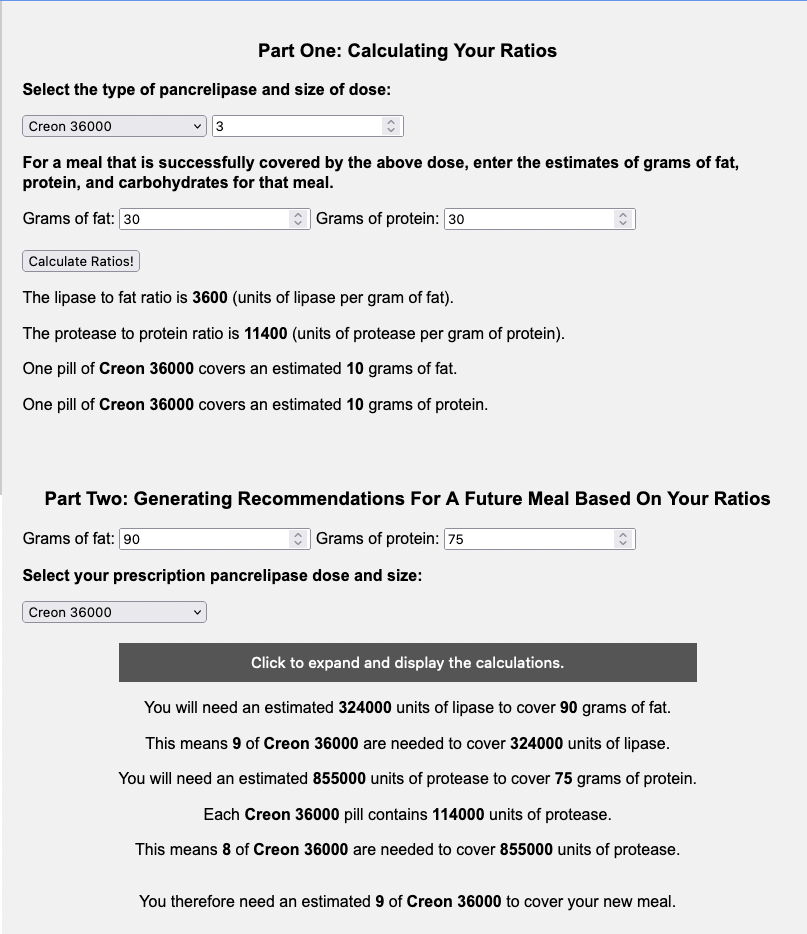
You can even download a PDF with this math to have on hand. Here’s what the PDF download looks like for Example B (Creon 36,000):
–
Switching dose sizes or PERT brand types
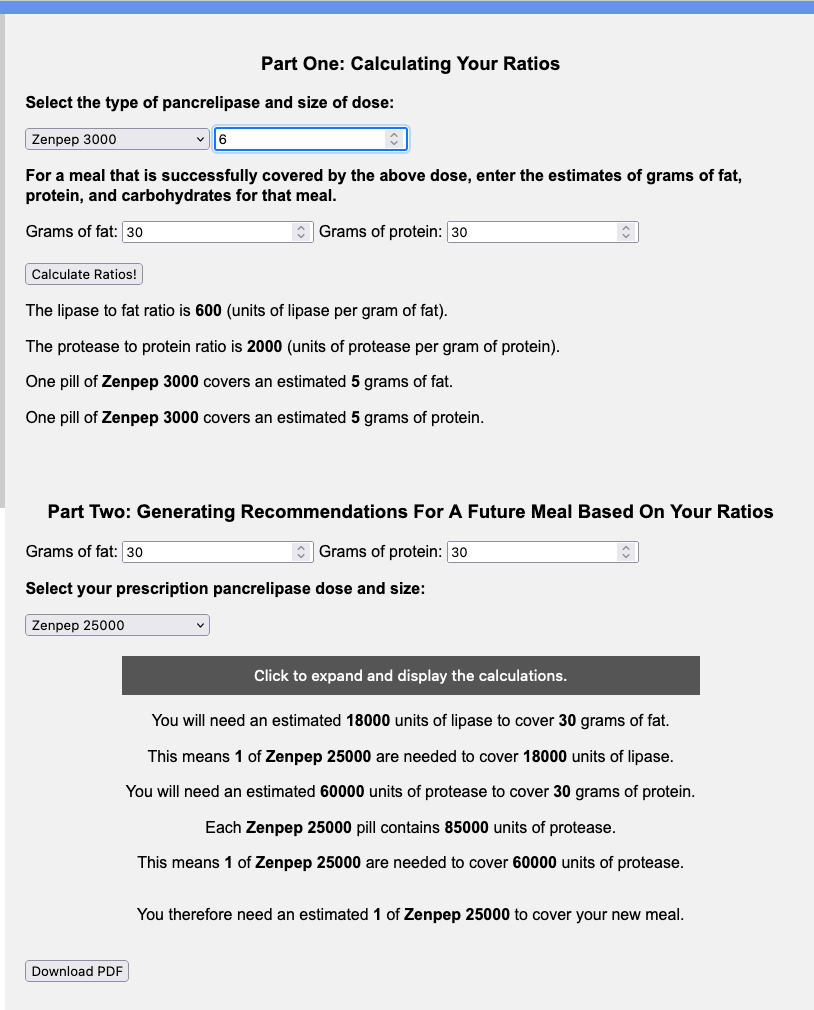
This calculator can also be useful if you were originally prescribed a smaller quantity of PERT (e.g. Creon 3000 or Zenpep 3000) and you find yourself taking many numbers of these pills (6 or more) to cover a small meal for you, let alone more pills for a larger meal.
You can input this into the calculator and get your ratios; then in the second part, identify a different pill size, to see how many numbers of pills you’d take on a different dose.
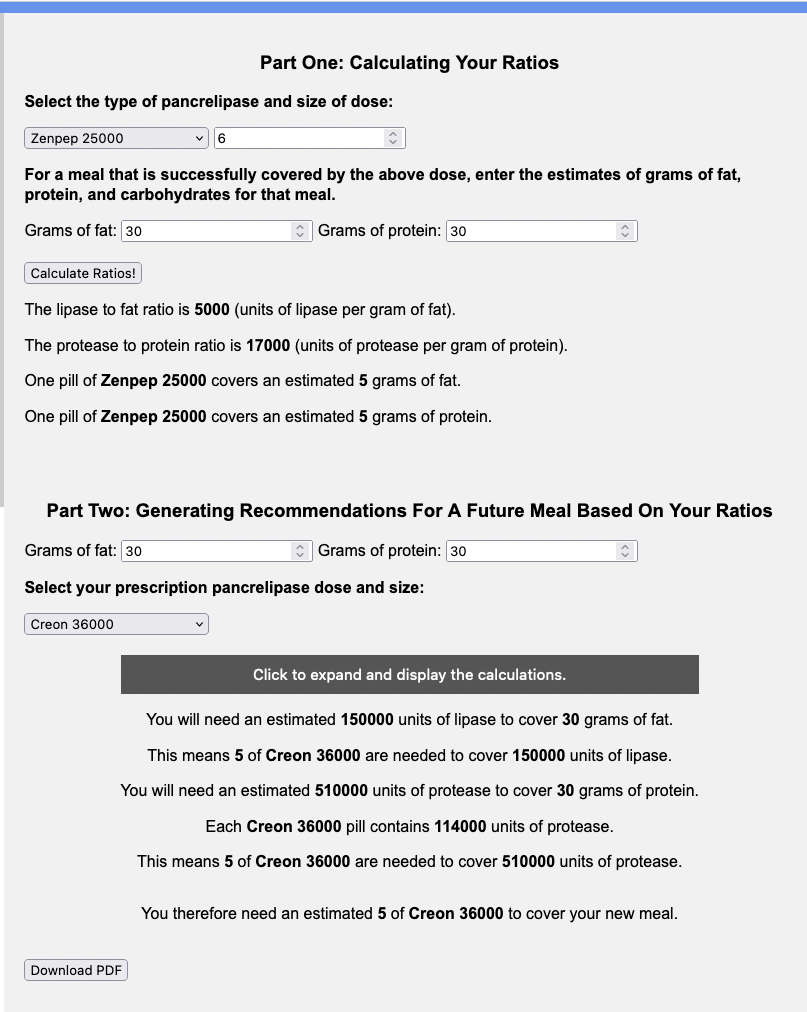
You can also use it to help you understand how much you might need if you are switching between brands. Let’s say you were prescribed Zenpep 25,000 and you need to try Creon, either because you don’t think Zenpep works well for you or your insurance is more willing to cover the Creon brand.
You would use the top part of the calculator with your current brand and size (e.g. Zenpep 25,000 of which you take 6 for a standard meal of 30 grams of fat and 30 grams of protein) and then input the new brand and size and the same size meal (e.g. Creon 36,000 and another 30 grams of fat and 30 grams of protein meal) to see that you’d likely need 5 Creon 36,000 to match the 6 Zenpep 25,000 you were taking for a standard size (30 gram of fat and 30 gram of protein) meal.
Note: I’m not suggesting 30 grams of fat and protein at each meal is “standard” or the “right” size of the meal – I picked arbitrary numbers here to illustrate these examples, so make sure to include the meal that your PERT dosing successfully covers for YOU!
–
As a reminder, I’m not a doctor – I’m a person living with EPI. None of this is medical advice. I use this math and this calculator for my own personal use and share it in case it’s helpful to others. If you have questions, please do talk to your doctor. If you’re still experiencing symptoms with your enzyme dosing, you definitely should talk with your doctor. Your prescription size might need updating compared to what you were originally prescribed.
Also, please note that the calculator is open source; you can find the code here, and I welcome contributions (pull requests) and suggestions! You can leave feedback on Github or share feedback in this form. For example, if you’re using a different type of enzyme not listed in the calculator (currently 2/6 of the US FDA-approved versions are listed), please let me know and I can work to add the relevant list.
—
PS – You can find my other posts about EPI at DIYPS.org/EPI, and you can also check out PERT Pilot, the first app for Exocrine Pancreatic Insufficiency! It’s an app that allows you to record as many meals as you want, the PERT dosing and outcomes, to help you visualize and review more of your PERT dosing data. You can get it for iOS here and for Android here.
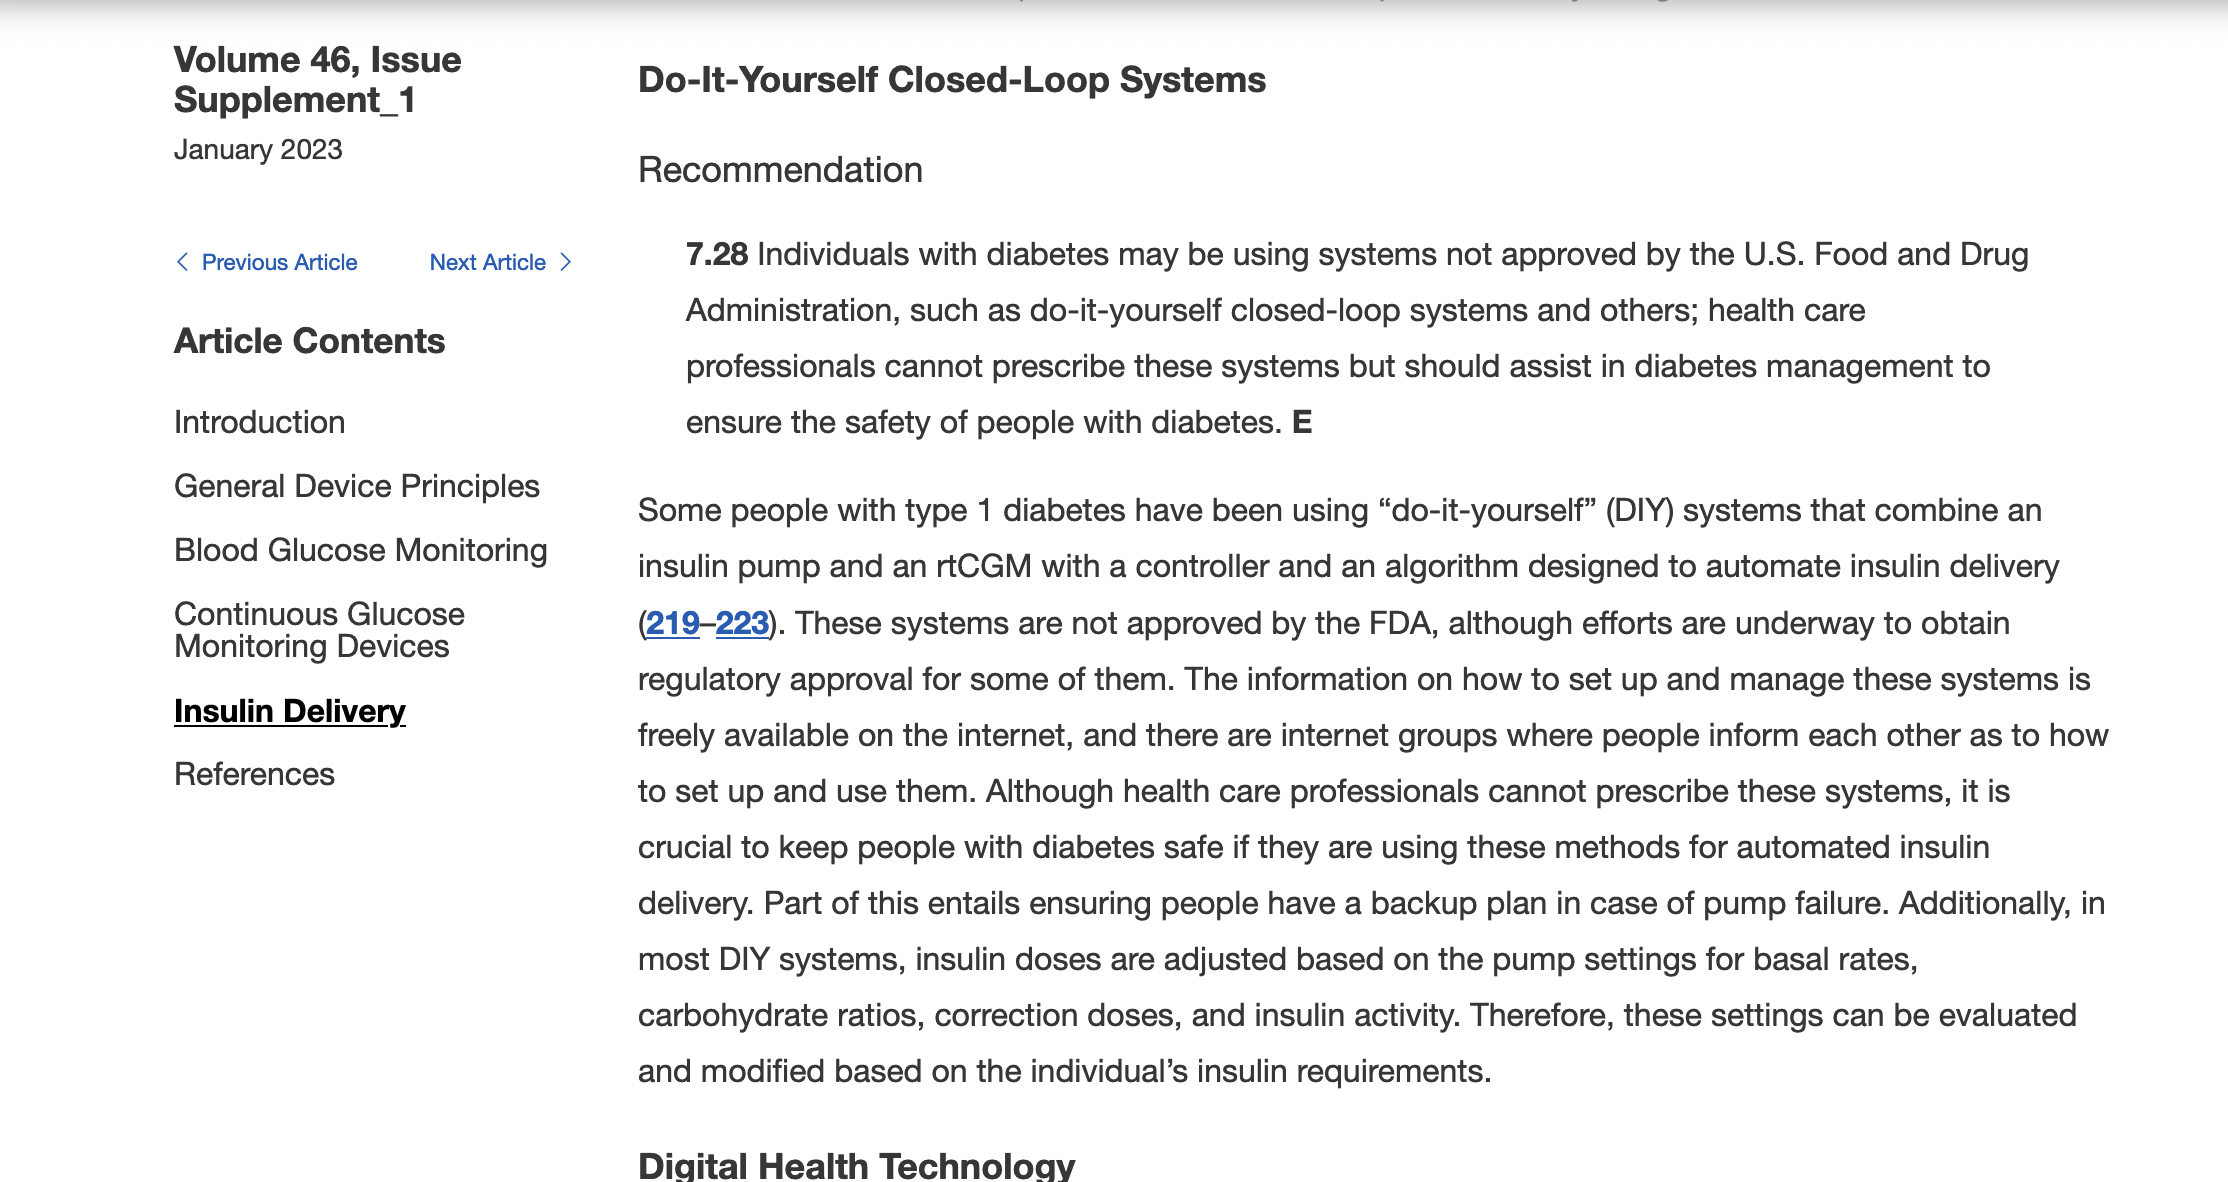


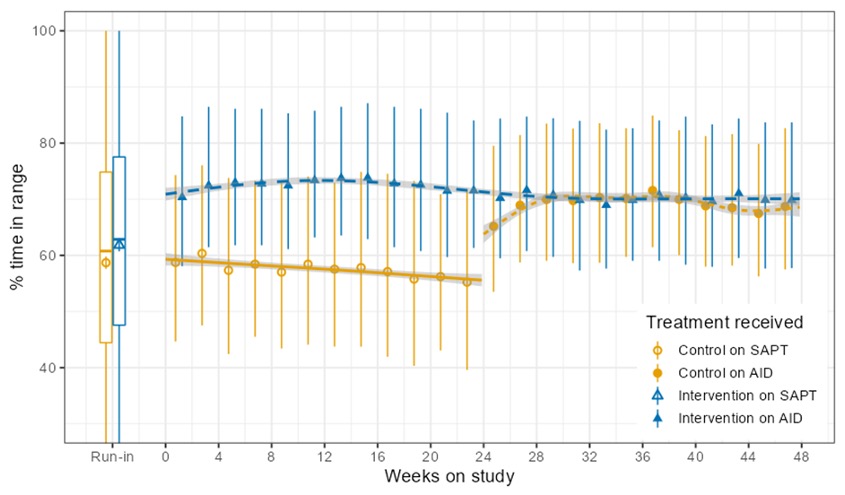
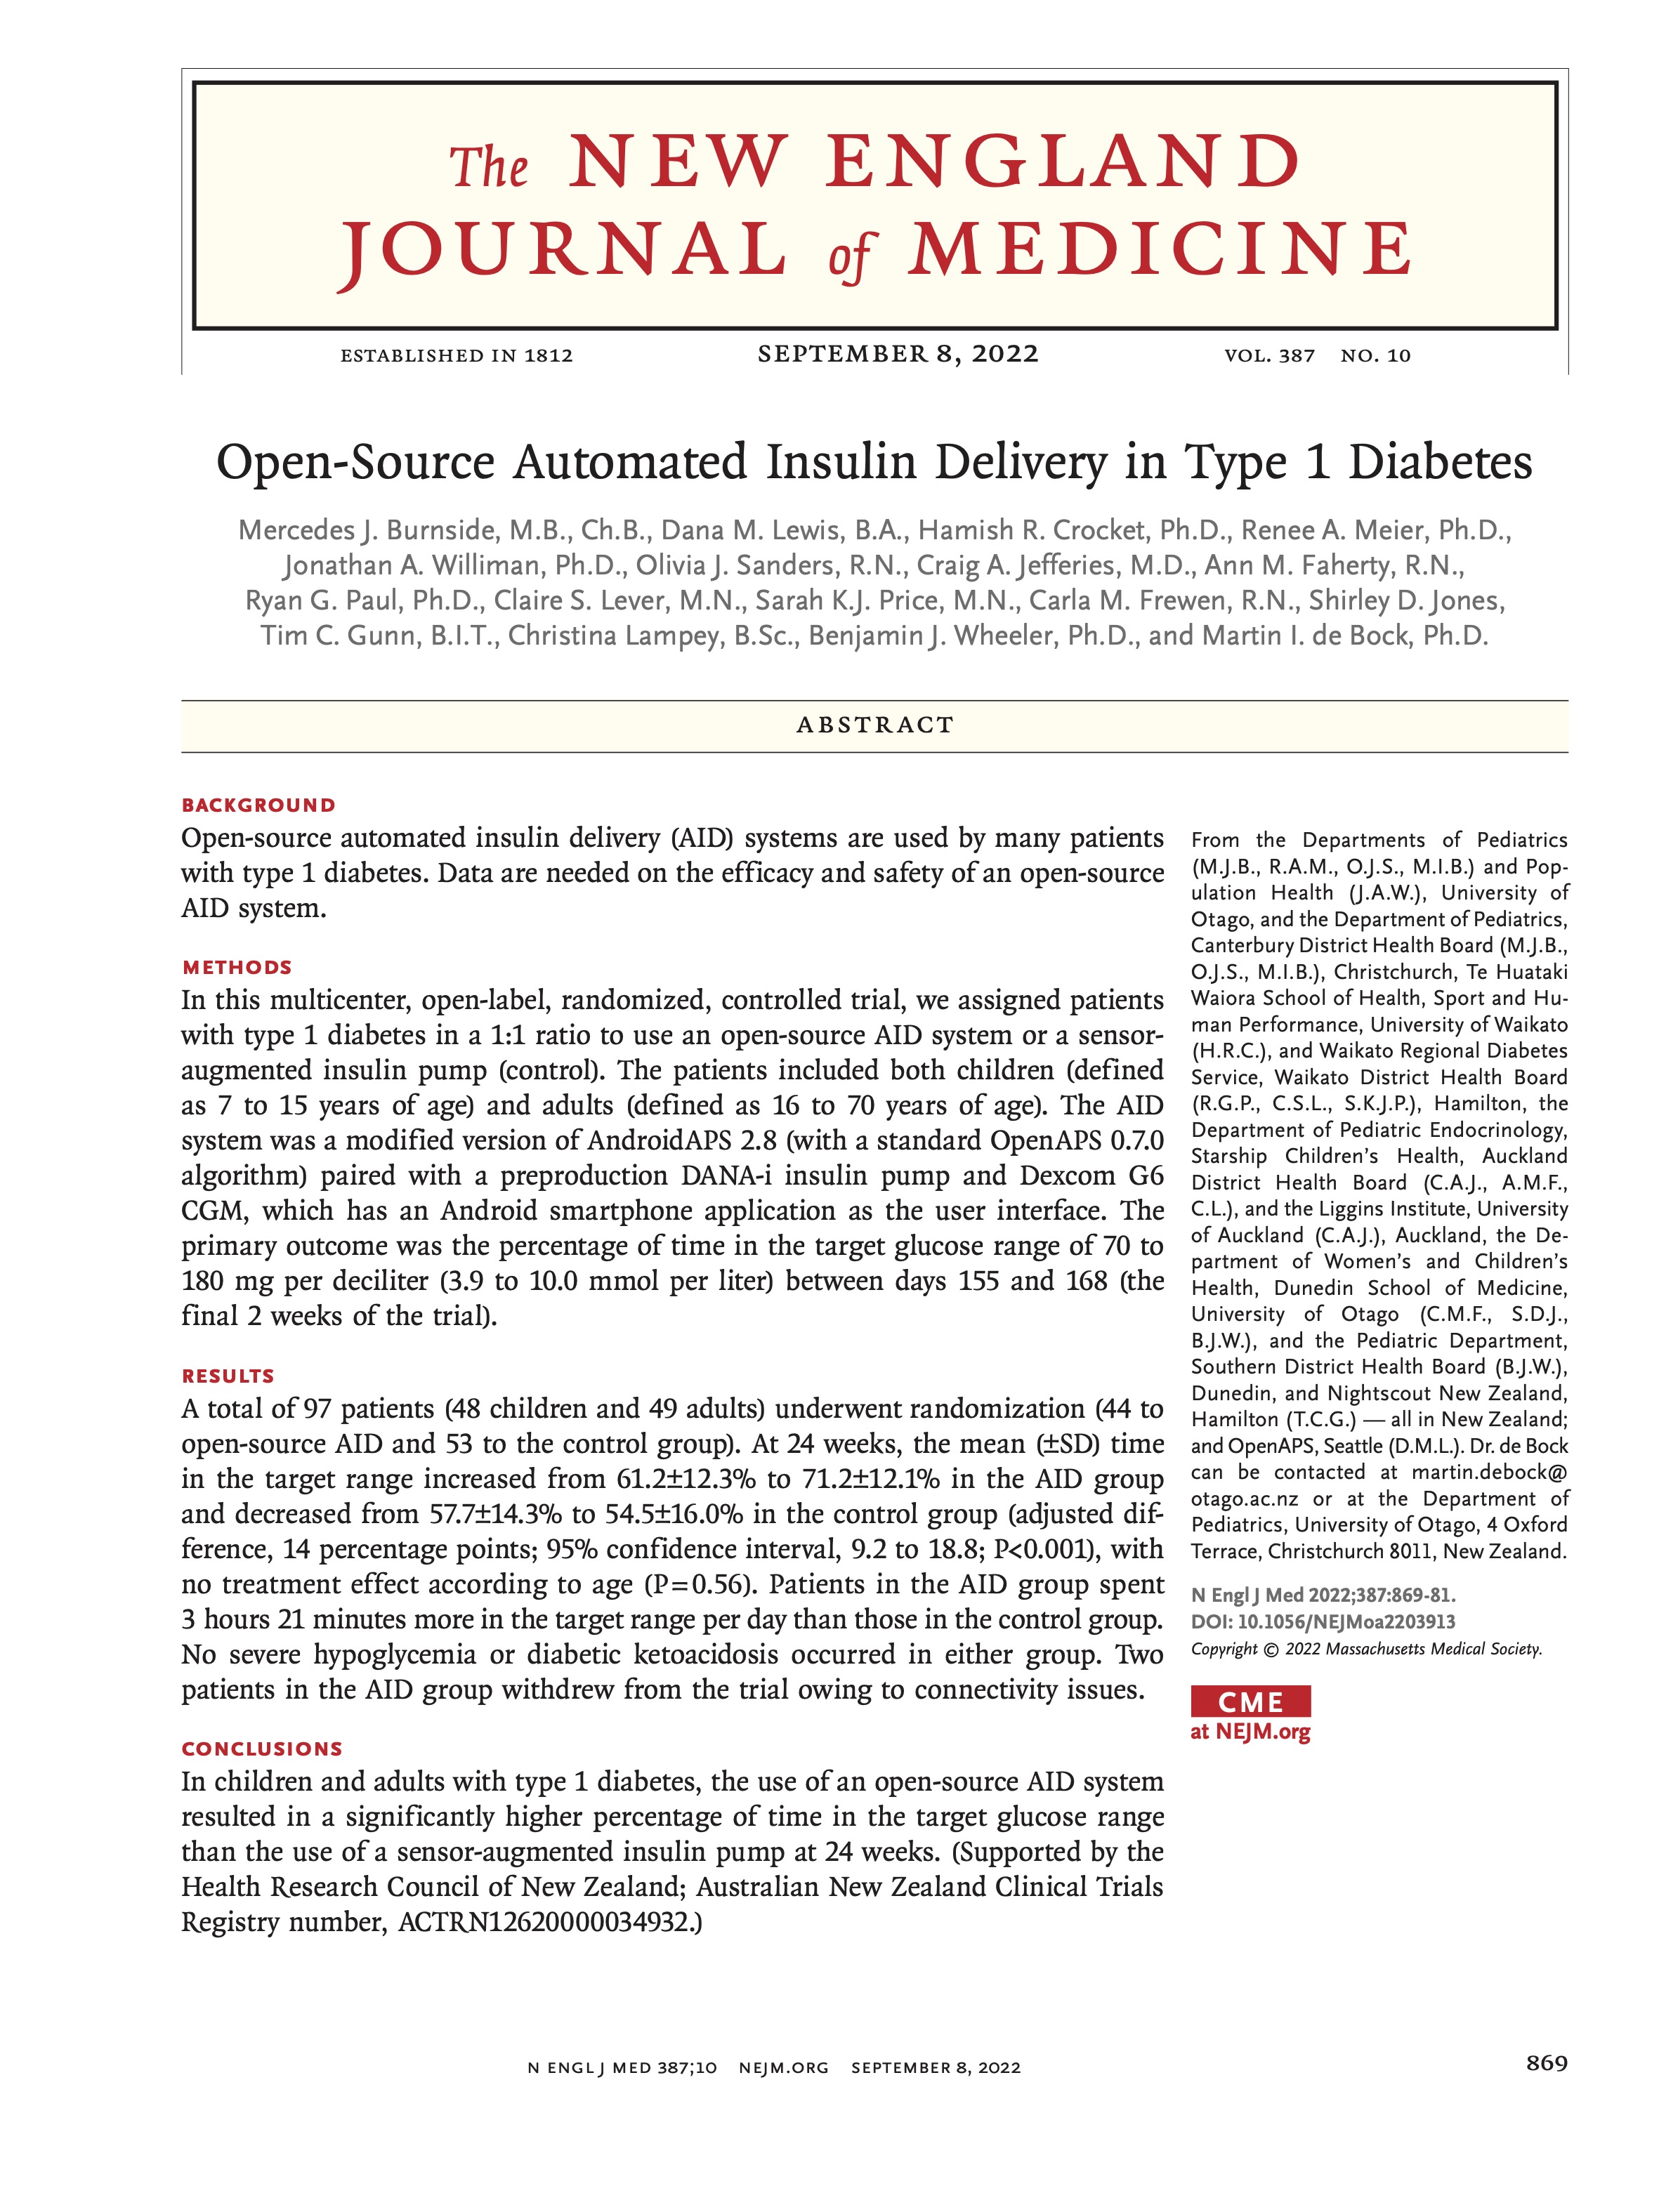 I’m thrilled to share that the results of the first RCT on open source automated insulin delivery (AID) is now published in a peer-reviewed medical journal (New England Journal of Medicine, known as NEJM). You can find it at NEJM
Recent Comments