Last year, I recognized that there was a need to improve the documentation of symptoms of exocrine pancreatic insufficiency (known as EPI or PEI). There is no standardized way to discuss symptoms with doctors, and this influences whether or not people get the right amount of enzymes (pancreatic enzyme replacement therapy; PERT) to treat EPI and eliminate symptoms completely. It can be done, but like insulin, it requires matching PERT to the amount of food you’re consuming. I also began observing that EPI is underscreened and underdiagnosed, whether that’s in the general population or in people with diabetes. I thought that if we could create a list of common EPI symptoms and a standardized scale to rate them, this might help address some of these challenges.
I developed this scale to address these needs. It is called the “Exocrine Pancreatic Insufficiency Symptom Score” or “EPI/PEI-SS” for short.
I had a handful of people with and without EPI help me test the scale last year, and then I opened up a survey to the entire world and asked people to share their experiences with GI-related symptoms. I specifically sought people with EPI diagnoses as well as people who don’t have EPI, so that we could compare the symptom burden and experiences to people without EPI. (Thank you to everyone who contributed their data to this survey!)
After the first three weeks, I started analyzing the first set of data. While doing that, I realized that (both because of my network of people with diabetes and because I also posted in at least one diabetes-specific group), I had a large sub-group of people with diabetes who had contributed to the survey, and I was able to do a full subgroup analyses to assess whether having diabetes seemed to correlate with a different symptom experience of EPI or not.
Here’s what I found, and what my poster is about (you can view my poster as a PDF here), presented at ADA Scientific Sessions 2024 (#ADA2024):
1985-LB at #ADA2024, “Assessing the Impact of Diabetes on Gastrointestinal Symptom Severity in Exocrine Pancreatic Insufficiency (EPI/PEI): A Diabetes Subgroup Analysis of EPI/PEI-SS Scores”
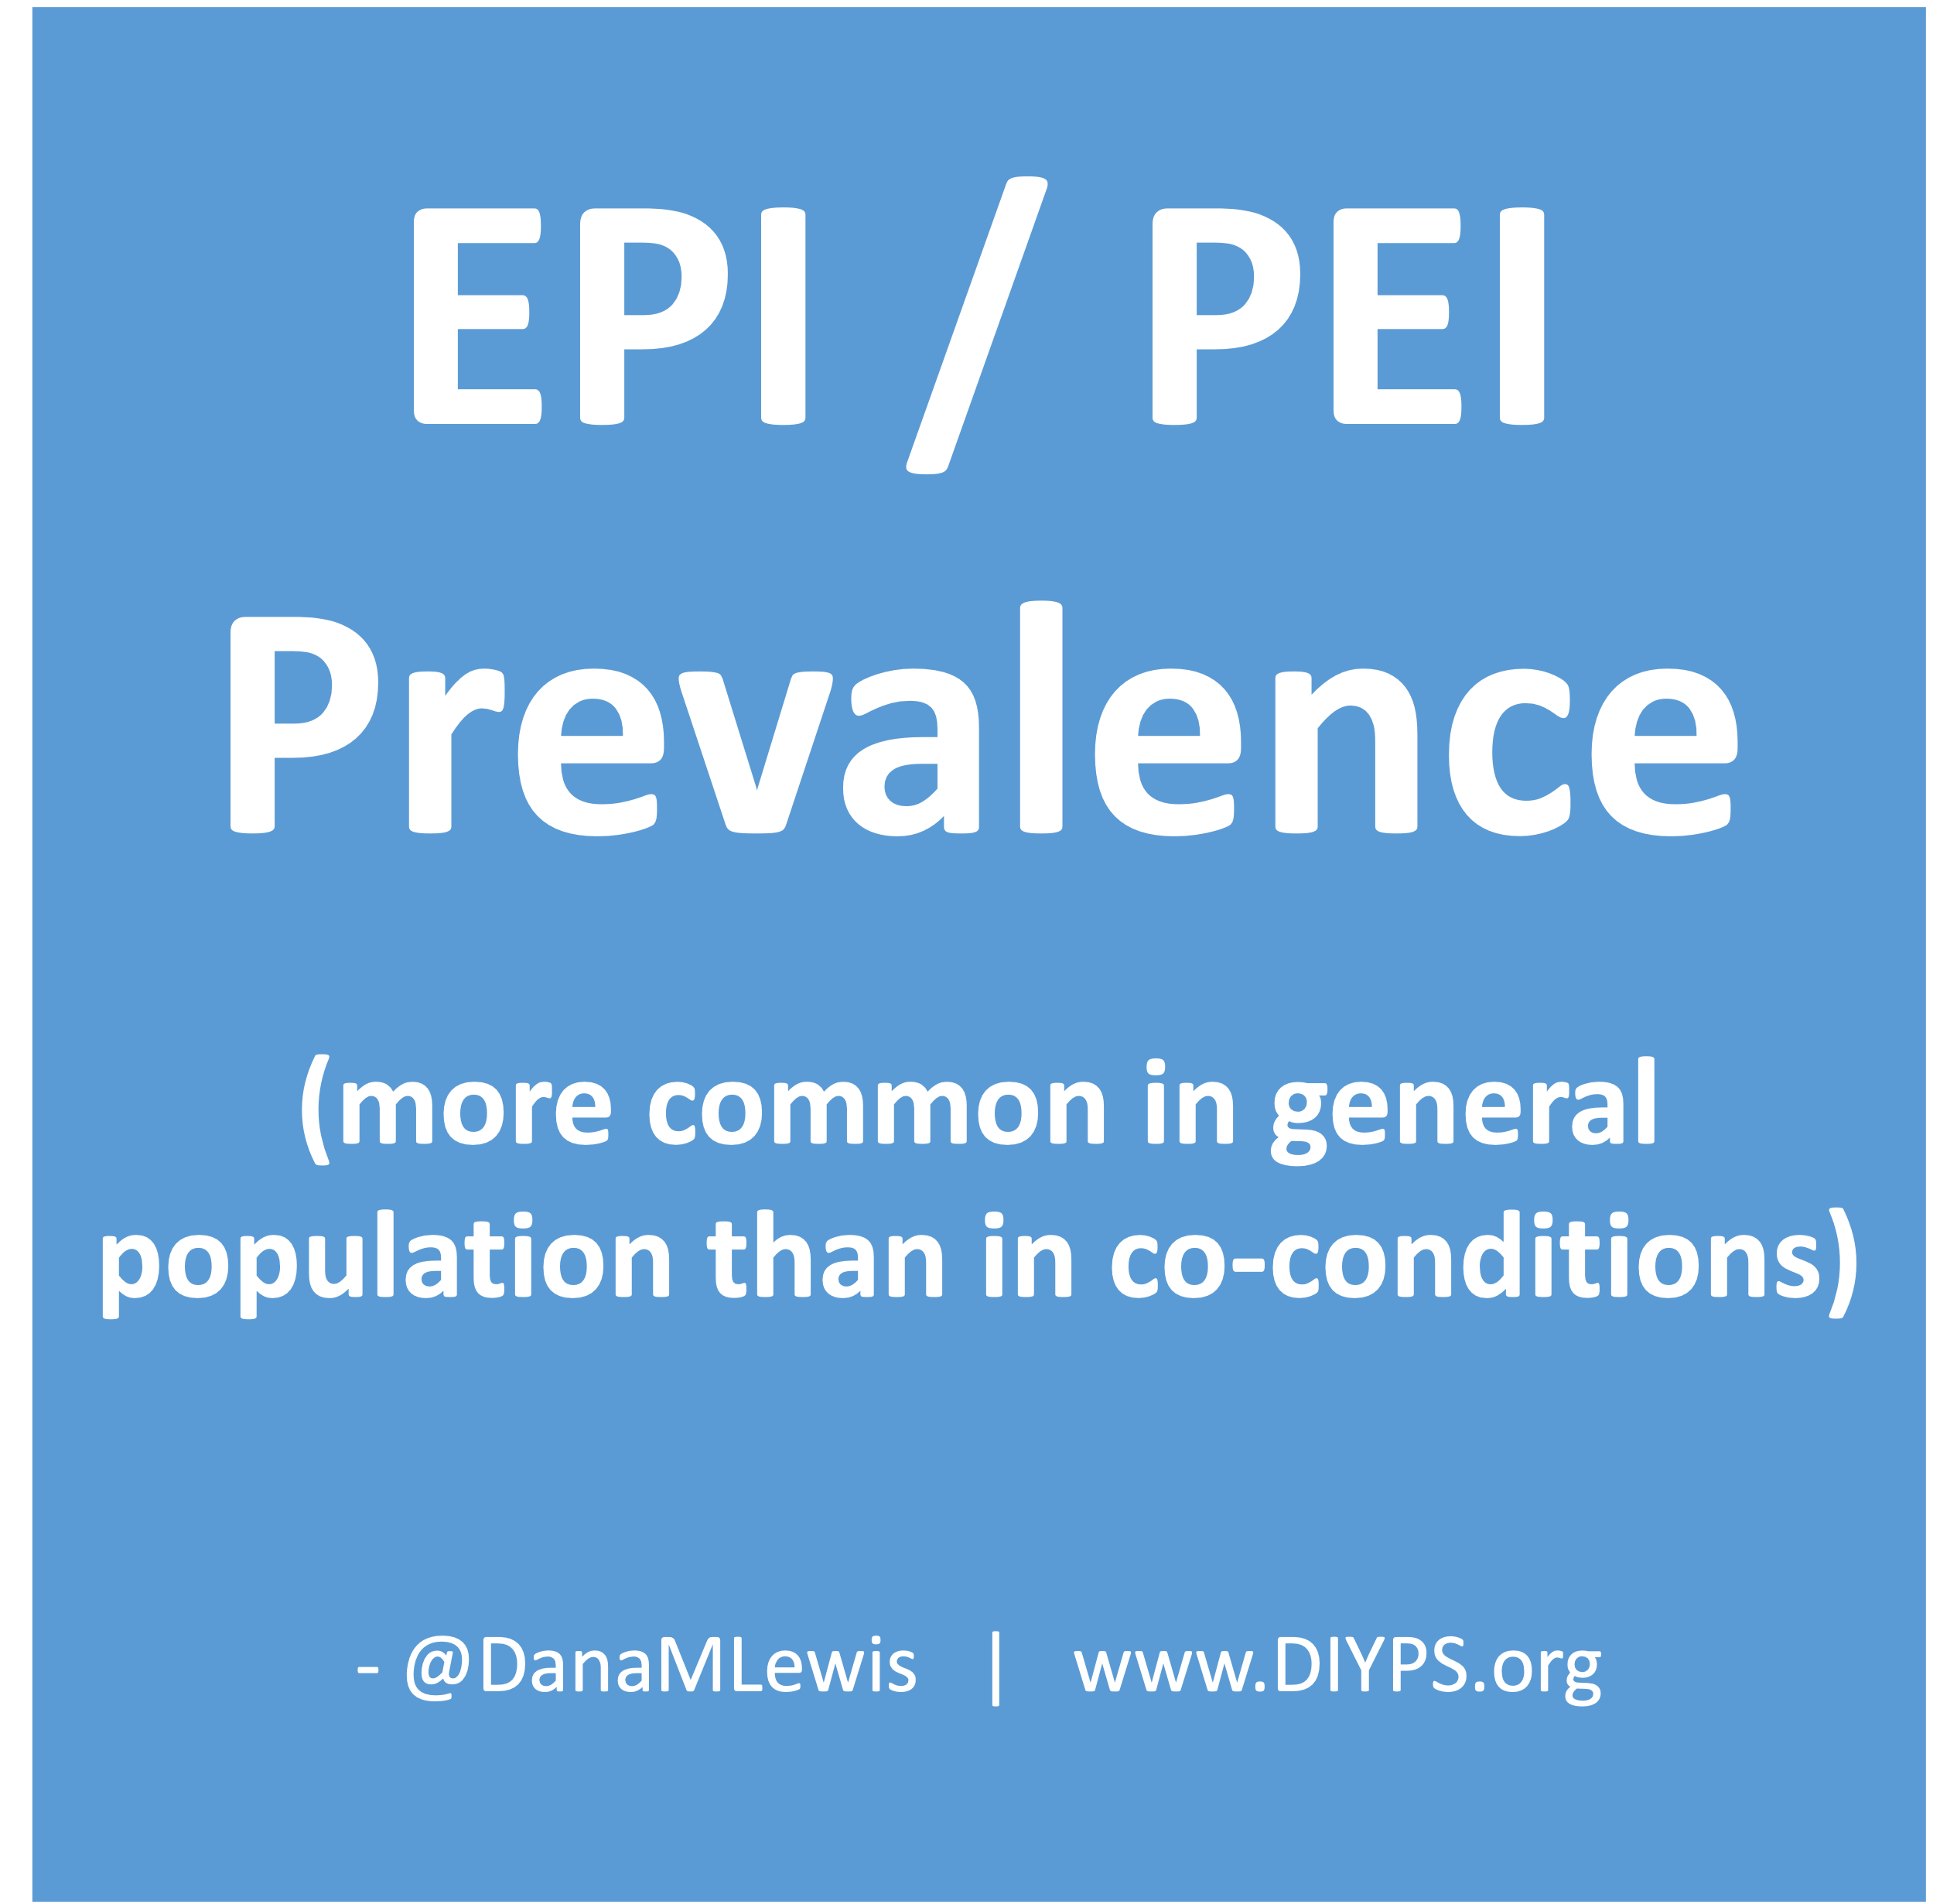
Exocrine pancreatic insufficiency has a high symptom burden and is present in as many as 3 of 10 people with diabetes. (See my systematic review from last year here). To help improve conversations about symptoms of EPI, which can then be used to improve screening, diagnosis, and treatment success with EPI, I created the Exocrine Pancreatic Insufficiency Symptom Score (EPI/PEI-SS), which consists of 15 individual symptoms that people separately rate the frequency (0-5) and severity (0-3) for which they experience those symptoms, if at all. The frequency and severity get multiplied for an individual symptom score (0-15 possible) and these get added up for a total EPI/PEI-SS score (0-225 possible, because 15 symptoms times 15 possible points per symptom is 225).
I conducted a real-world study of the EPI/PEI-SS in the general population to assess the gastrointestinal symptom burden in individuals with (n=155) and without (n=169) EPI. Because there was a large cohort of PWD within these groups, I separately analyzed them to evaluate whether diabetes contributes to a difference in EPI/PEI-SS score.
Methods:
I calculated EPI/PEI-SS scores for all survey participants. Previously, I had analyzed the differences of people with and without EPI overall. For this sub-analysis, I analyzed and compared between PWD (n=118 total), with EPI (T1D: n=14; T2D: n=20) or without EPI (T1D: n=78; T2D: n=6), and people without diabetes (n=206 total) with and without EPI.
I also looked at sub-groups within the non-EPI cohorts and broke them into two groups to see whether other GI conditions contributed to a higher EPI/PEI-SS score and whether we could distinguish EPI from other GI and non-GI conditions.
Results:
People with EPI have a much higher symptom burden than people without EPI. This can be assessed by looking at the statistically significant higher mean EPI/PEI-SS score as well as the average number of symptoms; the average severity score of individual symptoms; and the average frequency score of individual symptoms.
This remains true irrespective of diabetes. In other words, diabetes does not appear to influence any of these metrics.
People with diabetes with EPI had statistically significant higher mean EPI/PEI-SS scores (102.62 out of 225, SD: 52.46) than did people with diabetes without EPI (33.64, SD: 30.38), irrespective of presence of other GI conditions (all group comparisons p<0.001). As you can see below, that is the same pattern we see in people without diabetes. And the stats confirm what you can see: there is no significant difference overall or in any of the subgroups between people with and without diabetes.
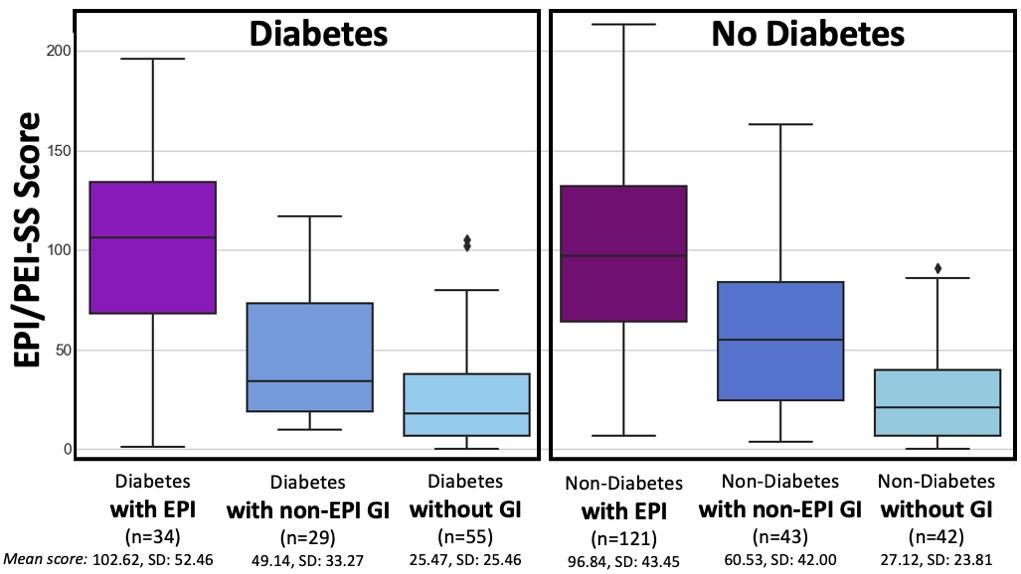
T1D and T2D subgroups were similar
(but because the T2D cohort is small, I did not break them out separately in this graph).
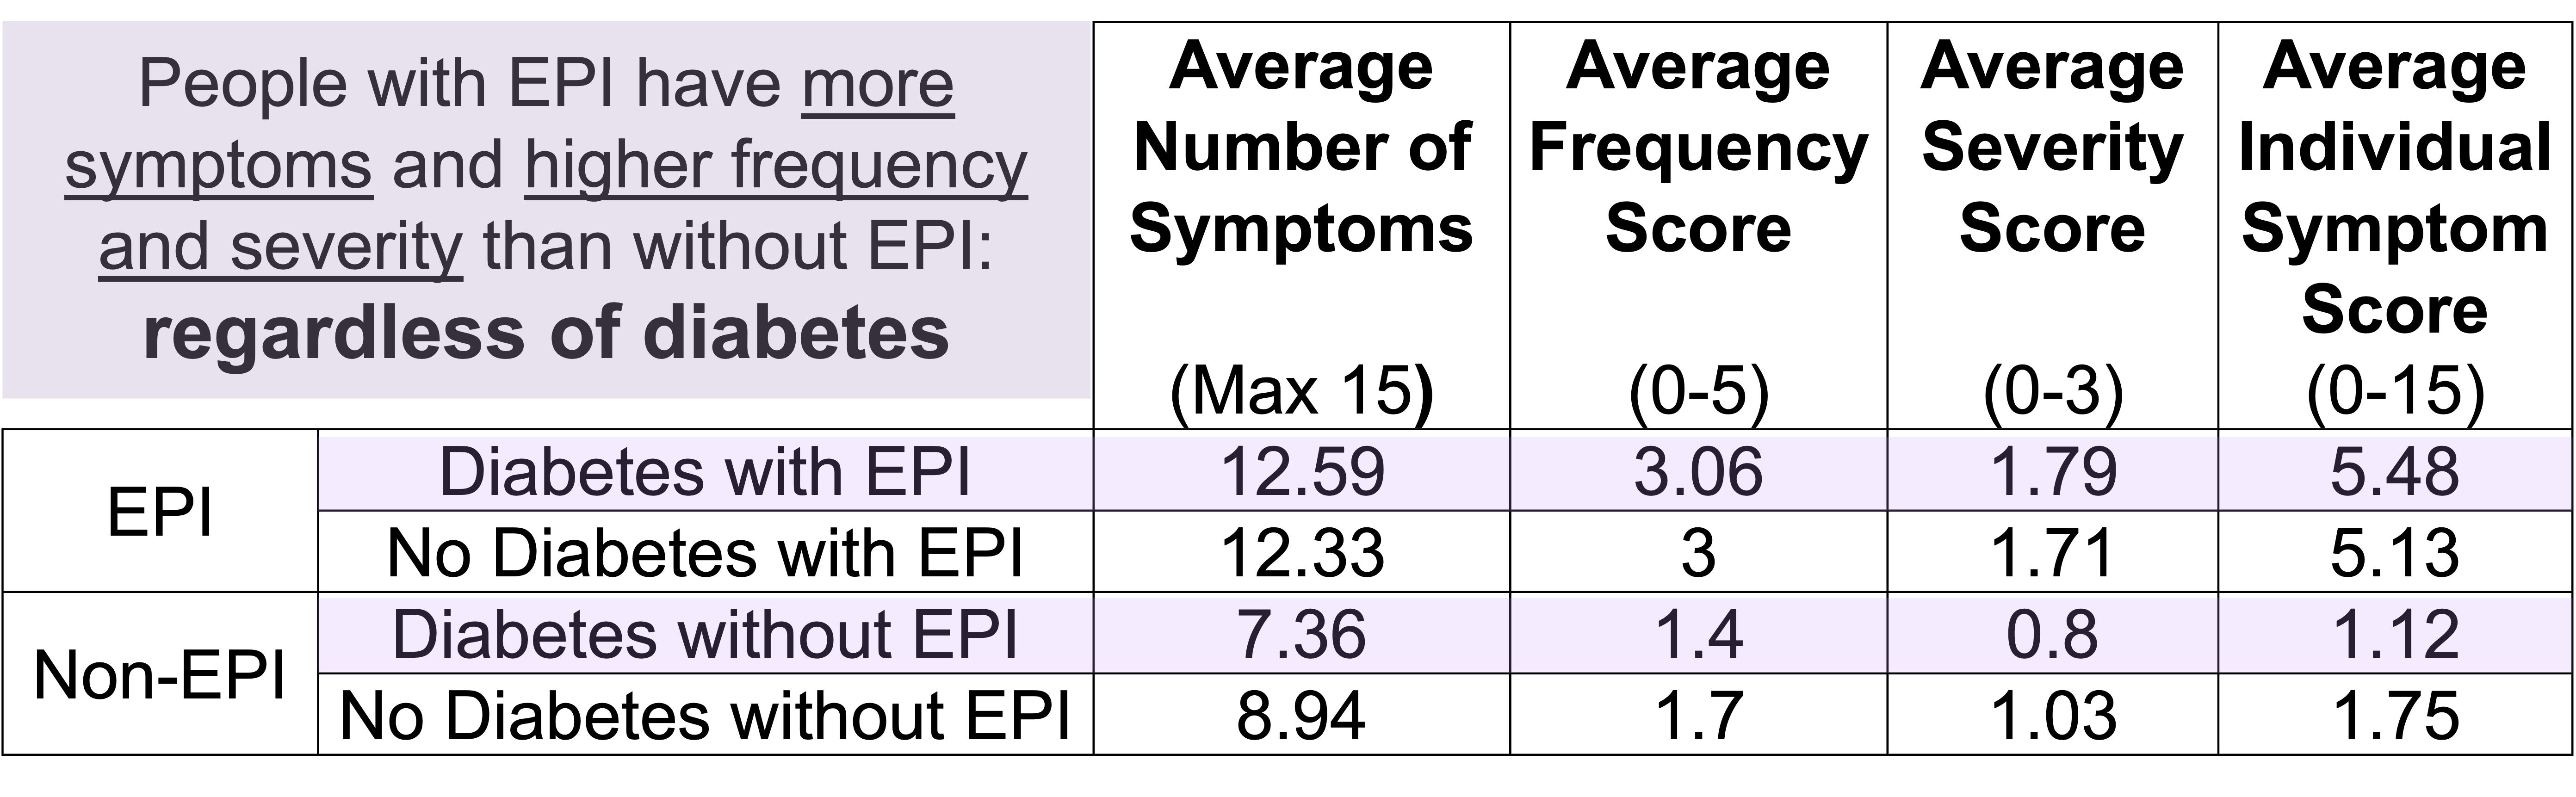
For example, people with diabetes with EPI had an average of 12.59 (out of 15) symptoms, with an average frequency score of 3.06 and average severity score of 1.79, and an average individual symptom score of 5.48. This is a pretty clear contrast to people with diabetes without EPI who had had an average of 7.36 symptoms, with an average frequency score of 1.4 and average severity score of 0.8, and an average individual symptom score of 1.12. All comparisons are statistically significant (p<0.001).
Conclusion
- EPI has a high symptom burden, irrespective of diabetes.
- High scores using the EPI/PEI-SS among people with diabetes can distinguish between EPI and other GI conditions.
- The EPI/PEI-SS should be further studied as a possible screening method for EPI and assessed as a tool to aid people with EPI in tracking changes to EPI symptoms over time based on PERT titration.
What does this mean if you are a healthcare provider? What actionable information does this give you?
If you’re a healthcare provider, you should be aware that people with diabetes may be more likely to have EPI – rather than celiac or gastroparesis (source) – if they mention having GI symptoms. This means you should incorporate fecal elastase screening into your care plans to help further evaluate GI-related symptoms.
If you want to further improve your pre-test probability of the elastase testing, you can use the EPI/PEI-SS with your patients to assess the severity and frequency of their GI-related symptoms. I will explain the cutoff and AUC numbers we calculated, but first understand the caveat that these were calculated in the initial real-world study that included people with EPI who are already treating with PERT; thus these numbers might change a little when we repeat this study and evaluate it in people with untreated EPI. (However, I actually predict the mean score to go up in an undiagnosed population, because scores should go down with treatment.) But that different population study may change these exact cutoff and sensitivity specificity numbers, which is why I’m giving this caveat. That being said: the AUC was 0.85 which means a higher EPI/PEI-SS is pretty good for differentiating between EPI and not having EPI. (In the diabetes sub-population specifically, I calculated a suggested cutoff of 59 (out of 225) with a sensitivity of 0.81 and specificity of 0.75. This means we estimate that if people are bringing up GI symptoms to you and you have them take the EPI/PEI-SS and their score is greater than or equal to 59, you would expect that out of 100 people that 81 with EPI would be identified (and 75 of 100 people without EPI would also correctly be identified via scores lower than 59). That doesn’t mean that people with EPI can’t have a lower score; or that people with a higher score do have EPI; but it does mean that the chances of having fecal elastase <=200 ug/g is a lot more likely in those with higher EPI/PEI-SS scores.
In addition to the cutoff score, there is a notable difference in people with diabetes and EPI compared to people with diabetes without EPI in their top individual symptom scores (representing symptom burden based on frequency and severity). For example, the top 3 symptoms of those with EPI and diabetes include avoiding certain food/groups; urgent bowel movements; and avoiding eating large meals. People without EPI and diabetes also score “Avoid certain food/groups” as their top score, but the score is markedly different: the mean score of 8.94 for people with EPI as compared to 3.49 for people without EPI. In fact, the mean score on the lowest individual symptom is higher for people with EPI than the highest individual symptom score for people without EPI.
 How do you have people take the EPI/PEI-SS? You can pull this link up (https://bit.ly/EPI-PEI-SS-Web), give this link to them and ask them to take it on their phone, or save this QR code and give it to them to take later. The link (and the QR code) go to a free web-based version of the EPI/PEI-SS that will calculate the total EPI/PEI-SS score, and you can use it for shared decision making processes about whether this person would benefit from a fecal elastase test or other follow up screening for EPI. Note that the EPI/PEI-SS does not collect any identifiable information and is fully anonymous.
(Bonus: people who use this tool can opt to contribute their anonymized symptom and score data for an ongoing observational study.)
If you have feedback about whether the EPI/PEI-SS was helpful – or not – in your care of people with diabetes; or if you want to discuss collaborating on some prospective studies to evaluate EPI/PEI-SS in comparison to fecal elastase screening, please reach out anytime to Dana@OpenAPS.org.
What does this mean if you are a patient (person with diabetes)? What actionable information does this give you?
If you don’t have GI symptoms that bother you, you don’t necessarily need to take action. (Just put a note in your brain that EPI is more likely than celiac or gastroparesis in people with diabetes so if you or a friend with diabetes have GI symptoms in the future, you can make sure you are assessed for EPI.) You can also choose to take the EPI/PEI-SS regardless, and also opt in to donate your data.
If you do have GI symptoms that are annoying, you may want to take the EPI/PEI-SS to help you evaluate the frequency and severity of your GI symptoms. You can take it for free and anonymously – no identifiable information is needed to access the tool. It will generate the EPI/PEI-SS score for you.
Based on the score, you may want to ask your doctor (which could be the doctor that treats your diabetes, or a primary/general care provider, or a gastroenterologist – whoever you seek routine care from or have an appointment from next) about your symptoms; share the EPI/PEI-SS score; and explain that you think you may warrant screening for EPI.
(You can also choose to contribute your anonymous symptom data to a research dataset, to help us improve the EPI/PEI-SS and help us figure out how to help improve screening and diagnosis and treatment of EPI. Remember, this tool will not ask you for any identifying information. This is 100% optional and you can opt out of doing so if you do not prefer to contribute to research, while still using the tool.)
—
You can see a pre-print version of the diabetes sub-study here or pre-print of the general population data here.
If you’re looking for more personal experiences about living with EPI, check out DIYPS.org/EPI, and also for people with EPI looking to improve their dosing with pancreatic enzyme replacement therapy – you may want to check out PERT Pilot (a free iOS app to record enzyme dosing, also available for free for Android).
Researchers & clinicians, if you’re interested in collaborating on studies in EPI (in diabetes, or more broadly on EPI), whether specifically on EPI/PEI-SS or broader EPI topics, please reach out! My email is Dana@OpenAPS.org
 This came to mind because he went on a work trip, and I stuck things in the dishwasher for 2 days, and jokingly texted him to “come home and do the dishes that the raccoon left”. He came home well after dinner that night, and the next day texted when he opened the dishwasher for the first time that he “opened the raccoon cage for the first time”. (LOL).
 Today, I would say the same is true. It doesn’t matter – for my types of projects – if a human or an LLM “wrote” the code. What matters is: does it work as intended? Does it achieve the goal? Does it contribute to the goal of the project?


Recent Comments