When I first found out I was going to get IVIG (intravenous immunoglobulin), I was nervous because I didn’t know what to expect. New medical treatments or therapies and the uncertainty of what to expect can make it harder. This is a little bit about my experience, what to expect with IVIG, and some differences in the experience depending on location (outpatient or not).
Preparing for the first infusion – prior authorization and scheduling
First, know that IVIG usually needs prior authorization from your insurance. This is approval not only for the treatment itself; but the volume (how much you’ll get); the schedule (do you do it a single day or multiple days in a row) and the cadence (how often do you get it, if you get it over and over again). And, the location.
The first time my provider prescribed IVIG, my insurance denied it. And again. And again. My provider had to do a round of peer to peer with the insurance company before they approved it.
(Note: IVIG is used for dozens of conditions including numerous autoimmune disease conditions. Sometimes this is the only approved treatment for these conditions; sometimes there are other treatments your insurance company will want you to try before IVIG. IVIG is rather expensive, more on that below, which plays into this.)
I was approved for a handful of infusions at an outpatient location in downtown Seattle. Once that was approved, I was able to actually schedule my appointments. If you get IVIG in multiple sessions (e.g. 2 days in a row, like I do, or 3 days in a row), it may make scheduling a tiny bit harder, but usually the clinics can get you in. Luckily, you don’t have to do the exact same time every session, e.g. you can start at 9am on Tuesday and then do 11am on Wednesday, if that’s what works for your schedule or theirs. Or if you prefer and they have availability, you can do it at the same time each day.
For your first appointments though, they’ll probably schedule you earlier in the morning and tell you to expect it to take all or most of the day. My first appointments were scheduled as 6 hour (!) blocks on back to back days. Gulp.
The first infusion experience
When I arrived for my first infusion, they did the usual check in at a front desk (like a typical doctor’s appointment) and then assigned me to a room/bay. This outpatient infusion center has open room bays with curtains to the hallway (and walls in between the bays), with numbers. Across the hall are several bathrooms. Once I got into my room, a nurse came in and introduced herself and walked me through what we would be doing. She started by asking if I had taken any pre-meds (pre medication) such as Tylenol or Benadryl. I said no (I didn’t know that I was supposed to), so she brought me two Tylenol and a Benadryl. This apparently is fairly common, because headaches are a common side effect and in rare cases (something like <1%) of the time allergic reactions can happen, so the Tylenol and Benadryl can slow down or minimize any allergic reaction that might occur.
I’ll admit, I was nervous about IVIG because of what I had read about allergic reactions, but I’ll say up front: I did not have any allergic reactions to IVIG at the first or any subsequent sessions.
While we were waiting for those to kick in, they put in the order for the IG itself, which had to be sent over from the pharmacy. They inserted the IV into my arm, which involves using a needle then immediately pulling it back out so only a small thing of tubing is left behind. (This is similar to an insulin pump site!) They tape it and wrap it so it won’t get jostled from normal movements, and we waited until the IG arrived.
Note: if you need to have labs run to check anything before or around the time of your infusion, they can pull blood from the same IV first, then they flush it with saline and can then use it to infuse your IG.
When they start the IVIG, they start it at really low (slow) rates. Your provider will have prescribed the rates and the schedule. For example, you start at a slow rate and then it increases every 30 minutes. This way, if you do have any symptoms (sudden headaches or start feeling itchy, for example), you can go back to a slower rate to finish the infusion. That will take longer, overall, than if you went at the planned schedule because as your rate gets higher (larger), more goes in faster.
An example schedule might be 0-30 minutes at 30 mL/hr; 30-60 minutes at 60 mL/hr; 60-90 minutes at 120 mL/hr; 90-120 minutes at 240 mL/hr; 120-150 minutes at 375 mL/hr. If you still have IG left to infuse after 2.5 hours (aka 150 minutes), they continue at the highest rate, eg 150-180 minutes will continue at 375 mL/hr. Note that with this typical progression, your rate starts slow and doubles every half hour, until you get to the max dose. I believe this is calculated based on body weight. I am not sure if this is the number they were referring to (for max rate determination), but I heard the nurses discussing that one of the numbers is calculated based on ideal body weight, not actual body weight. That is one of the factors that will influence how much you get (volume wise, as in how much liquid) as well as the rate schedule.
If you start to feel yucky for any reason, you have a button you can call the nursing team with. But they also have scheduled checks. My experience was that they took blood pressure, pulse, and temperature at the start (0 minutes) and every 15 minutes up to the first hour, then every half hour after that. So with the rates described above, the schedule might look like this table:
| Time |
Rate |
Checks |
| Start (0 min) |
30 mL/hr |
BP, pulse, temp |
| 15 min |
(no change, continues) |
BP, pulse, temp |
| 30 min |
60 mL/hr |
BP, pulse, temp |
| 45 min |
(no change, continues) |
BP, pulse, temp |
| 60 min |
120 mL/hr |
BP, pulse, temp |
| 90 min |
240 mL/hr |
BP, pulse, temp |
| 120 min |
375 mL/hr |
BP, pulse, temp |
| 150 min |
(no change, continues) |
BP, pulse, temp |
| 180 min |
(no change, continues) |
BP, pulse, temp |
| (runs until you infuse all liquid) |
|
|
In the scenario where you had no side effects, and let’s say you had 400mL of IG to infuse, that means you would finish the initial infusion in around 2 hours and 15 minutes. After the main infusion finishes, they will hang a small bag (often 50mL) of saline, and then infuse that at the same highest rate of your IG, which means that all the remaining IG in the tube will get infused in. This may take something like 10-30 minutes, depending on your rate.
Remember, though, for your first infusion you may be on slower rates than this progression, to watch for side effects. A typical first infusion might be roughly double the time as this (4+ hours) even if you don’t have side effects, as you progress through the rates. If you do have side effects (feeling yucky, headache, itching, etc), it may take a lot longer because they will go back to the slower rate where you didn’t have side effects. For example, if you had issues at 240 mL/hr but not 120, they will finish infusing at 120 mL/hr, which would take an estimated 4 hours and 45 minutes, rather than 2.5 hours.
Another thing that can slow down the total time is bubbles. If your infusion line develops bubbles, the infusion machine will detect them and sound an alarm and stop the infusion. A nurse will come in, clear the alarm, shake the bubbles back up the tube, and proceed. That might take 2-3 minutes total, but if that happens several times (which is common with IVIG), that may add another 15 or so minutes.
Once that’s complete, you will get the IV removed (which is like pulling a bandaid off, in terms of the experience) and you’re ready to go for the day!
With the slow first infusion rates, bubbles, and saline flush at the end, this is why they schedule you for 6 hours or so, even if the infusion itself may take 4.5 or so hours.
See below though, because the next round of infusions are usually quicker than the original rounds, if you don’t experience side effects during the infusions.
Creature comforts – what to take to an IVIG session for your infusion
Most infusion centers have semi-comfortable recliner chairs. You can put the foot of the chair up; you can lay the chair back. Some of them have a seat heater, although admittedly it doesn’t get super warm. You may want to dress in layers so that if you get cold, you can add items. For example, if it’s summer and you typically wear shorts and a t-shirt, you may want to take loose pants you could pull over your shorts or a jacket to throw over your torso, or socks if you aren’t wearing them. The nursing staff will offer you heated blankets, too.
That being said, my experience with IVIG was freezing. Not from the ambient room temperature, but because the liquid arrives very cold from the fridge, and infusing cold liquid into your arm at the higher rates caused my arm to be ice cold and uncomfortable. I tried warm blankets, throwing a jacket over my torso, wrapping a towel around my arm… and I still had a cold arm and cold hand that took over an hour to warm up after my infusion ended. What finally ended up working best for me was to bring my own heating pad, and place it on a low temp and sit against it. This warmed up my core temperature which then helped keep my extremities (arms) warmer. Now, I regularly use my heating pad every time and don’t need a jacket, long sleeves, a blanket, or anything else! It’s surprising how effective it was to warm my core in order to combat the cold in my arm. Another option is an infusion hoodie, like this one that my sister in law got me. It has zippers in both arms, so you can wear it with your IV tubing.
You’ll absolutely be able to get up and go to the bathroom! At this infusion center, the infusion machine is on a pole with wheels. It’s plugged into the wall with a power cord, but they’ll unplug it for you or show you how to do it, so you can get up anytime and roll yourself to the bathroom, then come back. The battery on the machine lasts 6-8 hours, so you don’t have to bother plugging it back in, and this makes it easy to get up and go to the bathroom whenever you need to, especially if you’re doing a good job staying hydrated (e.g., drinking lots!).
Especially at those longer first infusions, you’re there a long time (4 or 6 hours or more). At my first infusion, they offered me a breakfast menu (because we were there at 8am) and a lunch menu to order food from. At shorter infusions you won’t get a menu if you’re not there at meal time (and at other locations, see below, there are no meals but just snacks), but they still offer to bring you juice, water, snacks periodically.
I have celiac disease which means I’m gluten free and that cuts down on my ability to take whatever from the menu or snacks. (I’m also choosing to mask to avoid infection exposure, and know that masking works, so I’d rather not eat if I don’t have to, and so I don’t). They probably do have some GF options, but I don’t bother with them and bring my own snacks if I want them, and my own drink bags. I have a soft insulated bag I throw water bottles and diet sodas into with an ice pack, so they stay cold and I can have a drink any time I want to, of my preferred choice.
You don’t have to bring your own stuff, but if it would make you happier or more comfortable, you can!
The first few sessions, I brought my laptop, (and phone), headphones, and a tripod for my phone. I tried to get some work done on my laptop, but because the infusion was in the crook of my arm, I risked kinking and stopping the infusion. I eventually gave up on that (but it might be more feasible if it was infusing into my forearm, for example), and stuck to using my phone. Sometimes I watch a show; sometimes I listen to a podcast or audiobook or music; sometimes I’m on zoom calls on my phone with video off, depending on my schedule. But plan to bring entertainment/something to occupy yourself with. If you want, you can nap – they’ll dim the lights, but they’ll likely be doing blood pressure etc checks every 30 minutes so don’t plan to get uninterrupted sleep for the most part.
Side effects from IVIG at first infusion and subsequent infusions
At my first round of infusions, I honestly felt like I was in “time out”. I felt awkward sitting in the chair, tied to the infusion machine. I wanted to be working or out walking and going about my day. I wanted to be normal! (Well, I wasn’t normal, which was why I was getting an infusion). I felt fine during and after my infusions, so I got home and went for my usual walk. It was really hot that day (90 F in July in Seattle), so I felt pretty gross and overdone, and probably overdid it. Then I came home and tried to get some work done, but felt like garbage – I thought because of walking in the heat.
The second day, I did the same thing, but decided not to walk in the heat. I still wanted to try to get work done, and did some, but still felt generally kind of gross and tired and just not great. I had a little bit of a headache, so I kept taking Tylenol (in addition to the dose they gave me before my infusion).
The third day (so the day after my second infusion), I still had pretty strong headaches and felt a little gross. Not sick – I wasn’t infected, all my biomarker data from my wearables was fine (e.g. heart rate, HRV, temperature, respiratory rate etc), but I felt worn down.
Fourth day? Same.
Fifth day? Same.
It probably took those ~3 days after the two days of infusions of feeling gross, then I started to feel better.
Then I started to feel GREAT. I had more energy than I had had in months! It felt like I went from Eeyore to Tigger. Wahoo! So much energy (and no more headaches). I was thrilled.
(Spoiler alert: this is probably unique to my situation, but this also did not last).
For me, the first week I felt sluggish and had headaches. The second week I felt better. The third and fourth week I continued to have symptom progression like before I was on IVIG. That’s probably unique to my situation. But this pattern has continued in all subsequent months, where week two I see an improvement and then drop back down to the previous progression in weeks three and four.
What I did change in subsequent infusions – my personal approach
The headaches I got from IVIG weren’t quite debilitating, but they were obnoxious and cut down on my ability to work or rest like I wanted to.
Over time, I gradually figured out that for me, working on IVIG days (during, or even only after infusions) tends to cause more headaches for several days after. Sometimes I need to work (well, I choose to work) on those days, but I’ve gradually shifted my schedule so that I’ll do audio-only calls that are listen only while I’m infusing, or after I’m home, but I don’t plan any intensive cognitive work on IVIG days. I also don’t try to go out and do anything anymore because that typically results in several days of minor but annoying headaches, even with Tylenol. I can certainly do those things, but it comes with a cost.
In other words, I went from trying to live my normal life on IVIG days (and feeling like I was in time out) to changing my approach and treating them like rest days (minimal to no work planned; no requirement for physical activity but to do a short, gentle walk only if I feel really great) and also often the day after. That is frustrating when I think about how much time I am losing (3 days every month!), but when I calculated the lost productivity in the next few days after IVIG, I realized I was losing out on even more time by trying to work through it, and so resting up on IVIG days and maybe the day after ultimately retains more productive and energetic time for me in that first week.
I continue to take Tylenol and a Benadryl prior to each infusion, although I have never experienced any allergic reaction symptoms (eg itching, rash, etc), but the cost of a Benadryl is low and it provides peace of mind. The Tylenol before I start does seem to help, and I find that putting reminders on my calendar for Tylenol in the afternoon and evening before bed on IVIG days both helps me more proactively remember to take them, and taking them proactively makes the headaches minimal or non existent, compared to if I wait for a headache to start and then am chasing the headache with the Tylenol. Not sure how common that is for everyone else, but in my experience after several months of testing, this is true for me that Tylenol proactively for 2-3 days can eliminate the headaches, in addition to reducing the cognitive load.
Note that you can also adjust your infusion rates, especially if you get headaches DURING infusion. My headaches are never during the infusion, nor bad enough that I want to adjust my rates to be slower – they instead seem to correlate with cognitive burden after infusions and activity burden on my body, so I choose to address them with less work, more rest, and Tylenol for a few days.
The financial cost of IVIG
My eyes about popped out of their sockets when I looked at my EOB (insurance document that says how much was charged and how much insurance paid) for my IVIG experiences. It was in the ballpark of $30,000 billed PER DAY, so $60,000 or so total for two days of IVIG.
Oh my gosh.
(Luckily, I have health insurance; and in fact I typically hit my out of pocket max and deductible within a few days of the new years, so I was not paying for this directly).
As those of you who have looked at EOB know, that’s not what actually gets paid, but still. Yeeesh.
The insurance company rate was more like $17,000 per day, or $34,000 for the two days. Still yikes, that’s a LOT of money. And to do this every month?!
That’s probably part of the reason why insurance pushes back on requests to cover treatments like IVIG. It. Is. Expensive.
But in some cases like mine, they are literally the only option and often the only FDA-approved treatment option for certain conditions.
But, there are things you can do to lower costs, and your insurance will likely tell you this. For example, my prior authorization was originally for something like 41 days, enough for two rounds of treatment. After that, we would have to resubmit for prior auth. I read that approval letter though and noted that they would be more willing to approve outpatient, ambulatory infusion centers.
…which is what I went to the first time. It’s not at the hospital; it’s in a standalone building across from the hospital. But for some reason, they source from the inpatient hospital pharmacy (I think) and so while they bill outpatient costs for nursing staff and facility, the IG liquid itself gets charged at hospital prices. Sheesh. Thus, the $30,000 per day, the bulk of which is hospital priced IG (which is already expensive).
So I looked around and found another ambulatory infusion center that is equal distance from my house, but actually a shorter drive most of the time due to traffic patterns, plus I wouldn’t have to pay for parking. The downside is that they’re not tied into MyChart so I can’t see their records or the status of my prior authorizations like I could with the other ‘outpatient’ center. The upside is: they are cheaper.
How much cheaper?
They bill $35,000 per day of IVIG for the same volume, and my insurance therefore pays about $15,000 per day, or $30,000 total for two days every month.
$34,000 per month (hospital), or $30,000 per month (ambulatory center). Same amount of time. Same drug volume. Same concept…but cheaper.
There was no way to find out in advance how much IVIG would cost at each of these locations. I only know now, after having experienced at both locations, what the relative costs are. It’s the same treatment, the same drug/liquid (IG) with the same cost for the same volume…. Except it’s not. Outpatient doesn’t always mean ‘outpatient’, depending on what services they use such as where they are sourcing via the pharmacy.
Note: this won’t be what anyone else’s IVIG costs, of course. It’s based on the volume of IG I am getting (based on my weight and medical conditions), plus the insurance plan, plus where they source it from, etc. But I’m sharing my costs to give you a ballpark (expect thousands, if not tens of thousands as the “price” that you or insurance won’t pay, but is the upper cap on what to expect).
Other infusion experiences including a different outpatient infusion center clinic experience
My second series of IVIG, due to the cost, was at this other outpatient center. This is in an ambulatory infusion clinic that’s basically plopped inside an older medical office or business building. It’s less shiny and new, but works the same. There are rows of bays with infusion chairs (so you’re in your own ‘room’), the infusion still works the same, etc.
I ended up in this location because I was actually trying to get home infusions. If I was going to be doing this two days a month, I thought, I’d rather have a home health nurse come in and do it and save me the travel time. But it turns out they won’t do mine as home infusions because I do two days in a row. Stupid policy, and they lied to me up front about it, which made me really mad, because I was stuck going to this outpatient location.
They’re pretty efficient. You are basically scheduled directly with a specific nurse each time and you know who it is. They text you a reminder and some questions the day before, and you walk in and say hi and immediately get seated. They set up your IV and ask some questions and off you go. It’s the same infusion time (eg 2.5 hours, in my case), plus the infusion set up time which is usually pretty quick (15-20 minutes) and the flush at the end (~15 minutes), plus any bubble time, which means about 3 hours at the clinic, plus my ~30-40 minute drive each way depending on traffic. Times two days in a row. So, not as bad as those first infusion appointments (6 hours estimated), but it’s still 4-5 hours round trip of time for two days in a row. The nursing staff is great, and like the other clinic you’ll get offered warmed blankets, snacks, and drinks. So in terms of experience, it’s not too different. The main functional difference is that your infusion machine is on a pole on the wall, so you can’t get up and go to the bathroom with your infusion set up. Instead, you have to ask (or time it so when they come in to do a rate change) for them to pause the infusion, unhook you, then you go to the bathroom and come back and get your infusion hooked up again and you’re back at it. (This adds another 5 min or so to the total time, so I usually try to time it so I am doing it when they’re coming to change for the saline flush, or make it until the end. Sometimes I make it, sometimes I don’t because I’m also trying to hydrate really well and drink a lot, because that helps reduce headaches, too.)
At the end of each appointment round, they also take on the hassle of calling the scheduler for me and getting my appointments scheduled. I generally stick to roughly the same times of day and prefer earlier in the week appointments so that I can feel better by the weekend (again, perhaps my unique response timeline to IVIG).
I like this location a little bit less than the downtown location, but not $25,000 less, so I continue to use them every month for my IVIG.
Final tips – infusion rate spreadsheet to estimate time of IVIG
You’ll maybe have picked up that I don’t like uncertainty and not knowing what to expect. The vagaries of time uncertainty related to infusions bother me, because I like to know roughly how long things will take so I can schedule the rest of my day. After the first round of IVIG once we figured out what my rates are (and that I don’t have to slow them down for side effects), it should be predictable for how long things take every time, with margins for getting set up and flushed, etc. I ended up making a spreadsheet with my rates and time increments (every 30 minutes) and since I know my total volume of IG, I can see roughly what time my infusion will take. I also estimated the flush time of the 50 mL of saline (which is given at my max rate), and added that in. My spreadsheet therefore is set up so each time I change the start time and it auto-populates every 30 minutes how much will be given, how much has been given cumulatively, and including the estimated flush time at the end, what time the infusion will finish. This way I can estimate what time I’ll be leaving and when I’ll get home. For example, if I have a 10:30 appointment time, my infusion might start flowing at 10:48 (usually plus or minus 5 minutes from this, depending on if they unboxed all my stuff before I arrived). I might finish at an estimated 1:22pm, plus flush time, which means I can expect to be walking out the door at 1:35pm.
This way, if it takes a lot longer (say, start infusion at 10:57 and I’m having tons of bubbles), I know that I’m likely to be a half hour behind my typical schedule.
(If you make your own spreadsheet, it won’t be exact: it takes them a minute or two after the rate change alarm goes off to come and change it, so I actually add a minute to every 30 minute estimate to adjust for this time. I also add ~3 minutes buffer to the overall time to account for bubble pauses, too, as usually I average 2-3 rounds of bubbles that pause the infusion each time.)
Schedule may change (and IVIG may not be forever)
I had some existential angst when I realized that I needed IVIG. In part, due to the situation that caused the need for IVIG. But in part, for the idea that I would be on this monthly schedule for IVIG for the foreseeable future. Two days a month seemed like a LOT, especially with not knowing how long I needed it for. (At the point in time I’m writing this, it has been six months, and I’m still getting it for my situation.)
But if you need it, it’s usually worth it. (If not, you’ll stop it). So that my final piece of advice for folks:
- If you need it, it’s worth the (time and usually financial) cost
- It may not be forever. Your situation may improve to the point where you can space out your infusions more than your initial schedule. For example, you might first get it every 4 weeks, then do well enough to push it out to every 6 or 8 weeks, or more.
- You might get to eventually discontinue it.
—-
That’s been my experience with IVIG so far, after 6 months of sessions where I get IVIG two days in a row every four weeks.
Update: I am adding this note with some additional experiences. I continued to have a ‘drop off’ in weeks 3-4 of my IVIG cycle, so I switched to trying 2 days every 3 weeks (instead of 4). It helped, but I still was dropping off in week 3. So then we switched me to 1 day every 2 weeks. That worked better for me, but it’s still only a slight bandaid and was not stopping my overall progression or flattening it or even helping turn things around. But it’s definitely a better quality of life experience to not have the dropoff effect in weeks 3 and 4. I have now transitioned to subcutaneous IG, aka ScIG, which you can read more about here.
There’s not a lot out there about IVIG, and I’ll caution that my experiences may not be universal, but this may help others know what to expect when they’re going for IVIG for the first time, regardless of condition. You’ll note I did not specify what condition I have or the reason I’m getting IVIG, and hopefully that helps people understand this has been my n=1 personal experience.
Feel free to drop any questions below, or share your own experiences or any tricks you’ve come up with to improve your own IVIG experiences (like I do with my heating pad to fight the cold arm effect).
 It occurred to me that maybe I could tweak it somehow and make the bullets of the list represent food items. I wasn’t sure how, so I asked the LLM if it was possible. Because I’ve done my other ‘design’ work in PowerPoint, I went there and quickly dropped some shapes and lines to simulate the icon, then tested exporting – yes, you can export as SVG! I spent a few more minutes tweaking versions of it and exporting it. It turns out, yes, you can export as SVG, but then the way I designed it wasn’t really suited for SVG use. When I had dropped the SVG into XCode, it didn’t show up. I asked the LLM again and it suggested trying PNG format. I exported the icon from powerpoint as PNG, dropped it into XCode, and it worked!
 If you can shift your mindset from fear and avoidance to curiosity and experimentation, you might discover new skills, solve problems you once thought were impossible, and open up entirely new opportunities.
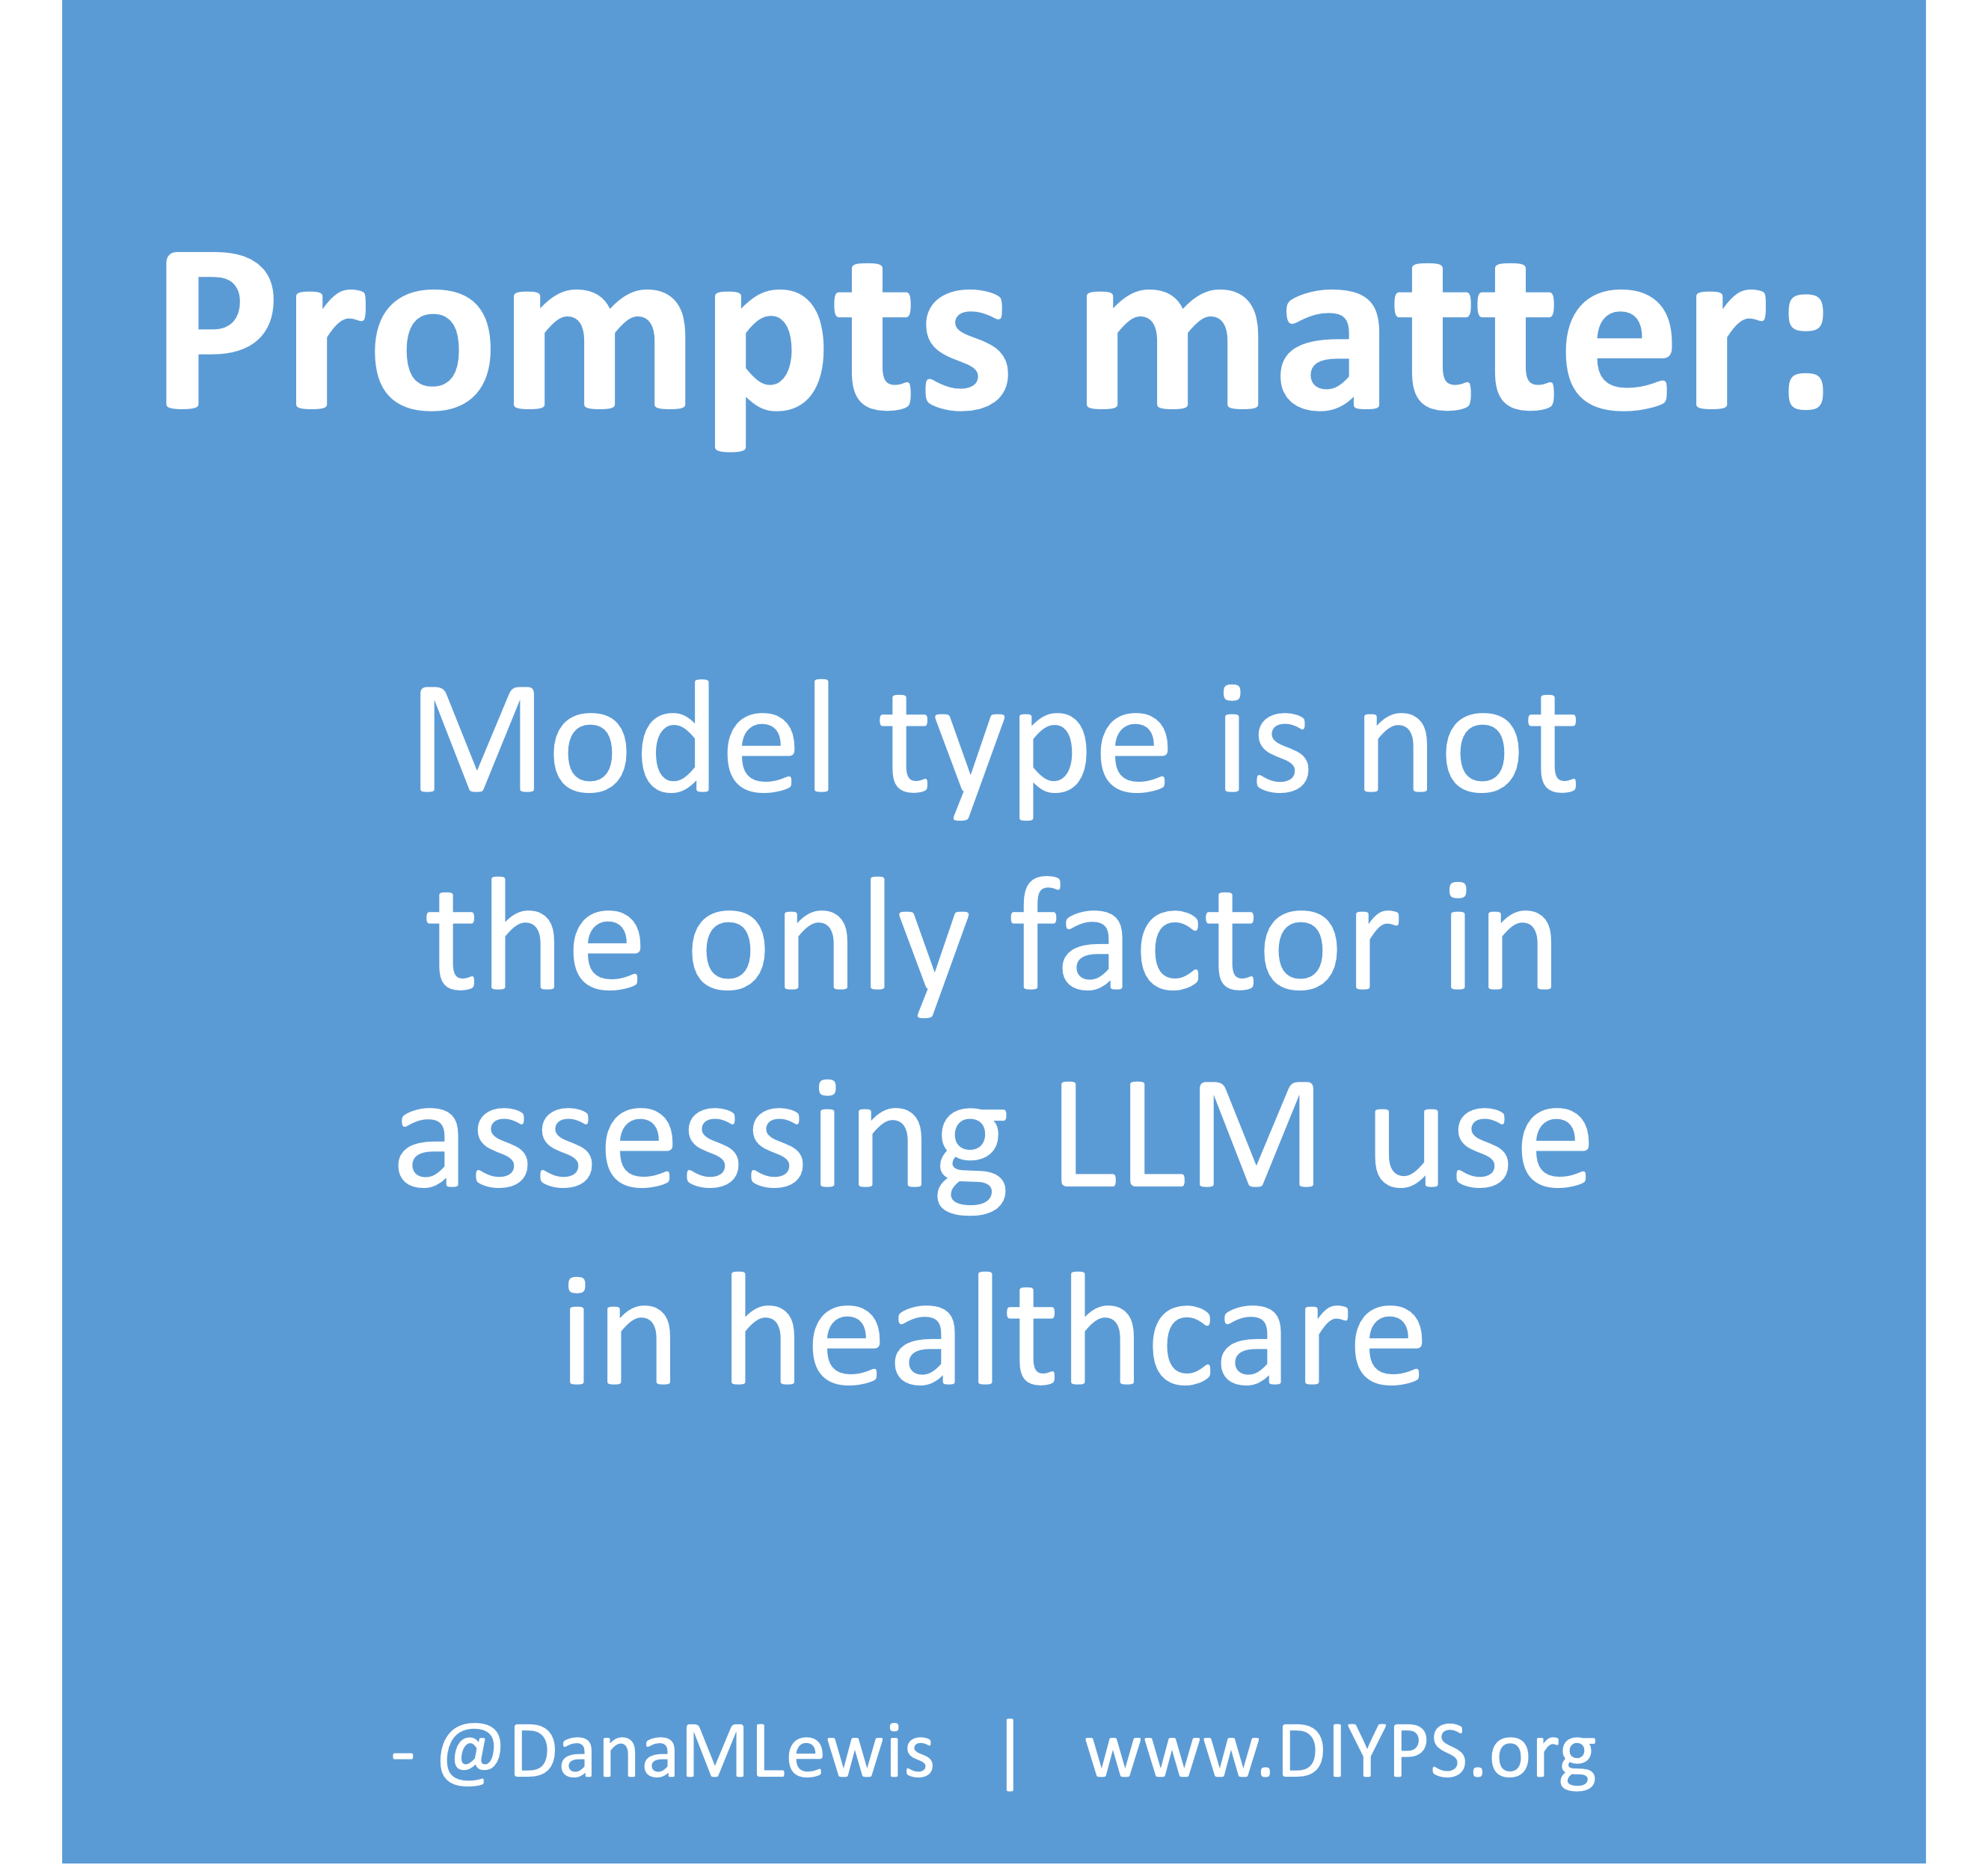 TLDR: Instead of asking “Which model is best?”, a better question might be:
 AI can be useful for reducing clinician workload and improving documentation efficiency. But like any tool, its impact depends on how it’s implemented, how transparent the process is, and whether there are safeguards to address errors when they occur.
 This basically has been our plan for if either of us were to get COVID-19 (or the flu), and it’s good to know this plan works for a variety of conditions including RSV and the common cold. The main thing we would do differently in the future is that Scott should have masked the very first night he had symptoms of RSV, and he has decided that he’ll be masking any time he’s in the same room as someone who’s been coughing, as that’s considerably less annoying than being sick. (He really did not like the experience of having RSV.) I obviously did not get it from that first night when he first had the most minor symptoms of RSV, but that was probably the period of highest risk of transmission of either week, given the subsequent precautions we took after that.
 It sounds nice. Hopeful. Productive. It implies the lemons are gently handed to you. They’re probably clean, ripe, and maybe sitting in a cute little basket. Like life’s just giving you a quirky unexpected opportunity.
 And sometimes people do. That’s valid. Sometimes I’ve done that.
 Forget the default script. There’s no “right” way to respond.
 This has become a long post, with no clear messages or resolutions, which in of itself is an example of these types of situations. Hard, uncertain, messy, no clear ending or answer or what next. But these types of situations happen a lot, more than you know.
 As an example for how I like to disseminate my articles personally, every time a journal article is published and I have access to it, I updated
Recent Comments