In previous years (see 2019 and 2018), I mentioned sharing content from ADA Scientific Sessions (this year it’s #ADA2020) with those not physically present at the conference. This year, NO ONE is present at the event, and we’re all virtual! Even more reason to share content from the conference. 
I contributed to and co-authored two different posters at Scientific Sessions this year:
- “Multi-Timescale Interactions of Glucose and Insulin in Type 1 Diabetes Reveal Benefits of Hybrid Closed Loop Systems“ (poster 99-LB) along with Azure Grant and Lance Kriegsfeld, PhD.
- “Do-It-Yourself Artificial Pancreas Systems for Type 1 Diabetes Reduce Hyperglycemia Without Increasing Hypoglycemia” (poster 988-P in category 12-D Clinical Therapeutics/New Technology—Insulin Delivery Systems), alongside Jennifer Zabinsky, MD MEng, Haley Howell, MSHI, Alireza Ghezavati, MD, Andrew Nguyen, PhD, and Jenise Wong, MD PhD.
And, while not a poster at ADA, I also presented the “AID-IRL” study funded by DiabetesMine at #DData20, held in conjunction with Scientific Sessions. A summary of the study is also included in this post.
—
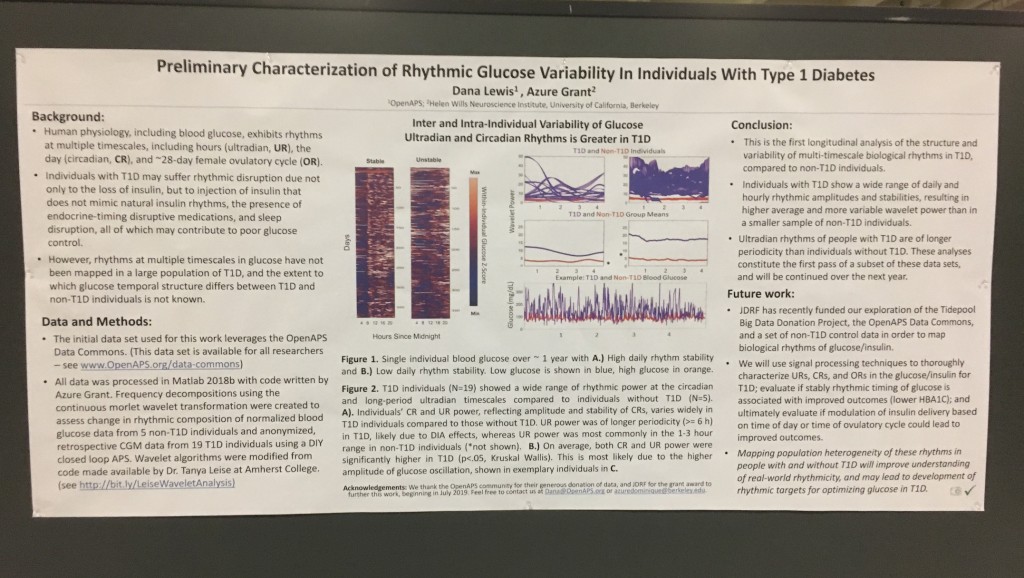
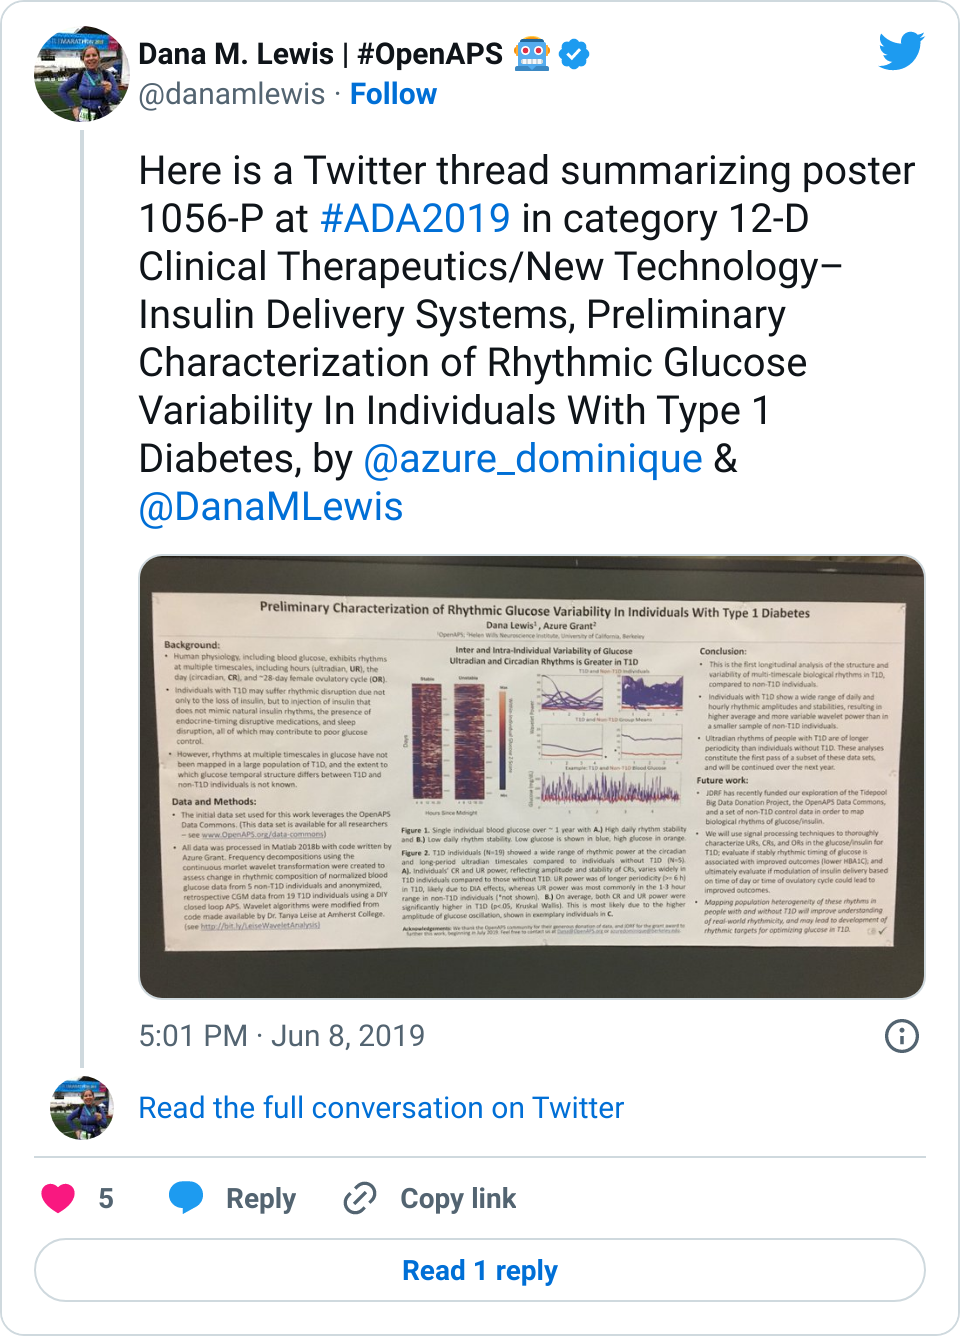
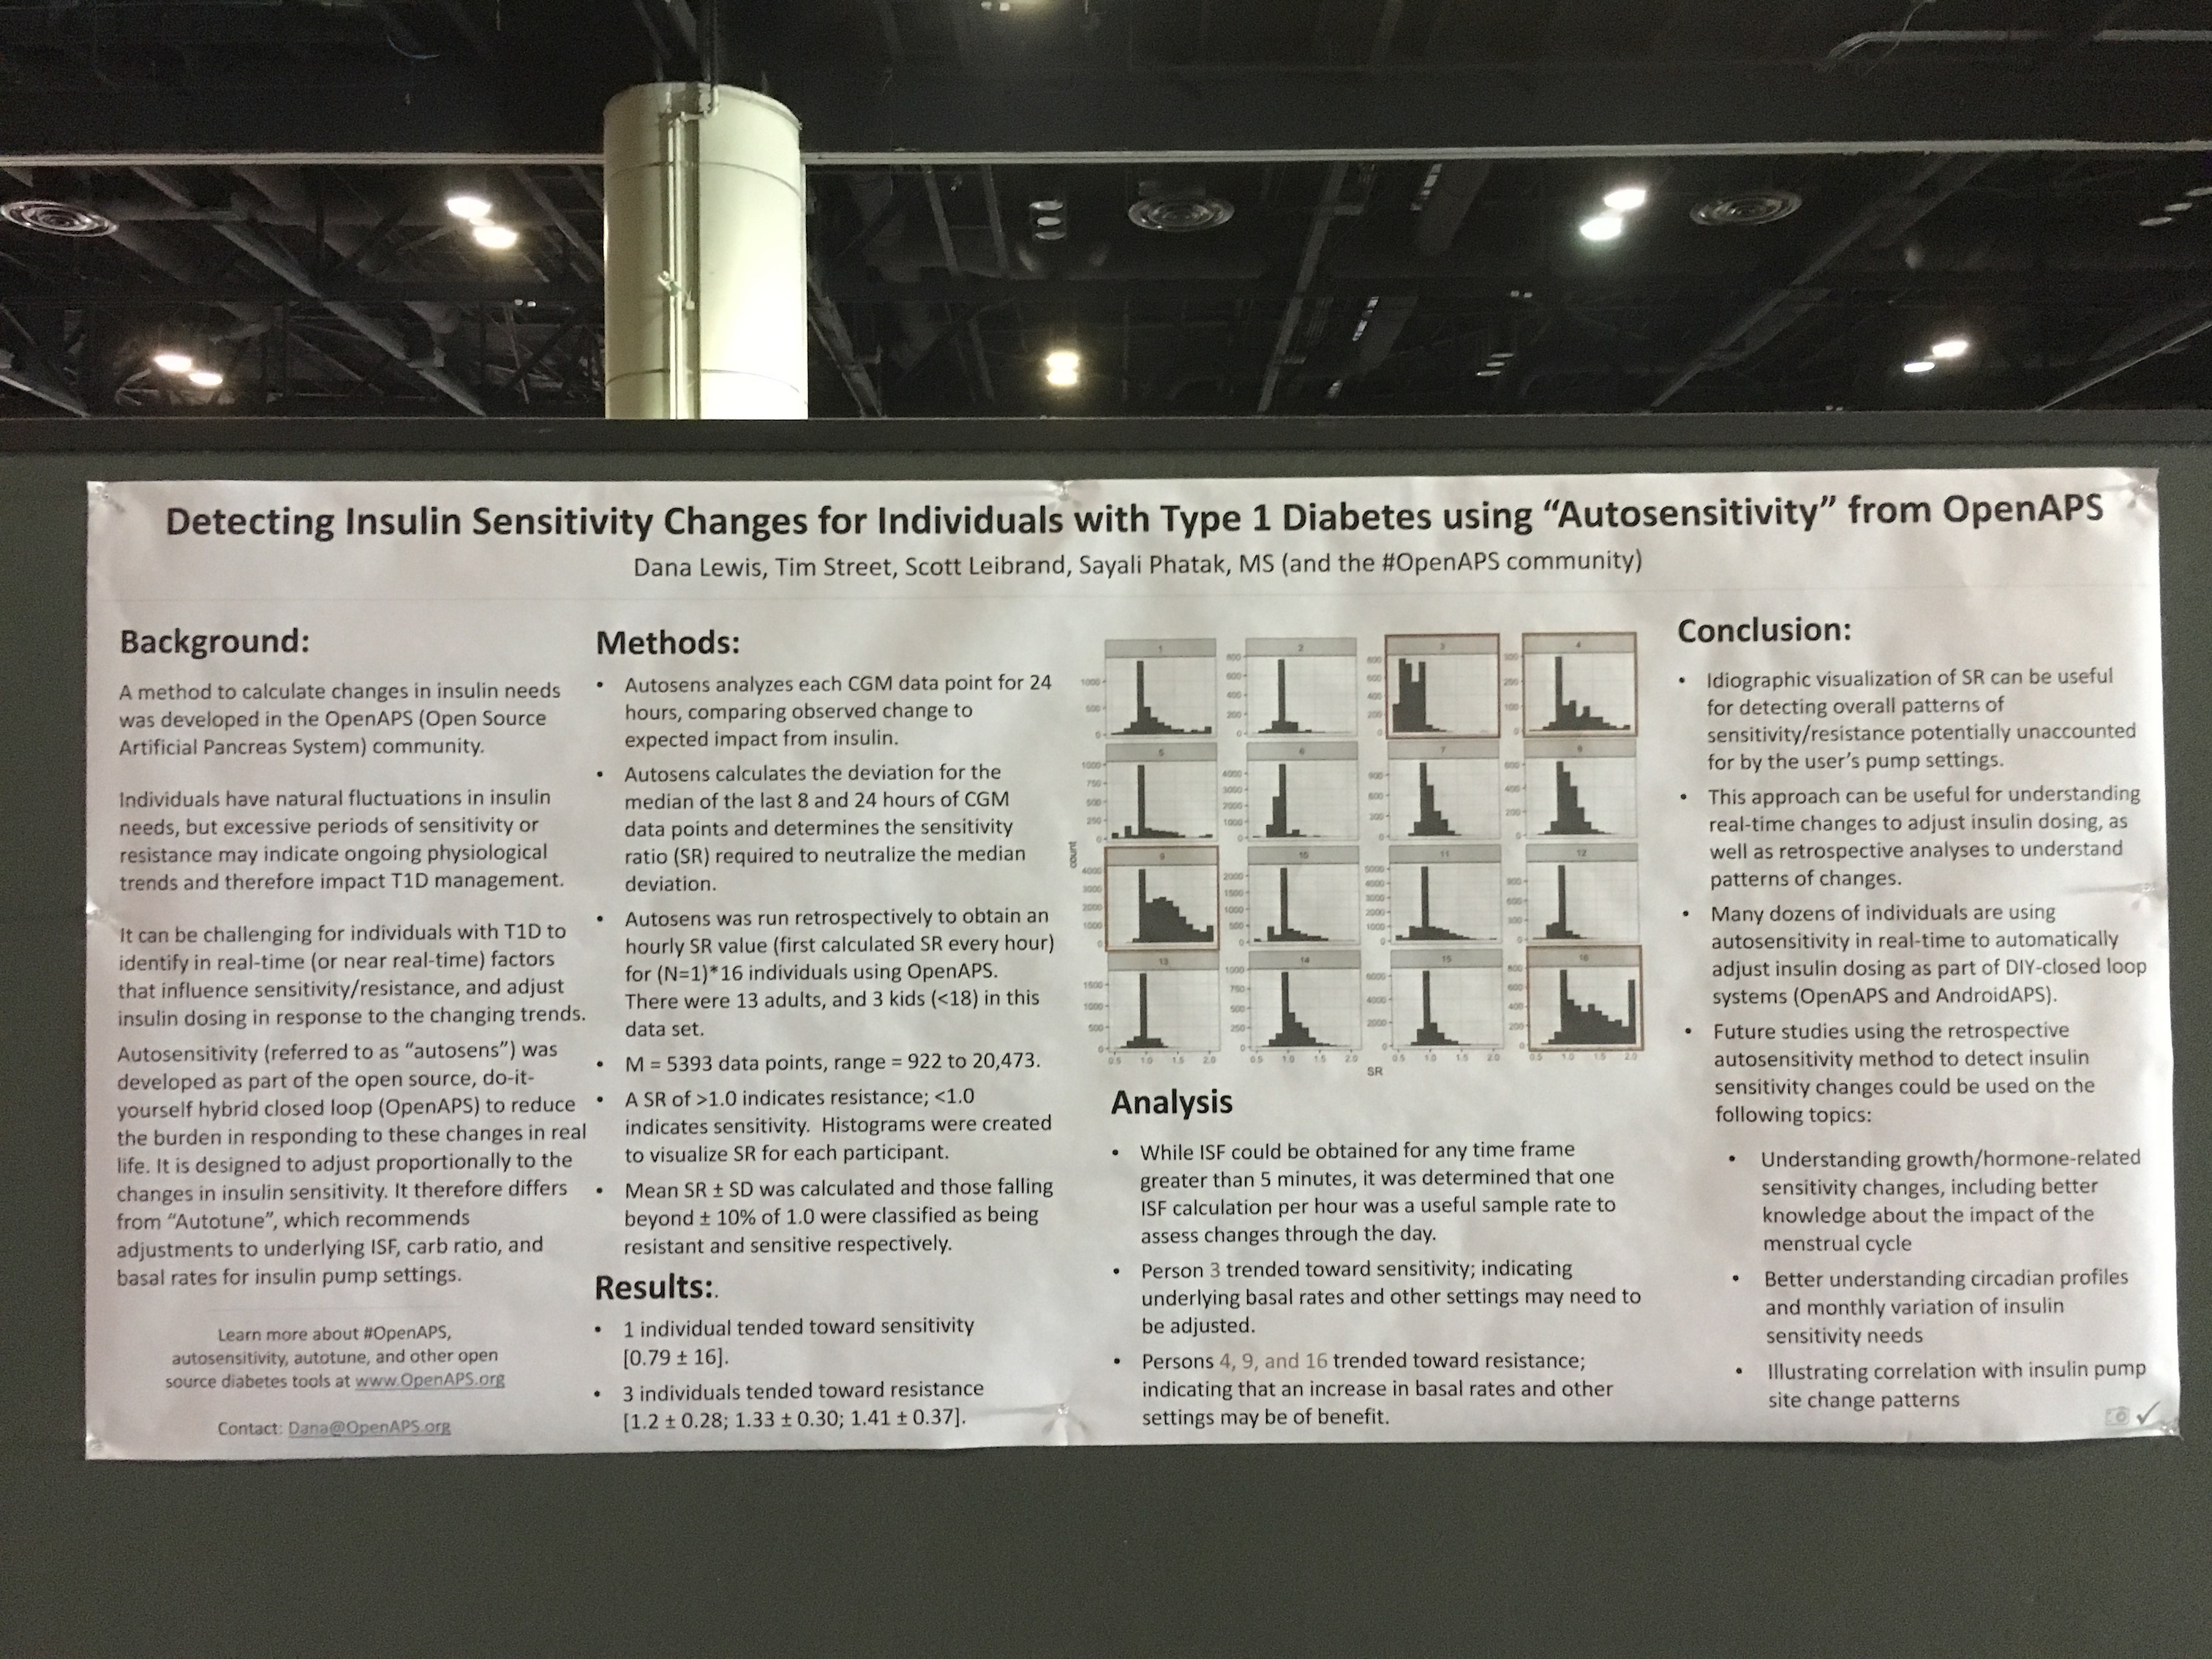
First up, the biological rhythms poster, “Multi-Timescale Interactions of Glucose and Insulin in Type 1 Diabetes Reveal Benefits of Hybrid Closed Loop Systems” (poster 99-LB). (Twitter thread summary of this poster here.)
Building off our work as detailed last year, Azure, Lance, and I have been exploring the biological rhythms in individuals living with type 1 diabetes. Why? It’s not been done before, and we now have the capabilities thanks to technology (pumps, CGM, and closed loops) to better understand how glucose and insulin dynamics may be similar or different than those without diabetes.
Background:
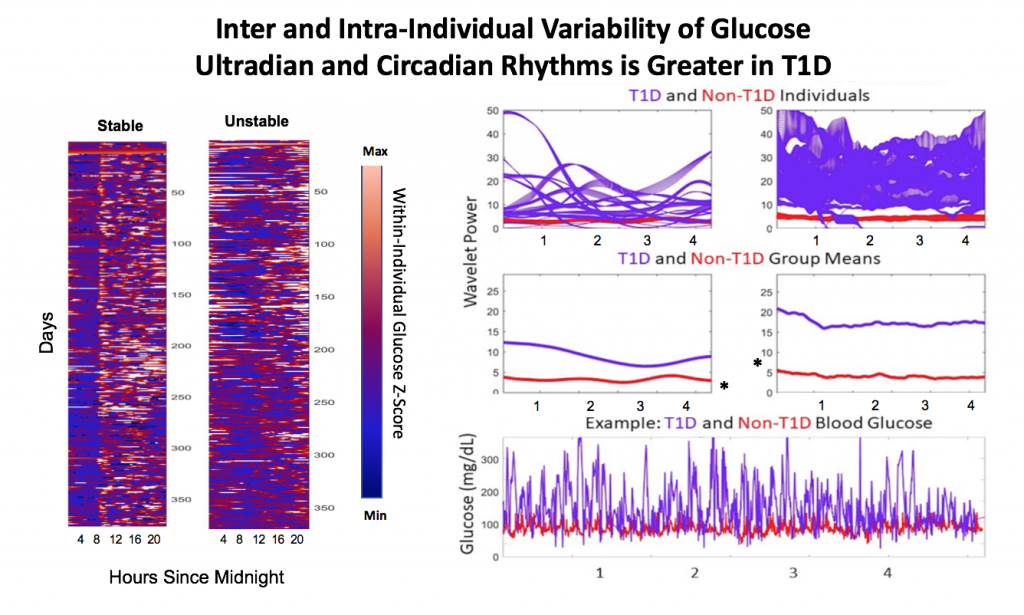
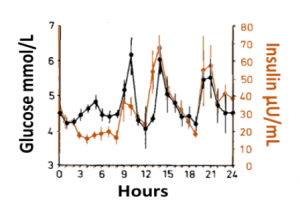 Blood glucose and insulin exhibit coupled biological rhythms at multiple timescales, including hours (ultradian, UR) and the day (circadian, CR) in individuals without diabetes. The presence and stability of these rhythms are associated with healthy glucose control in individuals without diabetes. (See right, adapted from Mejean et al., 1988).
However, biological rhythms in longitudinal (e.g., months to years) data sets of glucose and insulin outputs have not been mapped in a wide population of people with Type 1 Diabetes (PWT1D). It is not known how glucose and insulin rhythms compare between T1D and non-T1D individuals. It is also unknown if rhythms in T1D are affected by type of therapy, such as Sensor Augmented Pump (SAP) vs. Hybrid Closed Loop (HCL). As HCL systems permit feedback from a CGM to automatically adjust insulin delivery, we hypothesized that rhythmicity and glycemia would exhibit improvements in HCL users compared to SAP users. We describe longitudinal temporal structure in glucose and insulin delivery rate of individuals with T1D using SAP or HCL systems in comparison to glucose levels from a subset of individuals without diabetes.
Data collection and analysis:
We assessed stability and amplitude of normalized continuous glucose and insulin rate oscillations using the continuous wavelet transformation and wavelet coherence. Data came from 16 non-T1D individuals (CGM only, >2 weeks per individual) from the Quantified Self CGM dataset and 200 (n = 100 HCL, n = 100 SAP; >3 months per individual) individuals from the Tidepool Big Data Donation Project. Morlet wavelets were used for all analyses. Data were analyzed and plotted using Matlab 2020a and Python 3 in conjunction with in-house code for wavelet decomposition modified from the “Jlab” toolbox, from code developed by Dr. Tanya Leise (Leise 2013), and from the Wavelet Coherence toolkit by Dr. Xu Cui. Linear regression was used to generate correlations, and paired t-tests were used to compare AUC for wavelet and wavelet coherences by group (df=100). Stats used 1 point per individual per day.
Wavelets Assess Glucose and Insulin Rhythms and Interactions
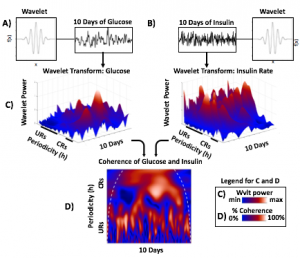
Morlet wavelets (A) estimate rhythmic strength in glucose or insulin data at each minute in time (a combination of signal amplitude and oscillation stability) by assessing the fit of a wavelet stretched in window and in the x and y dimensions to a signal (B). The output (C) is a matrix of wavelet power, periodicity, and time (days). Transform of example HCL data illustrate the presence of predominantly circadian power in glucose, and predominantly 1-6 h ultradian power in insulin. Color map indicates wavelet power (synonymous with Y axis height). Wavelet coherence (D) enables assessment of rhythmic interactions between glucose and insulin; here, glucose and insulin rhythms are highly correlated at the 3-6 (ultradian) and 24 (circadian) hour timescales.
Results:
Hybrid Closed Loop Systems Reduce Hyperglycemia
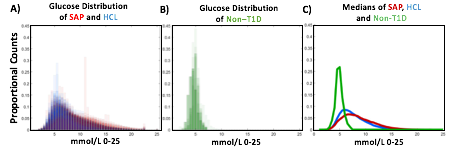
- A) Proportional counts* of glucose distributions of all individuals with T1D using SAP (n=100) and HCL (n=100) systems. SAP system users exhibit a broader, right shifted distribution in comparison to individuals using HCL systems, indicating greater hyperglycemia (>7.8 mmol/L). Hypoglycemic events (<4mmol/L) comprised <5% of all data points for either T1D dataset.
- B) Proportional counts* of non-T1D glucose distributions. Although limited in number, our dataset from people without diabetes exhibits a tighter blood glucose distribution, with the vast majority of values falling in euglycemic range (n=16 non-T1D individuals).
- C) Median distributions for each dataset.
- *Counts are scaled such that each individual contributes the same proportion of total data per bin.
HCL Improves Correlation of Glucose-Insulin Level & Rhythm
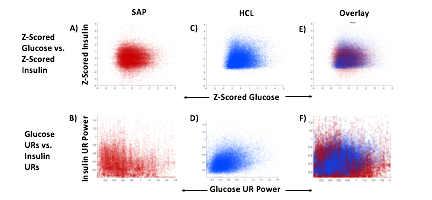
SAP users exhibit uncorrelated glucose and insulin levels (A) (r2 =3.3*10-5; p=0.341) and uncorrelated URs of glucose and insulin (B) (r2 =1.17*10-3; p=0.165). Glucose and its rhythms take a wide spectrum of values for each of the standard doses of insulin rates provided by the pump, leading to the striped appearance (B). By contrast, Hybrid Closed Loop users exhibit correlated glucose and insulin levels (C) (r2 =0.02; p=7.63*10-16), and correlated ultradian rhythms of glucose and insulin (D) (r2 =-0.13; p=5.22*10-38). Overlays (E,F).
HCL Results in Greater Coherence than SAP
Non-T1D individuals have highly coherent glucose and insulin at the circadian and ultradian timescales (see Mejean et al., 1988, Kern et al., 1996, Simon and Brandenberger 2002, Brandenberger et al., 1987), but these relationships had not previously been assessed long-term in T1D.
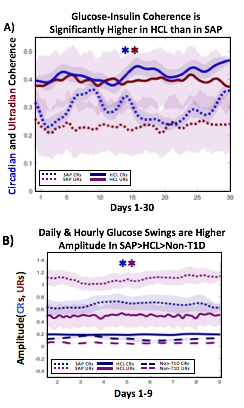 A) Circadian (blue) and 3-6 hour ultradian (maroon) coherence of glucose and insulin in HCL (solid) and SAP (dotted) users. Transparent shading indicates standard deviation. Although both HCL and SAP individuals have lower coherence than would be expected in a non-T1D individual, HCL CR and UR coherence are significantly greater than SAP CR and UR coherence (paired t-test p= 1.51*10-7 t=-5.77 and p= 5.01*10-14 t=-9.19, respectively). This brings HCL users’ glucose and insulin closer to the canonical non-T1D phenotype than SAP users’.
B) Additionally, the amplitude of HCL users’ glucose CRs and URs (solid) is closer (smaller) to that of non-T1D (dashed) individuals than are SAP glucose rhythms (dotted). SAP CR and UR amplitude is significantly higher than that of HCL or non-T1D (T-test,1,98, p= 47*10-17 and p= 5.95*10-20, respectively), but HCL CR amplitude is not significantly different from non-T1D CR amplitude (p=0.61).
Together, HCL users are more similar than SAP users to the canonical Non-T1D phenotype in A) rhythmic interaction between glucose and insulin and B) glucose rhythmic amplitude.
Conclusions and Future Directions
T1D and non-T1D individuals exhibit different relative stabilities of within-a-day rhythms and daily rhythms in blood glucose, and T1D glucose and insulin delivery rhythmic patterns differ by insulin delivery system.
Hybrid Closed Looping is Associated With:
- Lower incidence of hyperglycemia
- Greater correlation between glucose level and insulin delivery rate
- Greater correlation between ultradian glucose and ultradian insulin delivery rhythms
- Greater degree of circadian and ultradian coherence between glucose and insulin delivery rate than in SAP system use
- Lower amplitude swings at the circadian and ultradian timescale
These preliminary results suggest that HCL recapitulates non-diabetes glucose-insulin dynamics to a greater degree than SAP. However, pump model, bolusing data, looping algorithms and insulin type likely all affect rhythmic structure and will need to be further differentiated. Future work will determine if stability of rhythmic structure is associated with greater time in range, which will help determine if bolstering of within-a-day and daily rhythmic structure is truly beneficial to PWT1D.
Acknowledgements:
Thanks to all of the individuals who donated their data as part of the Tidepool Big Data Donation Project, as well as the OpenAPS Data Commons, from which data is also being used in other areas of this study. This study is supported by JDRF (1-SRA-2019-821-S-B).
(You can download a full PDF copy of the poster here.)
—
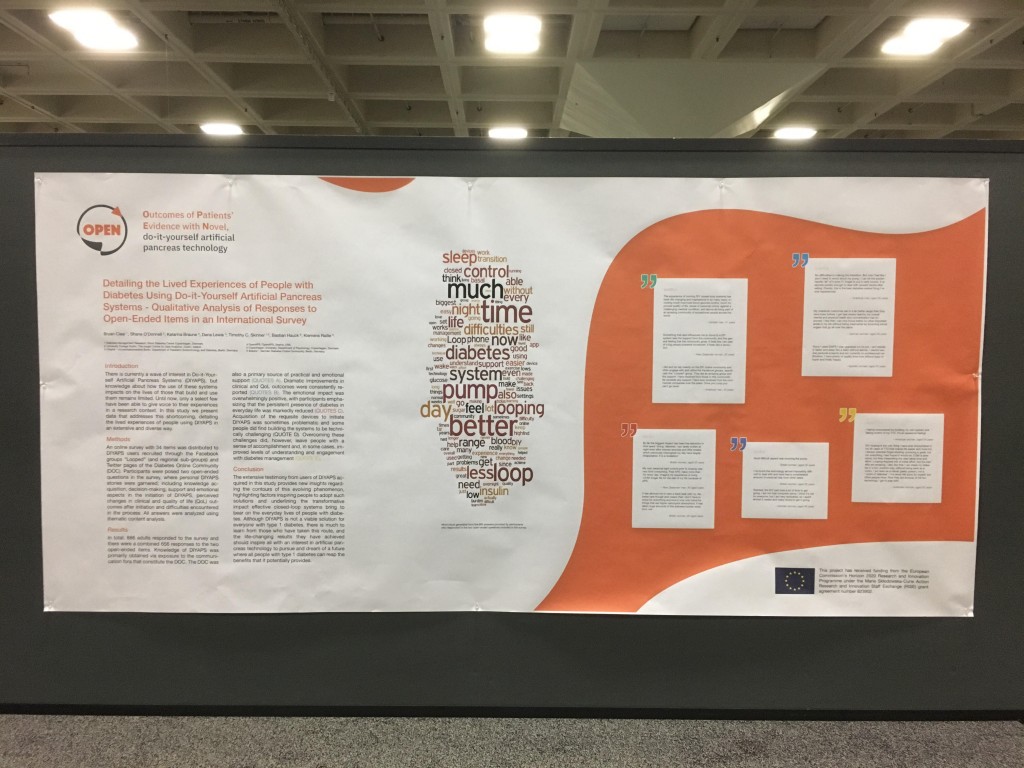
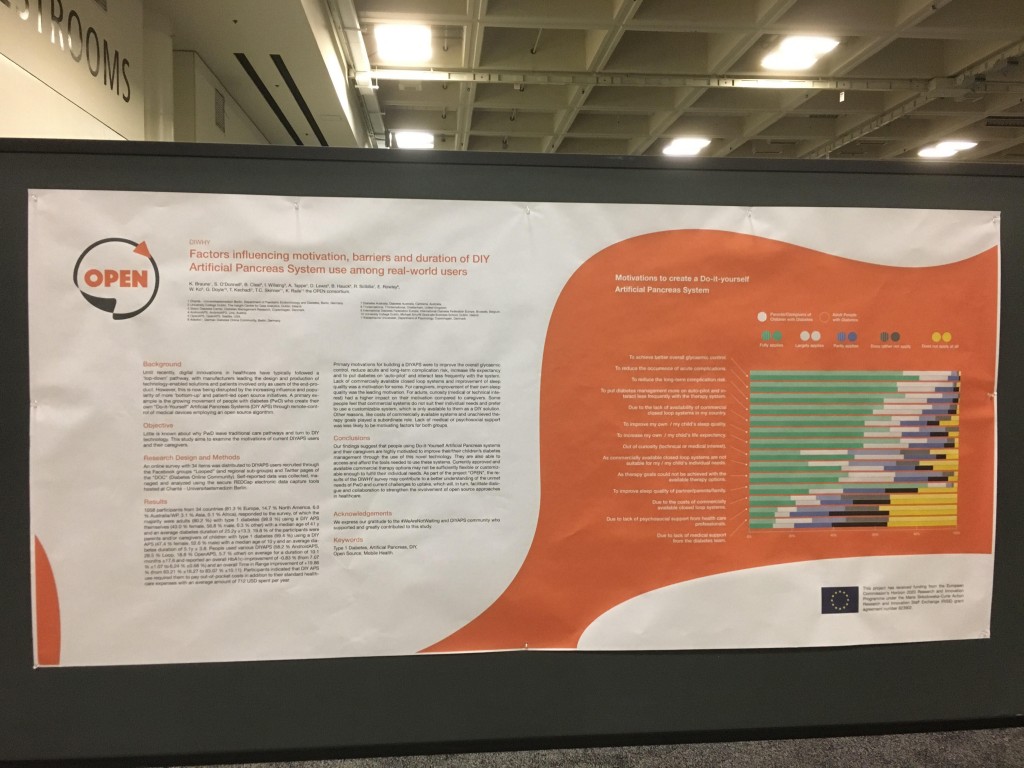
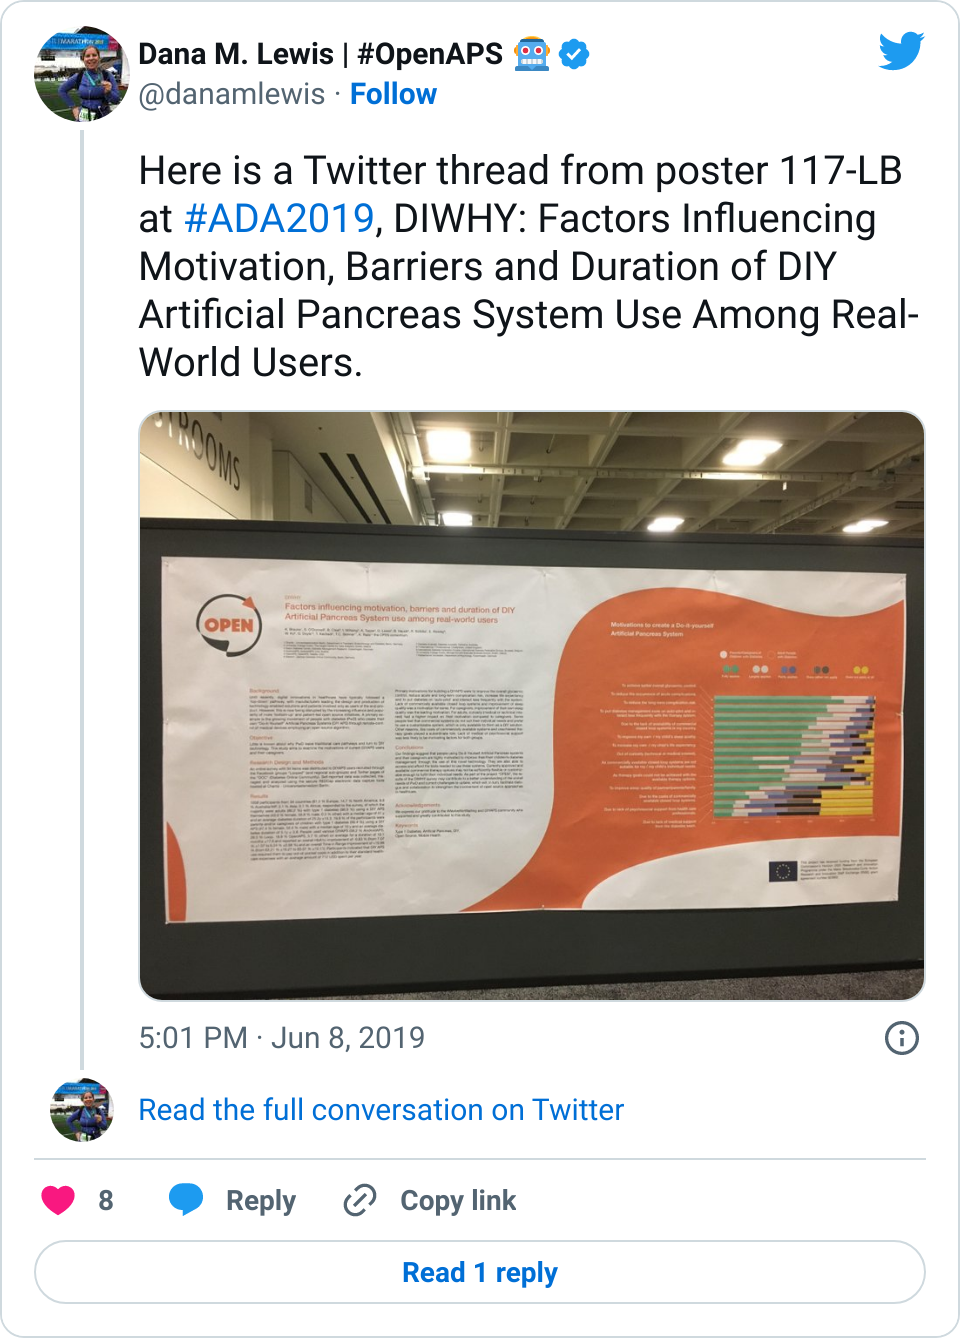
Next is “Do-It-Yourself Artificial Pancreas Systems for Type 1 Diabetes Reduce Hyperglycemia Without Increasing Hypoglycemia” (poster 988-P in category 12-D Clinical Therapeutics/New Technology—Insulin Delivery Systems), which I co-authored alongside Jennifer Zabinsky, MD MEng, Haley Howell, MSHI, Alireza Ghezavati, MD, Andrew Nguyen, PhD, and Jenise Wong, MD PhD. There is a Twitter thread summarizing this poster here.
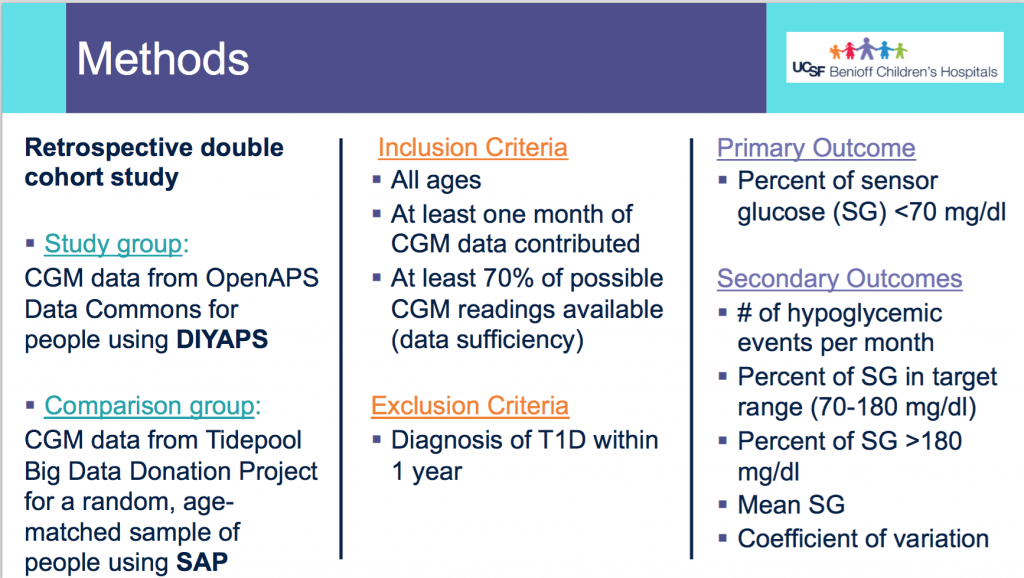
This was a retrospective double cohort study that evaluated data from the OpenAPS Data Commons (data ranged from 2017-2019) and compared it to conventional sensor-augmented pump (SAP) therapy from the Tidepool Big Data Donation Project.
Methods:
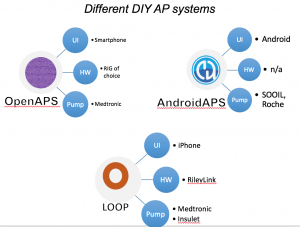
- From the OpenAPS Data Commons, one month of CGM data (with more than 70% of the month spent using CGM), as long as they were >1 year of living with T1D, was used. People could be using any type of DIYAPS (OpenAPS, Loop, or AndroidAPS) and there were no age restrictions.
- A random age-matched sample from the Tidepool Big Data Donation Project of people with type 1 diabetes with SAP was selected.
- The primary outcome assessed was percent of CGM data <70 mg/dL.
- The secondary outcomes assessed were # of hypoglycemic events per month (15 minutes or more <70 mg/dL); percent of time in range (70-180mg/dL); percent of time above range (>180mg/dL), mean CGM values, and coefficient of variation.
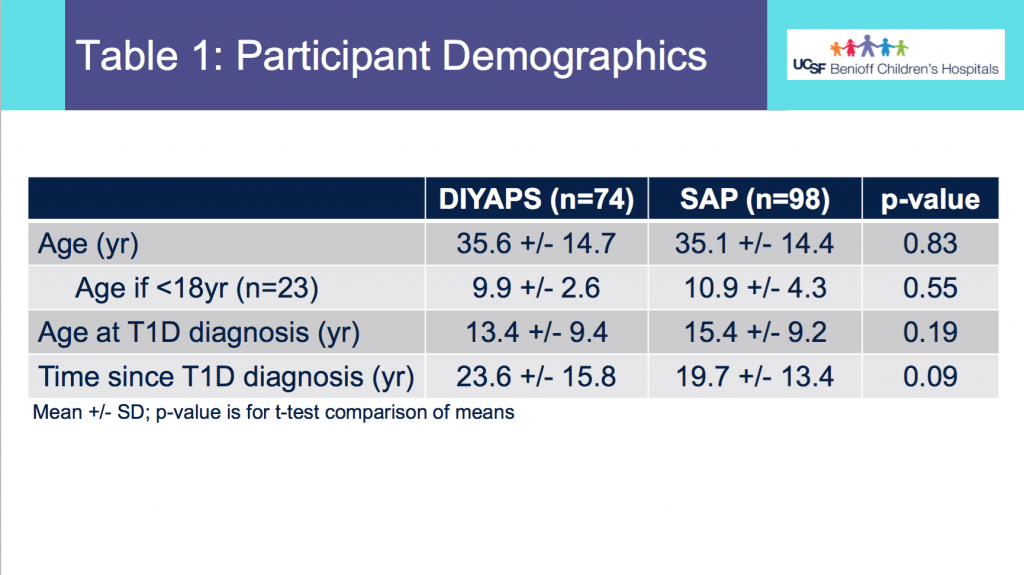
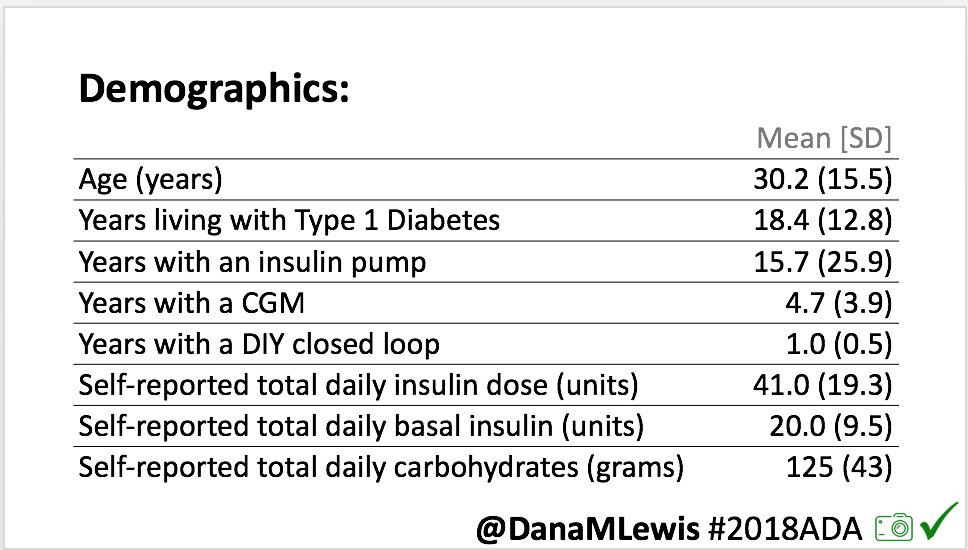
Demographics:
- From Table 1, this shows the age of participants was not statistically different between the DIYAPS and SAP cohorts. Similarly, the age at T1D diagnosis or time since T1D diagnosis did not differ.
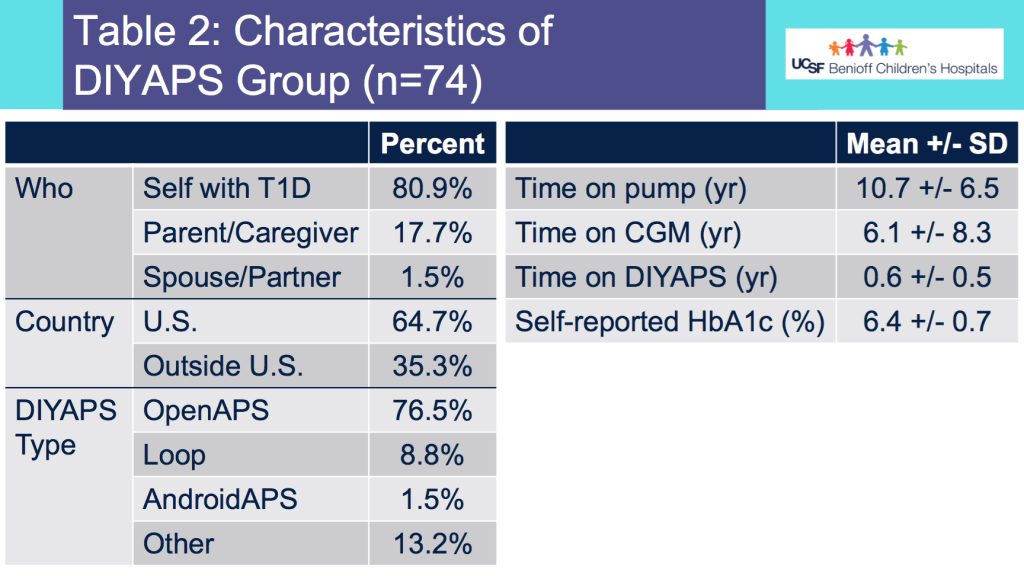
- Table 2 shows the additional characteristics of the DIYAPS cohort, which included data shared by a parent/caregiver for their child with T1D. DIYAPS use was an average of 7 months, at the time of the month of CGM used for the study. The self-reported HbA1c in DIYAPS was 6.4%.
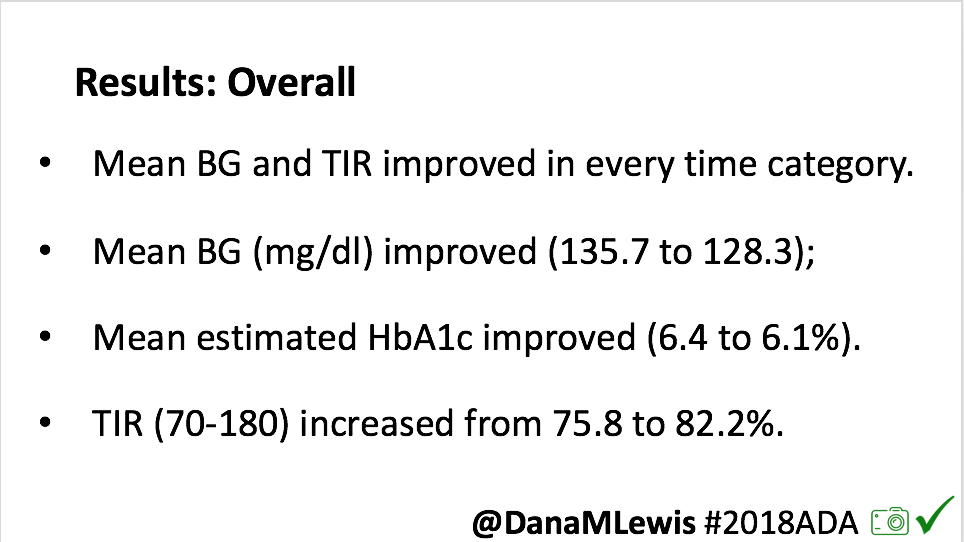
Results:
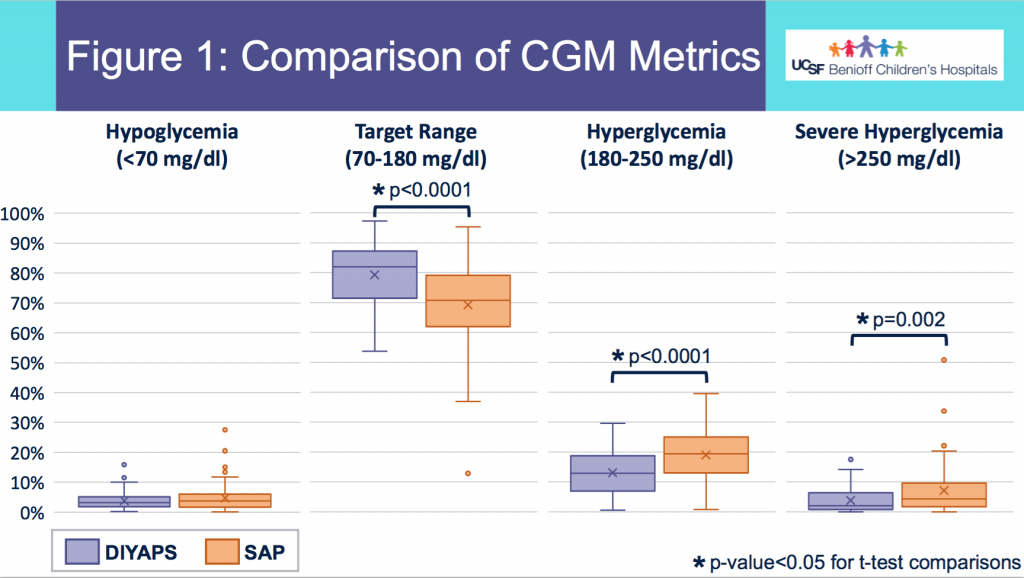
- Figure 1 shows the comparison in outcomes based on CGM data between the two groups. Asterisks (*) indicate statistical significance.
- There was no statistically significant difference in % of CGM values below 70mg/dL between the groups in this data set sampled.
- DIYAPS users had higher percent in target range and lower percent in hyperglycemic range, compared to the SAP users.
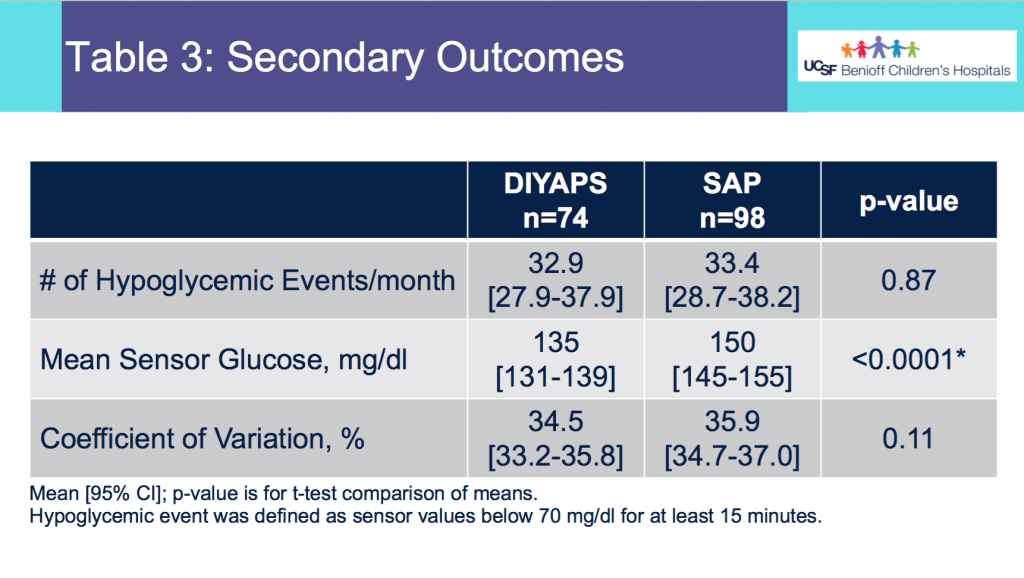
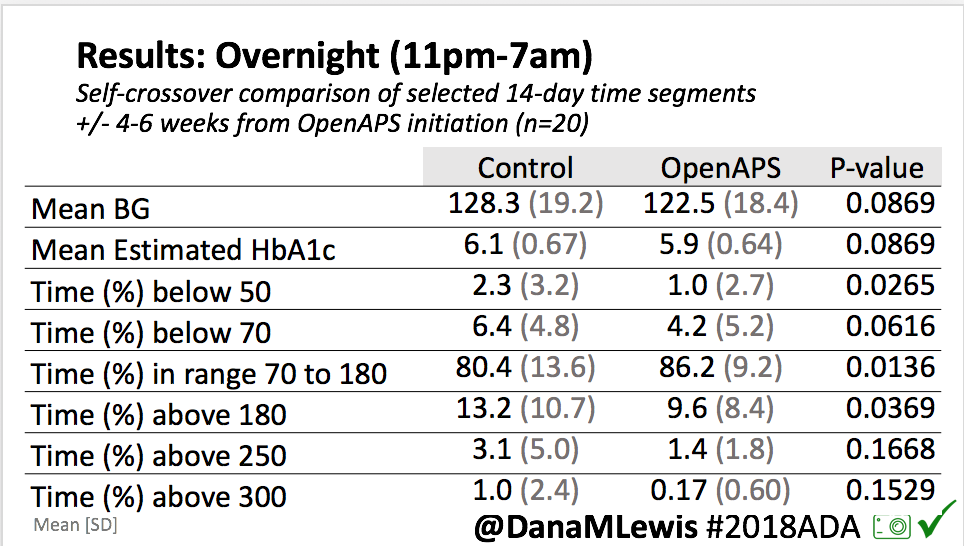
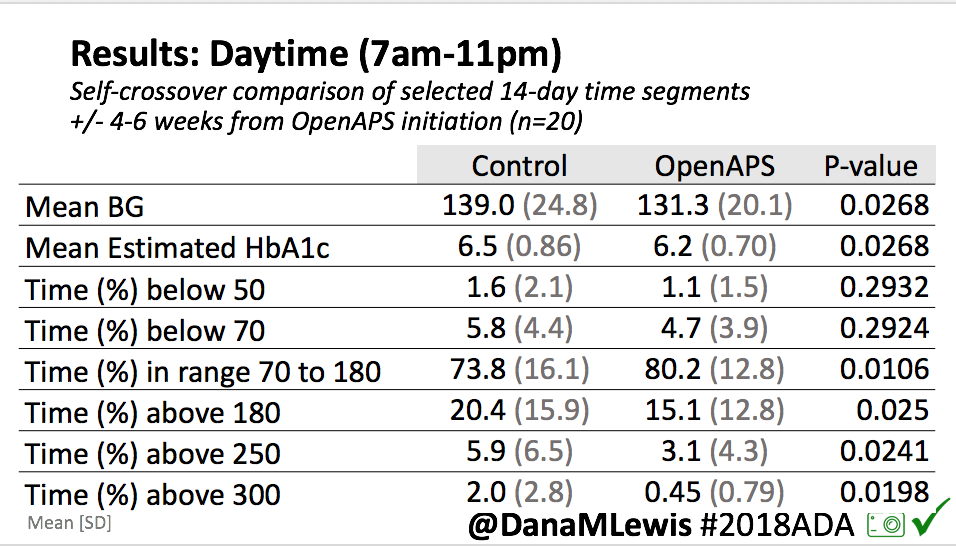
- Table 3 shows the secondary outcomes.
- There was no statistically significant difference in the average number of hypoglycemic events per month between the 2 groups.
- The mean CGM glucose value was lower for the DIYAPS group, but the coefficient of variation did not differ between groups.
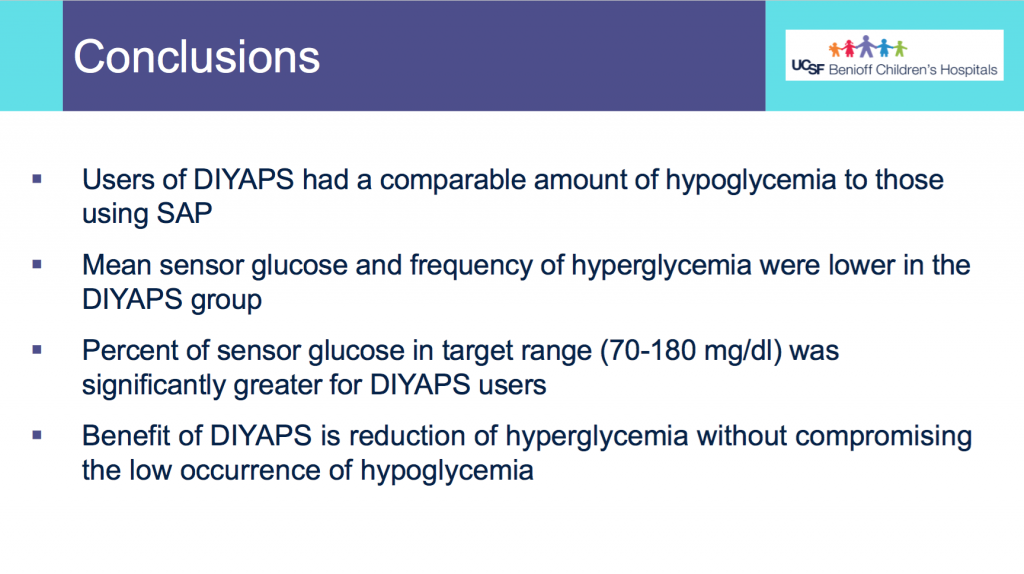
Conclusions:
- Users of DIYAPS (from this month of sampled data) had a comparable amount of hypoglycemia to those using SAP.
- Mean CGM glucose and frequency of hyperglycemia were lower in the DIYAPS group.
- Percent of CGM values in target range (70-180mg/dL) was significantly greater for DIYAPS users.
- This shows a benefit in DIYAPS in reducing hyperglycemia without compromising a low occurrence of hypoglycemia.
(You can download a PDF of the e-poster here.)
—
Finally, my presentation at this year’s D-Data conference (#DData20). The study I presented, called AID-IRL, was funded by Diabetes Mine. You can see a Twitter thread summarizing my AID-IRL presentation here.
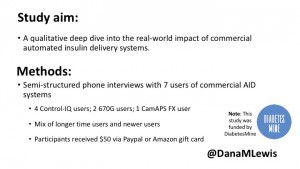
I did semi-structured phone interviews with 7 users of commercial AID systems in the last few months. The study was funded by DiabetesMine – both for my time in conducting the study, as well as funding for study participants. Study participants received $50 for their participation. I sought a mix of longer-time and newer AID users, using a mix of systems. Control-IQ (4) and 670G (2) users were interviewed; as well as (1) a CamAPS FX user since it was approved in the UK during the time of the study.
Based on the interviews, I coded their feedback for each of the different themes of the study depending on whether they saw improvements (or did not have issues); had no changes but were satisfied, or neutral experiences; or saw negative impact/experience. For each participant, I reviewed their experience and what they were happy with or frustrated by.
Here are some of the details for each participant.
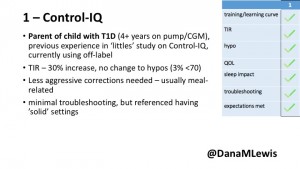
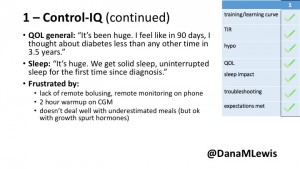 1 – A parent of a child using Control-IQ (off-label), with 30% increase in TIR with no increased hypoglycemia. They spend less time correcting than before; less time thinking about diabetes; and “get solid uninterrupted sleep for the first time since diagnosis”. They wish they had remote bolusing, more system information available in remote monitoring on phones. They miss using the system during the 2 hour CGM warmup, and found the system dealt well with growth spurt hormones but not as well with underestimated meals.
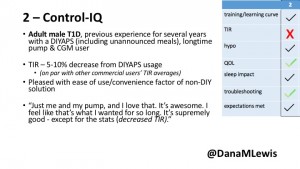
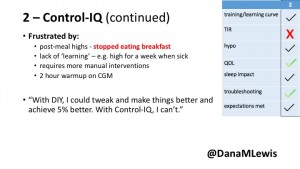 2 – An adult male with T1D who previously used DIYAPS saw 5-10% decrease in TIR (but it’s on par with other participants’ TIR) with Control-IQ, and is very pleased by the all-in-one convenience of his commercial system.He misses autosensitivity (a short-term learning feature of how insulin needs may very from base settings) from DIYAPS and has stopped eating breakfast, since he found it couldn’t manage that well. He is doing more manual corrections than he was before.
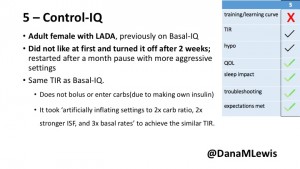
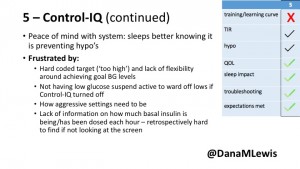 5 – An adult female with LADA started, stopped, and started using Control-IQ, getting the same TIR that she had before on Basal-IQ. It took artificially inflating settings to achieve these similar results. She likes peace of mind to sleep while the system prevents hypoglycemia. She is frustrated by ‘too high’ target; not having low prevention if she disables Control-IQ; and how much she had to inflate settings to achieve her outcomes. It’s hard to know how much insulin the system gives each hour (she still produces some of own insulin).
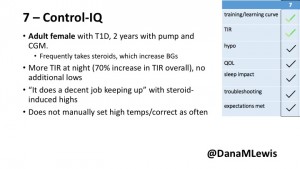
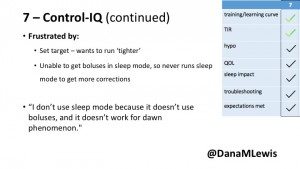 7 – An adult female with T1D who frequently has to take steroids for other reasons, causing increased BGs. With Control-IQ, she sees 70% increase in TIR overall and increased TIR overnight, and found it does a ‘decent job keeping up’ with steroid-induced highs. She also wants to run ‘tighter’ and have an adjustable target, and does not ever run in sleep mode so that she can always get the bolus corrections that are more likely to bring her closer to target.
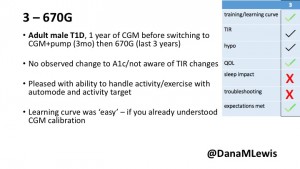
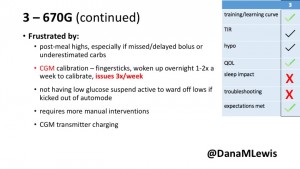 3 – An adult male with T1D using 670G for 3 years didn’t observe any changes to A1c or TIR, but is pleased with his outcomes, especially with the ability to handle his activity levels by using the higher activity target. He is frustrated by the CGM and is woken up 1-2x a week to calibrate overnight. He wishes he could still have low glucose suspend even if he’s kicked out of automode due to calibration issues. He also commented on post-meal highs and more manual interventions.
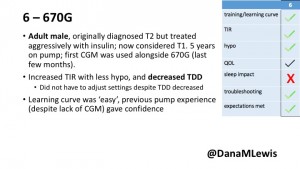
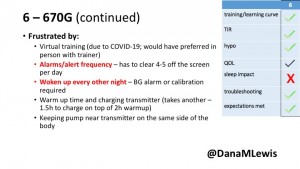 6 – Another adult male user with 670G was originally diagnosed with T2 (now considered T1) with a very high total daily insulin use that was able to decrease significantly when switching to AID. He’s happy with increased TIR and less hypo, plus decreased TDD. Due to #COVID19, he did virtually training but would have preferred in-person. He has 4-5 alerts/day and is woken up every other night due to BG alarms or calibration. He does not like the time it takes to charge CGM transmitter, in addition to sensor warmup.
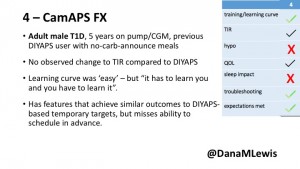
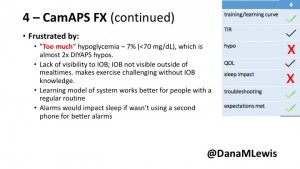 4 – The last participant is an adult male with T1 who previously used DIYAPS but was able to test-drive the CamAPS FX. He saw no TIR change to DIYAPS (which pleased him) and thought the learning curve was easy – but he had to learn the system and let it learn him. He experienced ‘too much’ hypoglycemia (~7% <70mg/dL, 2x his previous), and found it challenging to not have visibility of IOB. He also found the in-app CGM alarms annoying. He noted the system may work better for people with regular routines.
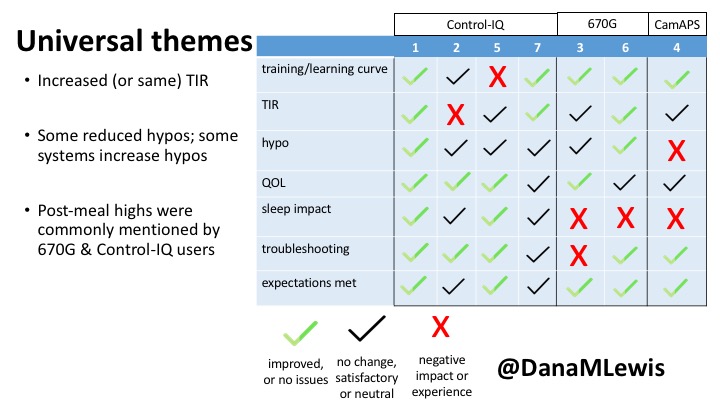
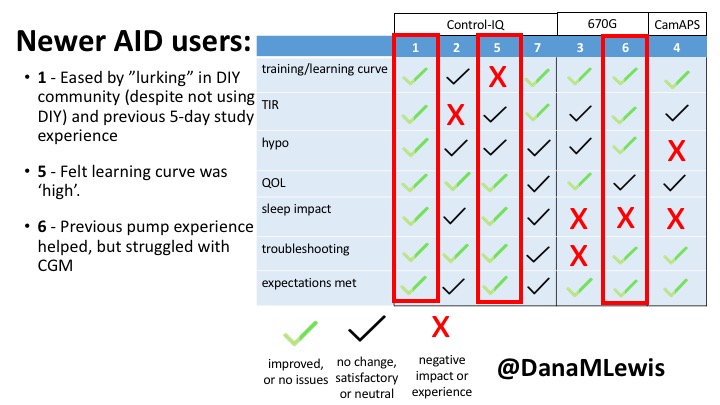
You can see a summary of the participants’ experiences via this chart. Overall, most cited increased or same TIR. Some individuals saw reduced hypos, but a few saw increases. Post-meal highs were commonly mentioned.
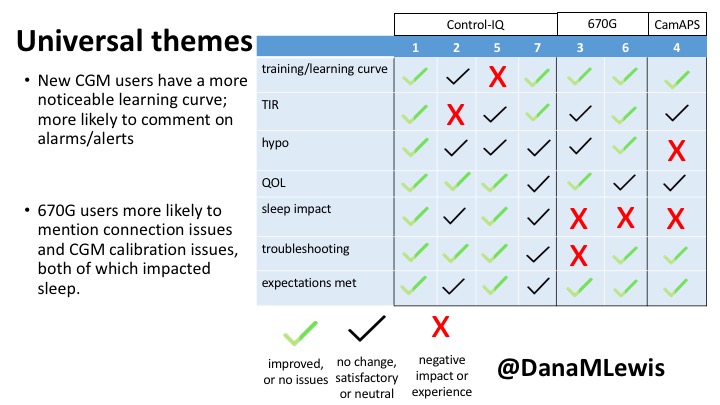
Those newer to CGM have a noticeable learning curve and were more likely to comment on number of alarms and system alerts they saw. The 670G users were more likely to describe connection/troubleshooting issues and CGM calibration issues, both of which impacted sleep.
This view highlights those who more recently adopted AID systems. One noted their learning experience was ‘eased’ by “lurking” in the DIY community, and previously participating in an AID study. One felt the learning curve was high. Another struggled with CGM.
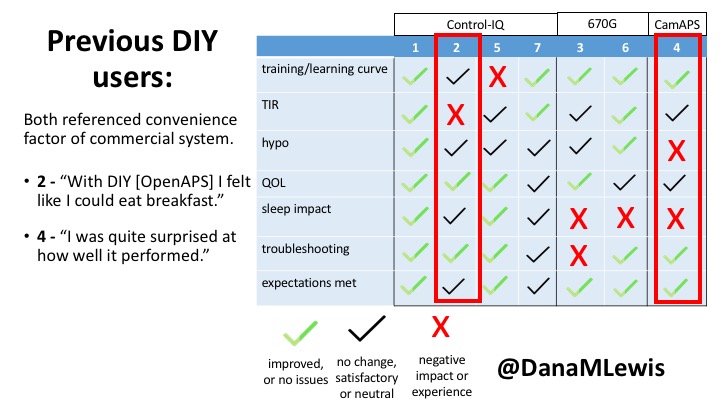
Both previous DIYAPS users who were using commercial AID systems referenced the convenience factor of commercial systems. One DIYAPS saw decreased TIR, and has also altered his behaviors accordingly, while the other saw no change to TIR but had increased hypo’s.
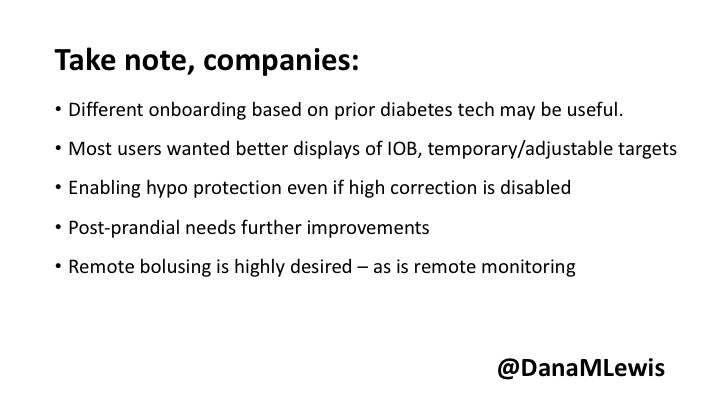
Companies building AID systems for PWDs should consider that the onboarding and learning curve may vary for individuals, especially those newer to CGM. Many want better displays of IOB and the ability to adjust targets. Remote bolusing and remote monitoring is highly desired by all, regardless of age. Post-prandial was frequently mentioned as the weak point in glycemic control of commercial AID systems. Even with ‘ideal’ TIR, many commercial users still are doing frequent manual corrections outside of mealtimes. This is an area of improvement for commercial AID to further reduce the burden of managing diabetes.
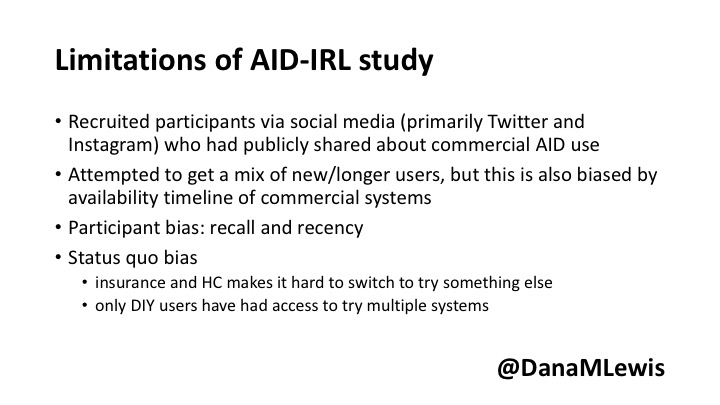
Note – all studies have their limitations. This was a small deep-dive study that is not necessarily representative, due to the design and small sample size. Timing of system availability influenced the ability to have new/longer time users.
Thank you to all of the participants of the study for sharing their feedback about their experiences with AID-IRL!
(You can download a PDF of my slides from the AID-IRL study here.)
—
Have questions about any of my posters or presentations? You can always reach me via email at Dana@OpenAPS.org.

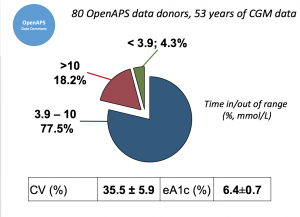 Looking at results for #OpenAPS data donors post-looping initiation, CV was 35.5±5.9, while eA1c was 6.4±0.7. TIR (3.9-10mmol/L) was 77.5%. Time spent >10 was 18.2%; time <3.9 was 4.3%.
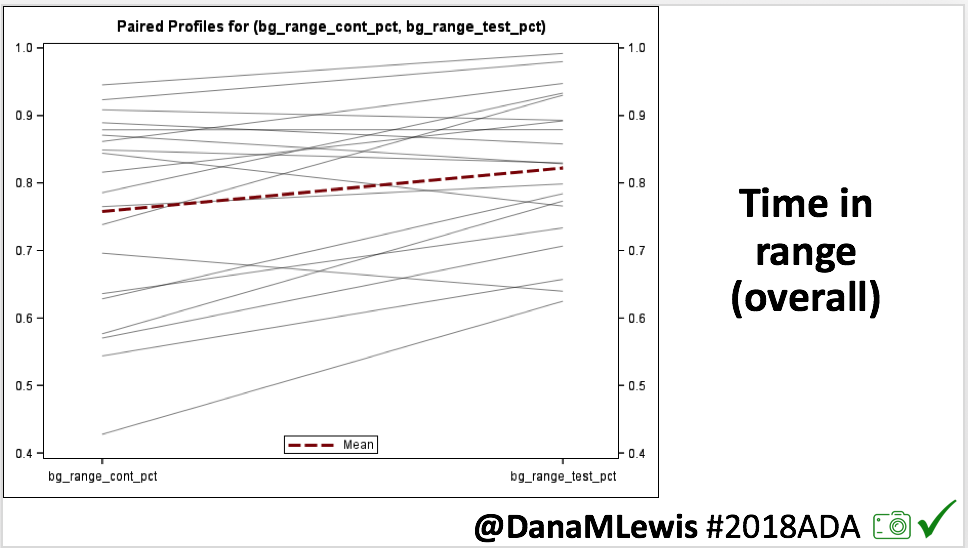
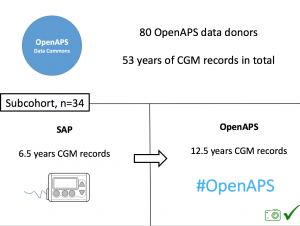 We selected a subcohort of n=34 who had data available from before DIY closed looping initiation (6.5 years combined of CGM records), as well as data from after (12.5 years of CGM records).
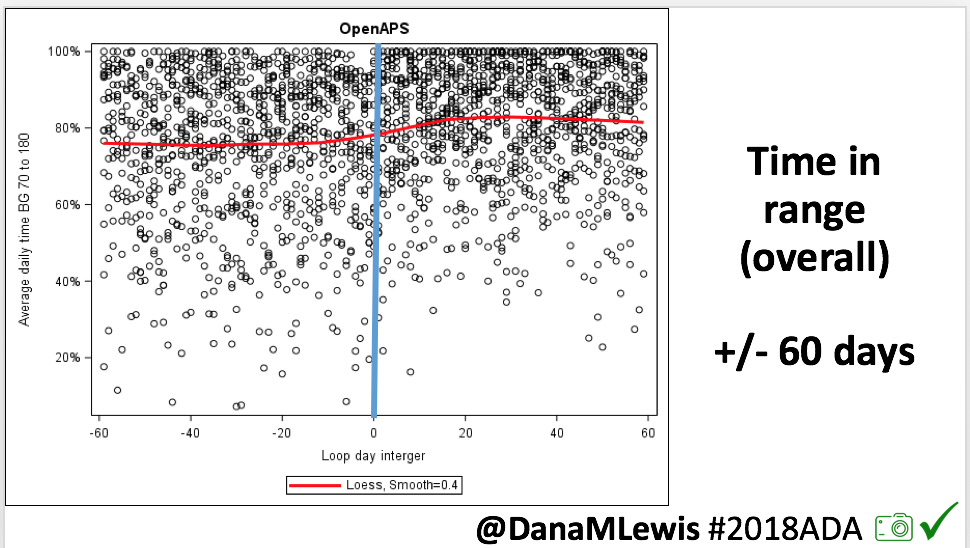
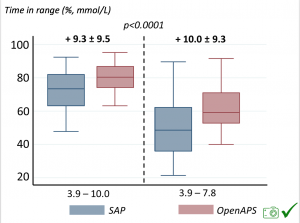 Time in a range significantly increased for both wider (3.9-10 mmol/L) and tighter (3.9-7.8 mmol/L) ranges.
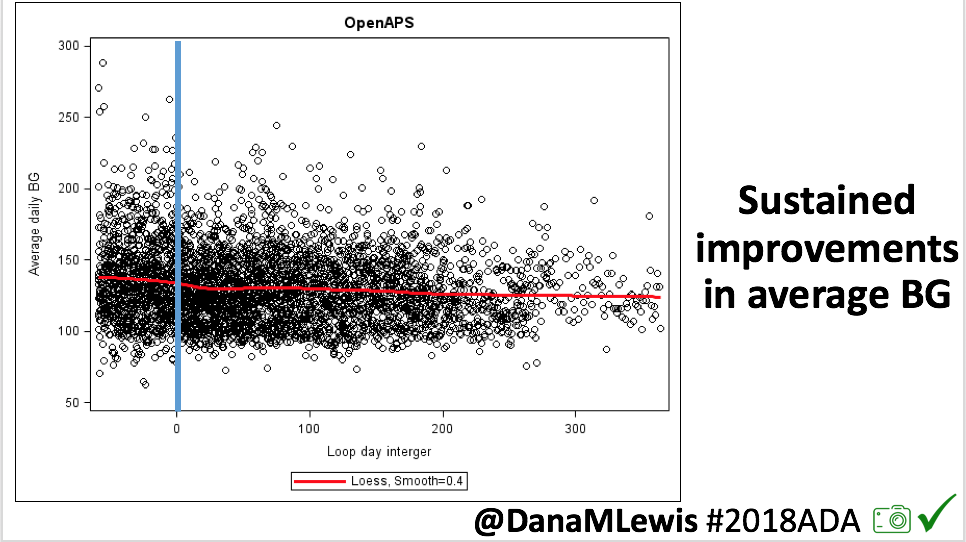
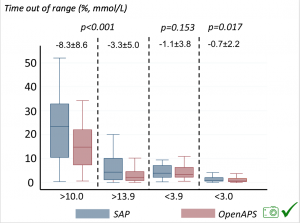 Time spent out of range decreased. % time spent >10 mmol/L decreased -8.3±8.6 (p<0.001); >13 mmol/L decreased -3.3±5.0 (p<0.001). Change in % time spent <3.9 mmol/L (-1.1±3.8 (p=0.153)), and <3.0 mmol/L (-0.7±2.2 (p=0.017)) was not significant.
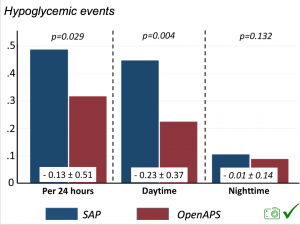 There were less CGM records in the hypoglycemic range after initiating DIYAPS.


Recent Comments