How I work with AI (September 2026) and how I do more types of things with AI than before

I have previously written about how I work with AI and the kinds of things I do with it. Even since I last wrote about that in February, things have changed. A lot. In February, I described creating a hacked-together remote LLM prompting tool to enable me to trigger ongoing use of my LLM while I was away. I didn’t use it much, just occasionally, because it was hacky and required me to set it up in each project I wanted to use it for (by design – for security reasons). But, then remote use came out for most AI agents, and my hacked-together-solution was no longer needed. My use of AI for “laptop tasks” went up dramatically, while my time spent at my laptop physically went down. This was a huge win for me because for various reasons sitting at my laptop is not always feasible. Now, I could be out walking or hiking and keep projects running. I could also be sitting in a different room and also keep projects running, even with my laptop not in reach. This was a big and delightful change for me.

The development of coding ‘agents’ that can go off and do a task as directed, more reliably than before, has also been a huge change and benefit in the last six months, too. (And now, sub-agents! One agent can direct others to run in parallel.)

If you haven’t given it a try, I highly recommend you try some of the coding agents and use them remotely from your phone to see what they can do and what situations you might benefit from using them in.

But it’s not just “work” that I’m doing more of or differently. I’m branching out to solve more and more of my software-shaped-feeling problems. I continue to build custom apps (like Scheduler Pilot and Protocol Pilot – the latter of which is available if anyone else needs/wants an app to help with tracking and titrating medications) at the drop of the hat. Collectively, I have over half a dozen custom apps I use *daily* which really surprises me (that I have and use so many). Some I only need to use once a week or so, but several I use daily.

I’ve also been able to drastically improve other existing custom apps I have. One big example is Baseline Pilot, which I built last year to enable Scott and me to share our biometric data every morning. For the last ~10 months or so, that has involved us manually opening the app and hitting a button to export the data, and the other person clicking it and opening the app to load it in. It was revolutionary at the time, but it required manual effort on both sides. Recently, though, I had to deploy a server for a work project (which, hello imposter syndrome, I’ve never done before) and do all kinds of technical stuff that I am hugely intimidated by (or – was!) and was still able to do. Because of that, I lowered the friction / barrier to entry for other projects to use a server for data storage and data transfer. As a result, I ended up building a family-focused 3D printing management app so that multiple people in the family could submit files to the person in the family who has a 3D-printer (and so they could access the files in one place and put them in queue etc). That was intimidating, but I had figured out how to do that, so the next thing on my mind after work use and the 3D printing management app use was to then think about if this would solve my manual-click burden for Baseline Pilot. And the answer was yes. Using the same infrastructure that I had set up for the other projects, I was able to quickly (less than an hour) get Baseline Pilot set up to load data into the database in the server and pull down to my and Scott’s apps – automatically – without having to click to share data every day (and click to import the other person’s data every day). It…just works! I open Baseline Pilot and see Scott’s data, without him ever clicking and exporting the data. Woohoo! It thrills me every day for the past several days to open the app and see the data. (And yes, I have it set up where it will send me a push notification for any data above the cutoff I specified, eg >3 standard deviations from normal on key metrics).

I also built a new app called RoutePilot, which allows someone to pull in completed workouts from Apple Health and see if any run intervals were detected. This way, someone learning to run and doing run/walk intervals can track how much running they did without having to hit things on their watch or phone to manually track it while they’re doing it. Because I built this and was showing it to Scott, he realized some of my visuals gave him ideas for how he might use some of this to create cool displays to show pace versus distance PRs of different segments, both for retrospective analysis (my app’s original intent) but also live during a run. This then evolved as we realized this was useful for our serial hiking when we repeat hike routes and find it motivating (sometimes) to know if we are near or above our previous best for a route, so we added in some neat hiking features too. Just yesterday while out hiking, we were doing a “new” route, where we did a hike we’ve done before as a loop but in the reverse direction. Scott wasn’t aware on the way down/back which connecting trails we were taking. It wasn’t as easy as he wanted to be able to adapt the route we had plugged into the app. I suggested being able to load the trail maps and tapping the segments to quickly build a route, that way we could see it’s distance and elevation. He set the agents off and by the time we were home, it was built. Today, I picked up his code and worked on it some more, solving some bugs to allow me to connect segments in different ways, improving the look of it, and adding additional features to this. This type of project used to take us months. Now it’s minutes/hours/days instead of days/weeks/months.

It’s very cool to use AI to help me learn to do new things and then be able to take those skills or awareness of what is possible and apply it to more and more projects. Plus, because I am getting more done on ‘work’ and ‘personal projects’ (using quotes because as an independent researcher there’s a lot of overlap, some unfunded projects are also work), I have more momentum and energy for other things in my life, too.

One surprising example is that I am cooking a lot more. But not just because I have more time. It’s mostly because I have figured out what kind of feedback and input I can get from an LLM to make it easier for me to cook. This actually started by getting Scott to help me cook more. I would figure out what we wanted to make; plan and buy the ingredients (e.g. put them in our grocery delivery); decide what day we wanted to make it; put time or a request for time on the calendar to do it; then tell Scott what I wanted him to prep or get out to help me. Sometimes I’d then do the ‘cooking’ or baking, and other times I’d have him do it all. He gave me feedback on what methods were most helpful – which is a preferred style of listing ingredients in the recipe and certain steps he wanted spelled out. We began using a shared project folder in our LLM of choice where he could see recipes that I customized in the format of his preference. He also liked being able to ask it questions as he went, whether it was converting units on the fly or what cooking instrument to use (e.g. spoon versus whisk, etc). Then at the end, we’d update the recipe for next time to include all the decisions we made and tweaks to the methods or ingredients, so we had a better working artifact (err, recipe) for next time if we made it again. This iterative feedback process made him more willing to do this and it made it easier for me to start exploring other recipes we could make this way, too. I began to be more ambitious with finding varieties of the things we already liked. I even was ambitious and after eating something at a restaurant I really, really liked, had my LLM look up and find the original recipe and then help me adapt it.

(We do a lot of adapting of recipes. First, because I have celiac and I’m gluten free. Second, because we are fairly minimalist and are happy to use frozen pre-chopped or canned vegetables or other ingredients like that when possible. The lovely thing about talking to an LLM to convert a recipe is to say “we have X, Y, Z – use that” even if the original recipe called for something else, or to ask if it B works as a substitute for A or not, and what the tradeoffs are if we used it anyway. This is helping me overcome some of the stigma I faced earlier in life when talking to other people about the hardships I found cooking – some of which was because cooking for 1 person was hard, some of which was because there were far fewer gluten free options or substitutes a decade ago, some of which is because modern technology is awesome and now there’s fantastic options like more canned and frozen pre-chopped vegetables (frozen pre-chopped onions! Frozen cubes of garlic or ginger!) that didn’t exist back when I first started. I have had family members and friends be fairly dismissive when I talked about how I found it challenging to cook the way they did. Which was frustrating because it always felt like a moral failing on my part when in reality I had more barriers and fewer resources accessible to me. Now, the resources are all here – more GF options, more general resources like frozen pre-cut veggies, and LLMs to help me work through recipes and oops I did X instead of Y how do I fix or address that or does it matter? Some of this is AI and some of this is just nice growth in food resources coming together at the same time.)

I am also using AI to create art. Except, put down your torches and pitchforks, please. Not in the way that statement might bring to mind (the way that people have knee-jerk reactions to). I am painting with acrylics on canvas, by hand. But, I use AI quite a bit in the process. I usually find a painting that I like and ask AI to help me adapt a reference painting that is in my skill level (e.g. beginner or advanced beginner), so I have something to work from. Or, I’ll give it a photo from a hike that we did and ask for it to turn it into a reference painting for me. Then, I paint. I take pictures of my canvas as I go and sometimes upload them and ask it for feedback on a specific area or overall, or ask it to give me suggestions on what order to create my painting in. That’s actually how I started, because as someone with no exposure to painting before, I had no idea where to start! I would ask it to give me a step by step high level approach to the painting, and would follow that. (Obvious things like working back to front, starting with the sky etc, in a landscape are not obvious when you are a 100% beginner). Eventually I learned additional ways to get help with my painting. I sometimes ask it to give me advice on fixing a color, or how to mix a color, given the paint options that I have. Other times I’ll ignore the original reference and just tell it to focus on my work in progress picture and give me high level feedback. It’s been incredibly helpful to me and has facilitated me painting >30 paintings in the last year or so since I started painting. It’s really useful for customizing feedback to where I am, skill-wise. I also ask it sometimes to assess my portfolio and give suggestions for what skills to work on or document what progress I’ve made on existing skills I’ve been working on. That’s also helpful for seeing where you do have actual skills already (or strong skills compared to others), so you don’t just feel overwhelmed and inept all of the time. You can drill in or scale out, feedback wise, and you can ask it over and over again if you are stuck on painting something and can’t get it quite right. It doesn’t get bored, it doesn’t (openly) judge you – unless you ask it to, and it’s nice to be able to have something to give feedback and input on the specific things I want input for. It’s better than the next available human, because I don’t have a next available human who is interested in my hobby project. (Scott, who occasionally gives surprisingly prescient feedback especially about color values in a way that my eyes/brain don’t intuit the same way, isn’t always available or interested to the degree that I am interested in this – so LLMs often win for iterative feedback in the absence of an available, interested human).
How I use AI in September 2026 to do more types of things than ever before. A blog post by Dana M. Lewis on DIYPS.orgBoth cooking and art are examples of things where AI facilitates me to do a lot more than ever before. It’s less surprising that AI has helped me build all kinds of software projects from apps to drug titration tools and simulators. But being able to use AI to interact more with the real world is a use case that I don’t know that I would have predicted, and it’s exciting to see how else it might enable me in the future. There’s probably half a dozen other physical world interactions it’s facilitating for me, too, that I don’t think of as obvious examples. This includes things like giving me feedback on my strength training work to tweaking and improving my spreadsheet where I log and automate filling in my strength training workouts into my other all-activity tracking spreadsheet…it’s a nice mix of physical world and software interactions that all are making my life easier and better than before.

If you have cool, surprising uses of AI helping you in the physical world, I’d love to hear about them! Send me (or comment) your ideas and experiences.


Protocol Pilot – an app to track medications

I originally built Protocol Pilot for myself, to keep track of a complicated medication trial that involved slowly ramping up my dosing and keeping track of side effects & my resulting experience (hopefully, improvements). It was really helpful, and as I used it I added in a bunch of other features to make it easier to track things. I also realized that sometimes I wouldn’t want to have a day that followed the next level of the plan, or was in a different order, etc, so I ended up making the app more flexible to allow me to log what I did however I did it.

I mentioned it to a friend who was curious if it would work for her purpose (trying a taper – the opposite of what I was doing – of a different medication), so I added a few more features and put it into TestFlight. (If you want to try it, you can! Send me an email to Dana+ProtocolPilot@OpenAPS.org or message me wherever you usually talk to me, and I can send you the link to download it.)

I’ve been surprised at how useful Protocol Pilot has been, for several different use cases I’ve had over the years, and maybe some of these match your experiences, too:

  • Have you ever taken an over-the-counter medication and then, a few hours later, tried to remember exactly when you took it?This may be because you have a new injury and you’re trying to stay on top of pain meds or because sometimes you take things regularly (like during your menstrual cycle) but the rest of the time you don’t have to remember to take it at all, because you don’t need it.
  • You need to start a new medication that is known for gastrointestinal (or other) side effects and want to slowly increase your dosing over time to minimize risk of side effects.
  • You are ready to stop taking a medication but you can’t just suddenly stop it, you need to slowly decrease the dose over time.

With Protocol Pilot, you can do all of those things. You can add a medication like Tylenol (acetominophen) or Ibuprofen and log when you take it, when you need it. This way, you can keep track of when you took your last dose. You can also set up a plan, whether that’s increasing or decreasing a med, to help you track as you progress through those different dose changes.

You can log side effects or notes related to your dosing, or none at all. You can also schedule reminders to check in and log how you’re doing overall, however you want to rate that.

Protocol Pilot: tracking medications (sometimes), a blog by Dana M. Lewis on DIYPS.orgThis is all useful because “how has it been going?” and “is this working?” can be hard to answer against everything else you’ve got going on in life, if you don’t have a convenient way that works for you to track it. Protocol Pilot has become the way that works for me – and a few others – to track things. If you want to try it yourself, email me (Dana+ProtocolPilot@OpenAPS.org) and I can give you the (iOS) TestFlight link to try it. And if you try it – I’d love feedback and also feature requests for what would make this helpful for YOUR use case, if it doesn’t hit the spot in the way it’s currently designed.

Why I built another titration tool, this time for titrating subcutaneous IG (ScIG Pilot)

Why is everything a titration problem; why does the traditional healthcare / research system not solve titration for so many therapies; and why do I always find myself having to do it?

Good questions that I won’t answer (because I can’t), but it is a good introduction into what I have been working on. I built a titration simulation tool for clinicians and people who want to explore different adjustments to dosing immunoglobulin, especially through subcutaneous methods. AKA, subcutaneous IG, AKA ScIG (rhymes with “rig”).

What exactly is the problem?

ScIG is studied in very few conditions – the approved FDA indications are generally for PI (primary immunodeficiency) and CIDP (chronic inflammatory demyelinating polyneuropathy). But, ScIG (and IVIG) are used to treat a lot of autoimmune conditions (often used off-label, because the few other conditions studied have a much smaller population studied and lower-quality evidence bases). Thus, there are no approval studies nor good data for these other condition use cases. Instead, there is a smattering of literature showing that occasionally it works here and there. The dosing regimens are based on the PI/CIDP studies and there are very few of those studies beyond product-specific studies. ScIG has mostly been tested at a 7 day interval (meaning once per week) and there’s one study checking to see if you do it every 14 days (every two weeks) but double the dose to maintain the total dose per month, you get about the same outcome…that is, in people with PI, which means they were measuring infections. That doesn’t answer the “does it work” question for most other use cases for ScIG, which is a variety of other autoimmune diseases. It also doesn’t appear that they tested lower doses (?), so we can’t tell if the same dose over 14 days was effective because they doubled the weekly dose for the 14 day regimen they studied.

But does it work well if you do the same dose every 9-10 days? No one can tell you that, it hasn’t been studied, so if a patient is struggling with every 7 days scheduling, they may benefit from a schedule change, but there’s no data or guidance from research for the clinician to help estimate whether that may be ok, or a problem. Or, what happens if you slightly drop your dose by 10mL? Or what happens if you split your dose across 14 days? What happens if your dosing is evenly split over time or very differently split based on the pre-filled cartridges you have available?

Clinicians don’t often seem to prescribe ScIG to very many patients, so they also don’t have a strong feedback loop of data on alternative dosing regimens. And most indications are off-label and diverse, so that further dilutes that data stream: what works for someone could be unique to their disease rather than useful to extrapolate to everyone on ScIG.

Why does this matter?

ScIG is dosed based on body size. If you have a larger body, you have a larger dose. You are limited to how much you can infuse per site which influences how many needles you use. Needles have a risk of causing bruises and lumps (resolving to small clots of tissue that can sometimes take weeks to months to go away), so in some cases fewer needles is ideal, but this then drives up the size of the fluid depot which can be painful due to skin stretching and the amount of fluid that has to be cleared. It is a tradeoff between all of these factors. And, over time, people may have less skin real estate for various reasons. But, there’s no tool that helps patients make this kind of tradeoff. Current dosing calculators can help with dose and volume and figuring out infusion times, and tracking apps can record what happened, but they usually do not show what different schedules might mean over time. For example, whether doing smaller amounts less often changes the overall amount dosed, whether this creates bigger highs and lows in IgG levels, or simply reduces the number of sites. There’s also the question of how much time it takes for these varied dose schedules given the tradeoffs where fewer needles means larger depots and slower infusion times.

I wanted a tool to make those trade-offs easier to see. I wanted to be able to compare possible schedules side by side, showing the expected pattern over time, the amount per week, the number of infusion sites, the volume per site, and also model what the impacts are for the IG itself.

ScIG Pilot

ScIG dosing decisions often involve trade-offs among dose interval, total dose intensity, infusion volume, number of sites, per-site volume, and patient tolerability, but existing product calculators don’t cover this. They generally are designed for clinicians or pharmacists and focus on narrow tasks such as converting weight-based dose to volume, estimating sites or infusion time, or supporting labeled weekly/biweekly schedules. Published PK models describe ScIG absorption, peak/trough behavior, and exposure under standard regimens, but these are not available as a practical tool for comparing based on real-world constraints.

ScIG Pilot is a literature-informed simulator that compares candidate ScIG schedules against a reference regimen (aka a standard 7-day dosing schedule), showing normalized exposure curves, predicted peak/trough patterns, weekly-equivalent dose intensity, site burden, dose volume per site, and infusion frequency. (It is also open source.)

It can help someone think through a scenario and ask these types of questions of a proposed change:

  1. If I change the schedule, how does this change the volume I am getting over time? How does this compare to the existing schedule?
  2. When might this dose change impact the body?
  3. What is the burden trade-off: sites, dose per site, infusion days, time per infusion, longest gap? How does this stack up over a month or a year?

Then, based on outcomes (does it work) and various preferences (less time; fewer sites; smaller fluid depots; etc), someone can decide what works for their scenario, or at least have visuals to help them think through a decision and understand various tradeoffs. This is also helpful when trying to estimate out to longer time frames, for example: not just what this regimen does in a month in terms of number of sites, number of infusion days etc; but also how does this translate to a year of this therapy in terms of number of infusions and sites, etc?

–

ScIG Pilot: a subcutaneous immunoglobulin titration tool, a blog post by Dana M. Lewis on DIYPS.orgIt can be really hard to titrate these types of therapies and infusions, because there is no good data. I’d love to see studies in future collect this type of data or have repositories (like I described here) that are not limited to one disease indication, so a patient or clinician could go and research across populations to better get some data to triangulate from to better inform a subsequent decision to go on a therapy or change a treatment regimen. Right now, there are no visuals, no data, and no tools. But now, for this, there is at least ScIG Pilot to help visualize and triangulate across what little data we do have.

(And it’s open source so if you have ideas to improve ScIG Pilot or suggestions to make the models more useful, please feel free to open issues or PRs or email me to discuss – Dana+ScIGPilot@OpenAPS.org)

Want signal? We need more noise (more examples to address the quiet bottleneck)

Note: I’m assuming if you are reading this post that you’ve first read this post, summarizing the concept. The below is a companion piece with some expanded details about the concepts and more examples of how I think addressing this bottleneck will help make a difference.

—

You might hold the perspective that in the growing era of AI, there’s too much noise already. Slopocalypse. (Side note: this entire post, and my other post, was written by me, a human.) That’s not the biggest problem in healthcare, though: in both research and clinical care, so much critical data is simply not collected. We are missing sooooo much important data. Some of this is an artifact of past clinical trial design and how it was hard to collect or analyze or store the data; there were less established norms around data re-use; and some of it is a “collect the bare minimum to study the endpoints because that’s all we are supposed to do” phenomenon.

Nowadays, we should be thinking about how to make data and insights from clinical work and research available to AI, too, because AI will increasingly be used by humans to sort through what is known and where the opportunities are, plus make cross-domain connections that humans have been missing. And we need to be thinking about whether the incentives are set up correctly (spoiler: they’re not) to make sure all available data is able to be collected and shared or at least stored for humans and AI to have access to for future insight. What is studied is also ‘what is able to be funded’, which is disproportionately things that come to the commercial market eventually after regulatory approval.)

“But what’s the point?” you ask. “If no one is looking at the data from this study, why collect it?” Because the way we design studies – to answer a very limited-scope question, i.e. safety and efficacy for labeling claims and regulatory approval – is very different than the studies we need around optimizing and personalizing treatments. If you look at really large populations of people accessing a treatment –  think GLP-1 RA injectables, for example – you eventually start to see follow-on studies around optimization and different titration recommendations. But most diseases and most treatments aren’t for a population even 1/10th the size of people accessing those meds. So those studies don’t get done. Doctors don’t necessarily pay attention to this; patients may or may not report relevant data about this back to the doctor (and again even if they do: doctors don’t mentally or physically store this data, often); and the signal is missed because we don’t capture this ‘noise’.

This means people with rare diseases, undiagnosed diseases, atypical or seronegative diseases, unusual responses to treatments, multiple conditions (comorbidities), or any other scenario that results in them being part of a small population and where customizing and individualizing their care is VERY important…they have no evidence-based guidance. Clinicians do the best they can to interpret in the absence of evidence or guidelines, but no wonder patients often turn to LLMs (AI) for additional input and contextualization and discussion of the tradeoffs and pros and cons of different approaches.

We have to: the best available human (our clinicians) may not have the relevant expertise; or they may not be available at all; or they may be biased (even subconsciously) or forgetful of critical details or not up to date on the latest evidence; or they may be faced with a truly novel situation and they don’t have the skills to address it because they’re used to cookie-cutter standardized cases. This is not a dig at clinicians, but I recognize that we now have tools that can address some of the existing flaws in our human-based healthcare system. I keep talking about how we need to recognize that evaluations of AI in healthcare shouldn’t treat the status quo as the baseline to defend, because the status quo itself has problems, as I just described.

And AI has some of the same problems. (Except for the ‘not available’ part, unless you consider the lower-utility free access models to mean that the more advanced, thinking-based models are ‘not available’ because of cost access barriers). An AI may not have any training data on a rare disease… because nothing exists. It may drop information out of the context window, and we may not realize that this has happened (i.e., it ‘forgets’ something). Usually these are critiques of AI, juxtaposed against the implication that humans are better. But notice that these critiques are the same of humans, too! This happens all the time with human clinicians in healthcare. A human can’t make decisions on data that doesn’t exist in the world, either!

So…how do we “fix” AI? Or, how do we fix human healthcare? We should be asking BOTH questions. Maybe the answer is the same: increase the noise so we increase the signal. Argue about the ratio later (of signal:noise), but increase the amount of everything first. That is most important.

How might we do this? I have been thinking about this a lot, and Astera recently posted an essay contest asking for ideas that don’t fit the current infrastructure. (That’s why I’m finally writing this up, not because I think I’ll win the essay contest, but mostly because i’s an opportunity for people to consider whether/not this type of solution is a good idea as a separate analysis from “well, who is going to fund THAT?”. Let’s discuss and evaluate the idea, or riff on it, without being bogged down by the ‘how exactly it gets funded and managed over time’.)

I think we should create some kind of digitally-managed platform/ecosystem to do the following:

  1. Incentivize and facilitate written (AI-assisted allowed) output of everything. Case reports and scenarios of people and what they’re facing. All the background information that might have contributed. All the data we have access to that is related to the case, plus other passive, easy-to-collect data (that may already be collected, e.g., wearables and phone accelerometer data) even if it does not appear to be related. Patient-perspective narratives, clinical interpretations, clinical data, wearable data – all of this.

    A.) And, be willing to take variable types of data even from the same study population. For example, as a person with type 1 diabetes, I have 10+ years of CGM data. For a future study on exocrine pancreatic insufficiency, for example, not everyone will have CGM data, but because CGM data is increasingly common in people with T2D (a much larger population) and in the general population, a fraction of people will have CGM data and a fraction of people are willing to share it. We should enable this, even if it’s not for a primary endpoint analysis on the EPI study and even if only a fraction of people choose to share it – it might still be useful for subgroup analysis, determining power for a future study where it is part of the protocol, and identifying new research directions!

  2. Host storage somewhere. There can be some automated checking against identifiable information and sanity checking what’s submitted into the repository, plus consent (either self-consent or signed consent forms for this purpose.)
  3. Provide ‘rewards’ as incentives for inputting cases and data.

    A) Rewards might differ for patients self-submitting data and researchers and clinicians inputting data and cases. Maybe it’s one type of reward for patients and a batch reward of a free consult or service of some kind for researchers/clinicians (e.g. every 3 case reports submitted = 1 credit, credits can be used toward a new AI tool or token budget for LLMs or human expertise consult around study design, or all kinds of things.)

    B) Host data challenges where different types of funders incentivize different disease groups or families of conditions to be added, to round out what data is available in different areas.

  4. Enable AI and human access (including to citizen scientists/independent researchers who don’t have institutions) to these datasets, after self-credentialing and providing a documented use case for why the data is being accessed.

    A) Require anyone accessing the dataset to make their analysis code open source, or otherwise openly available for others to use, and to make the results available as well.

    B) Tag anytime an individual dataset is used by a project, that way individuals with self-donated data (or clinicians submitting a case) can revisit and see if there are any research insights or data analysis that applies to their case.

    C) Provide starter projects to show how the data can be used for novel insight generation. For example, develop sandboxes for different types of datasets with existing ‘lab notebooks’, so to speak, to onboard people to different datasets/groups of data, different types of analyses they might do, and to cut down on the environment setup barriers to getting started to analyzing this data.

    D) Facilitate outreach to institutions, disease-area patient nonprofits and advocacy groups both to solicit data inputs AND to use the data for generating outputs.

Why should we do this?

  • Clinical trials do not gather all of the possible useful data, because it’s not for their primary/secondary endpoints. Plus, they would have to clean it upon collection. Plus storage cost. Plus management decisions. Etc. There’s a lot of real barriers there, but the result is that clinical trials do not capture enough or the most possible relevant data. So we need a different path.
  • Clinicians/clinical pathways don’t have ways to review data, so they avoid doing it. There’s no path to “submit this data to my record but I don’t expect you to look at it” in medical charts (but there should be). So we need a different path.
  • Disease groups/organizations sometimes host and capture datasets, but like clinical trials, this is limited data; it often comes through clinical pathways (further limiting participation and diversity of the data); it doesn’t include all the additional data that might be useful. So we need a different path.
  • Some patients do publish or co-author in traditional journals, but it’s a limited, self-selected group. Then there are the usual journal hurdles that filter this down further. Not everyone knows about pre-prints. And, not everyone knows how useful their data can be – either as an n=1 alone or as an n=1*many for it to be worth sharing. A lot of people’s data may be in video/social media formats inaccessible to LLMs (right now) or locked in private Facebook groups or other proprietary platforms. So we need a different path.

Thus, the answer to ‘why we should do this’ is recognizing that: AI does not create magic out of nowhere. It relies on training data and extrapolating from that, plus web search. If it’s not searchable or findable, and it’s not in the training data, it’s not there. Yes, even the newer models and prompting it to extrapolate doesn’t solve all of these problems. What AI can do is shaped disproportionately by formal literature, institutional documents, and whatever scraps of publicly available content remain. If we want to shape what’s possible in the future, we need to start now by shaping and collecting the inputs to make it happen. We can’t fix the past trial designs but we can start to fill in the gaps in the data!

Here is an example of how this might work and why it matters to build and incentivize this type of data sharing.

  1. If we build and incentivize data sharing, the following individuals might self-donate their data and write-ups, or a clinician might submit them. Later, someone might analyze the data and put the pieces together.
  • Someone with type 1 diabetes (an autoimmune condition) and this new-onset muscle-related issue. Glucose levels are well-managed, and they don’t have neuropathy/sensory issues (which are common complications of decades of living with type 1 diabetes), and muscle damage and inflammation markers are normal. MRIs are normal. The person submits their data which includes their lab tests, clinical chart notes (scrubbed for anonymity), a patient write-up of what their symptoms are like, and exported data from their phone with years of motion/activity data.
  • A different person with Sjogren’s disease (also an autoimmune condition) and a similar new-onset muscle-related issue. There are known neurological manifestations or associations with Sjogren’s, but more typically those are small-fiber neuropathy or similar. The symptoms here are not sensory or neuropathy. MRIs don’t show inflammation or muscle atrophy. Their clinician is stumped, but knows they don’t see a lot of patients with Sjogren’s and wonders if there is a cohort of people with Sjogren’s facing this. The clinician asks the patient and gains consent; scrubs the chart note of identifying details, and submits the chart notes, labs, and a clinician summary describing the situation.
  • Later, a researcher (either a traditional institutional-affiliated researcher OR a citizen scientist, such as a third person with a new-onset muscle-related issue) decides to investigate a new-onset muscle-related issue. They register their hypothesis: that there may be a novel autoimmune condition that results in this unique muscle-related issue as a neuromuscular disease (that’s not myasthenia gravis or another common NMJ disease) that shows up in people with polyautoimmunity (multiple autoimmune conditions), but we don’t know which antibodies are likely correlated with it. The research question is to find people in the platform with similar muscle-related conditions and explore the available lab data to help find what might be the connecting situation and classify this disease or better understand the mechanism.
  • They are granted access to the platform, start analyzing, and come across an interesting correlation with antibody X, which is considered a standard autoimmune marker but one that doesn’t differentiate by disease, and which does highly correlate with this possibly novel muscle condition when it exists and is elevated in people with at least one existing autoimmune condition and these muscle-symptoms that are seronegative for every other autoimmune and neurologic condition. Further, by reading the clinical summary related to patient B and the self-written narrative from patient A, it becomes clear that this is likely neuromuscular – stemming from transmission failure along the nerves – and that the muscles are the ‘symptom’ but not the root cause of disease. This provides an avenue for a future research protocol to 1) allow these types of patients to be characterized into a cohort so this can be determined whether it is a novel disease or a subgroup of an adjacent condition (e.g., a seronegative subgroup);  2) track whether the antibody levels are treatment-sensitive or not or stay elevated always; and 3) cohorts of treatments that can be trialed off-label because they work in similar NMJ diseases even though the mechanism isn’t identical.
  • The mechanism for this novel disease isn’t proven, yet, but in the face of all the previous negative lab data and neurological testing patient A and patient B have experienced, it narrows it down from “muscle or neuromuscular” which is a significant improvement from their previous situations. Plus, this provides pathways for additional characterization; research; and eventual treatment options to explore versus the current dead ends both patients (and their clinical teams) are stuck in. And because there are no good clinical pathways for these types of undiagnosed cases, this type of insight development across multiple cases would not have occurred at all without this database of existing data.

2. The above is a small-n example, but consider a large dataset where there are hundreds or thousands of people with CGM data submitted. Plus meal tracking data, because people can export and provide that from whatever meal-logging apps some of them happen to use.

  • By analyzing this big dataset, an individual researcher could hypothesize that they could build a predictor to identity the onset of exocrine pancreatic insufficiency, which can occur in up to 10% of the general population (more frequently in older adults, people with any type of diabetes, as well as other pancreas-related conditions like pancreatitis, different types of cancer, etc), by comparing increases in glucose variability that correlate with a change in dietary consumption patterns, notably around decreasing meal size and eventually lowering the quantity of fat/protein consumed. (These are natural shifts people make when they notice they don’t feel good because their body is not effectively digesting what they are eating). They analyze and exclude the effect of GLP1-RA’s and other medications in this class: the effect size persists outside of medication usage patterns. This can later be validated and tested in a prospective clinical trial, but this dataset can be used to identify what level of correlation between meal consumption change and glucose variability change happen over what period of time in order to power a high-quality subsequent clinical trial. This may lead to an eventual non-invasive method to diagnose exocrine pancreatic insufficiency through wearable and meal-tracking data. (None exists today: only a messy stool test that no one wants to do and is hampered by other issues for accuracy.)

–

These are two examples and show how even small-n data or a large dataset where there are additional subgroups with additional datasets can be useful. In the past, it’s been a “we need X, Y, Z data from everyone. A, B, C would be nice to have, but it’s hard and not everyone will share it (or is willing to collect it due to burden), so we won’t enable it to be shared for the 30% of people who are willing”. Thus, we lose the gift and contributions from the people who are able and willing to share that data. Sometimes that 30% is a small n but that small n is >0 and may be the ONLY data that will eventually answer an important future research question.

signal-noise-more-examples-DanaMLewisWe are missing so much, because we don’t collect it. So, we should collect it. We need a platform to do this outside of any single disease group patient registry; we need to support clinician and patient entries into this platform; we need to support intake of a variety of types of data; and we need to have low (but sensible) barriers to access so individuals (citizen scientists, patients themselves) can leverage this data alongside traditional researchers. We need all hands on deck, and we need more data collected.

Want signal? We need more noise (looking at the quiet bottleneck)

We need more signal, which means we want more noise. A lot of current scientific infrastructure is designed to minimize messiness: define a narrow question, collect the minimum data required to answer it, standardize the dataset, exclude complicating variables, finish the analysis, publish the result. That approach is understandable. It is also one reason we repeatedly fail the patients who most need evidence: people with unusual responses, multiple conditions, atypical phenotypes, rare diseases, or combinations of features that do not fit cleanly into existing bins. Our systems today are structurally designed to discard or never capture the kinds of heterogeneous, partial, contextual, or longitudinal data that could eventually make critical insights available to us.

My hypothesis is that one important scientific bottleneck is not a lack of intelligence, or even a lack of data in the abstract, but a lack of infrastructure for accepting, preserving, and reusing the kinds of data that fall outside formal trial endpoints and standard clinical workflows. I am proposing a solution: a shared platform that accepts optional, heterogeneous, participant- and clinician-contributed data, which will generate clinically useful subgroup hypotheses that standard trial and registry structures fail to generate.

Here are the quiet bottlenecks in the current system that I run into and that this platform would address:

  1. Atypical, comorbid, and small-population patients are systematically left without usable evidence because current research systems are optimized to suppress heterogeneous data rather than preserve it. (Clinical trials are usually designed around narrow endpoint collection, fixed inclusion and exclusion criteria, and standardized datasets that are tractable for a specific immediate question. Patients are often told there is “no evidence,” when what is really missing is a system that could have captured and preserved evidence that can help with future translation for atypical or edge-case presentations.)
  2. Useful data is routinely discarded because no existing structure is responsible for capturing it. (Clinical trials generally do not want to collect data outside primary and secondary endpoints because of cleaning, storage, analysis, and governance costs. Clinical care systems do not want to ingest large volumes of patient-generated data that clinicians are not expected to review. Disease registries are usually narrow and disease-specific. Journals are poor infrastructure for surfacing up data. There is no home for this data.)
  3. AI and humans are constrained by the same missingness problem: the knowledge base is biased and uneven because we do not capture enough of the right kinds of real-world data. (LLMs and other AI systems are often criticized for bias, holes, and nonrepresentative training data. But this overlooks that clinicians and researchers are also reasoning from the same incomplete literature, selective trial populations, under-collected real-world evidence, and publication-filtered case reports. The bottleneck is upstream of both.)AI now makes it possible to overcome these constraints, but only if the data is collected and made available in the first place.
  1. Current systems privilege uniform completeness over partial but valuable contribution, which causes preventable signal loss. (If not everyone has or is willing to provide the data, it’s not collected. Subsets of participants who are willing and able to contribute additional data, such as wearables, CGM, meal logs, phone sensor streams, or symptom data, are prevented from doing so.)

Why current structures produce these bottlenecks

No single existing institution is responsible for optional data intake, long-term stewardship, and broad downstream access. And different structures prioritize different data capture, with no harmonization between these two settings. Clinical trials are funded, regulated, and staffed to answer bounded questions. Clinical trial incentives reward endpoint completion, analyzable datasets, and publication-ready results. Anything beyond the core clinical trial protocol creates additional costs: more data cleaning, more storage, more governance, and more analytic work that may not directly serve the trial’s primary purpose. Under those conditions, narrowness is rational but it is also systematically lossy. Clinical care systems have a different but related design problem. Electronic health records are built for documentation, care coordination, and billing, not for capturing or allowing participant-generated, future-use data that a clinician does not need for real-time decision making. This illustrates the infrastructure gap: patients may have useful longitudinal data, but there is often no legitimate pathway to store it in a way that supports future analysis. Disease registries and advocacy-group datasets help in some cases, but they are typically narrow in scope, tied to a disease silo, and constrained by the same pressures toward standardization and limited datastreams. Publications are also poorly matched to this problem, because they are optimized for polished outputs, not for preserving heterogeneous data. Much of the infrastructure was shaped from prior underlying constraints (when data capture, storage, and analysis was more expensive).

Testable hypotheses that would address these challenges:

  1. Allowing partial, nonuniform data donation from participants will outperform “uniform minimum dataset only” models for early discovery in rare, atypical, and comorbid populations.
  2. Structured case narratives combined with quantitative data will enable more useful discovery than quantitative data alone for poorly characterized conditions, because the narrative context helps identify mechanistic or phenotypic patterns that are otherwise lost.
  3. Modern tools (LLMs etc) make it feasible to analyze and normalize real-world participant-contributed data at a scale and cost that was previously impractical.
  4. For some under-characterized conditions, a heterogeneous real-world repository can identify candidate biomarkers, phenotypic subgroups, or prospective-study designs and lead to a shorter timeline for protocol development and funding of eventual trials, compared to the status quo.

Here are a few example experiments we can use to validate these hypotheses:

  1. Use heterogenous real-world data to test whether a shared repository can generate an earlier detection hypothesis that existing structures are poorly positioned to generate. For example, exocrine pancreatic insufficiency. EPI is common but underdiagnosed and its current diagnostic pathway is unpleasant (a stool test) and imperfect. As digestion becomes less effective, people often change what and how they eat before anyone labels it as a problem: meal sizes may shrink, fat and protein consumption may drift downward, symptom patterns develop, and glucose variability may shift in parallel, especially in people with diabetes or others who happen to have CGM data. A conventional clinical trial would rarely collect all of these data together (GI symptoms, meal logs, and CGM data). We have shown that a patient-developed symptom survey can effectively distinguish between EPI and non-EPI gastrointestinal symptom patterns in the general population. But this relies on people to know they have a problem and fill out the symptom survey to assess their symptoms. By analyzing CGM and meal logging data, we may be able to create a diagnostic signal from CGM data that may provide an earlier detection of EPI or other digestive problems, noninvasively and much earlier. If successful, the output would be a concrete, testable hypothesis for a future prospective study: for example, that a specific combination of changing meal patterns and glucose variability could serve as an early noninvasive screening signal for EPI.
  2. A second, smaller experiment would test the same infrastructure in a very different setting: under-characterized autoimmune or neuromuscular overlap syndromes. Here the problem is not underdiagnosis at scale, but invisibility in small-n edge cases. Patients with unusual muscle-related symptoms, normal or ambiguous standard workups, and backgrounds that include autoimmune disease often remain isolated within separate clinics and disease silos. One person may carry a type 1 diabetes diagnosis, another Sjögren’s, another a different autoimmune history, and yet their new symptoms may share an overlooked mechanism. In current systems, these cases rarely become legible as a group because the relevant data are scattered across chart notes, patient stories, normal imaging, lab panels, and passive longitudinal data that no one is collecting or comparing systematically. This tests the same core hypothesis under tougher conditions: smaller numbers, less uniform data, less obvious endpoints, and a heavier dependence on narrative context. If the EPI case shows that optional heterogeneous data can support tractable hypothesis generation in an underdiagnosed condition, the neuromuscular case shows why the same infrastructure could matter even more in sparse-data, high-ambiguity situations where it is even harder to capture data to generate evidence in support of and funding for subsequent trials.

What we might learn if these fail

We will learn what the barrier is, whether it is still a problem of infrastructure; a lack of the right people (or AI) leveraging the data; whether partial nonuniform data donation is operationally feasible; and whether limiting factors are data availability, harmonization, governance, or analytic quality. Plus, we can determine whether certain diseases or use cases (e.g. developing novel diagnostics versus assessing medication responses) are better suited than others for this type of platform.

Why now?

Passive and participant-generated data collection is easier. Wearables, phone sensing, CGM data, meal logging apps, symptom trackers, and similar are now significantly more common. Technology makes it easier than ever to create custom apps to track n=1 data or study-specific data. Storage is cheaper. Technology improvements, most notably AI tools, have made it more tractable to collect data; and have made it more tractable for researchers to analyze this data. The remaining bottleneck is capturing, storing, and making the data available. It is less of a technological bottleneck and instead a bottleneck of funding/governance/etc. This is addressable now that the capture/analysis barriers have been lowered!

–

signal-noise-DanaMLewisI don’t think the question we should be asking is whether every piece of heterogenous data will be useful, but whether we can afford to keep doing what we are doing (throwing away data and still expecting discovery for the populations our current systems and infrastructure already quietly fail).  

–

Note: I am submitting this post to the Astera essay contest, which you can read about here. You should write up your ideas about the bottlenecks you see and submit as well! I also wrote an additional piece with more details and examples, which you can read here. 

The data we are leaving behind in clinical trials, what it costs us, and why we should talk about it

I talk a lot about the data we leave behind. A lot of this time, this is in the context of clinical trial design. But more recently, it’s also about the data loss that drives bias in AI. And actually…that same bias exists in humans. And seeking to fix one may also fix the other!

To clarify, it’s not that no one cares (as a reason for why data loss or missingness happens). It is an artifact of our systems, funding priorities, and a whole bunch of historical decision making. Clinical trials cost money and are usually designed to answer a question around safety or efficacy, often in pursuit of regulatory approval and eventual commercial distribution. We need that (I’m not saying we don’t!), but we also need funding sources to answer additional questions related to titration, individual variance, medication impacts, more diseases, etc.

A lot of trials exclude people with type 1 diabetes, for example, so it’s always a question when new medications or treatments roll out whether they are appropriate or useful for people with T1D or if there’s a reason why they wouldn’t work. This is because sometimes T1D might be seen as a muddy variable in the study, but a lot of times it’s just a copy-paste decision from a previous study where it did matter that is propagated forward into the next study where it doesn’t matter. There is no resulting distinction between the two: there is simply a lack of representation of people with T1D in the study population and this means it’s hard to interpret and make decisions about this data in the future.

A lot of decisions around what data is collected, or who is enrolled in a population for a study, is an artifact of this copy-paste! Sometimes literal copy-paste, and sometimes a mental copy-paste for “we do things this way” because previously there was a reason to do so. Often that’s cost (financial or time or hardship or lack of expertise). But, in the era of increasing technological capabilities and lower cost (everything from the cost of tokens to LLM to the decreasing cost of storage for data long-term, plus the reduced cost on data collection from passive wearables and phone sensors or reduced hardship for participants to contribute data or reduced hardship for researchers to clean and study the data) this means that we should be revisiting A LOT of these decisions about ‘the way things are done’ because the WHY those things were done that way has likely changed.

The TLDR is that I want – and think we all need – more data collected in clinical trials. And, I don’t think we need to be as narrow-minded any more about having a single data protocol that all participants consent to. Hold up: before you get the torches and pitchforks out, I’m not saying not to have consent. I am saying we could have MULTIPLE consents. One consent for the study protocol. And a second consent where participants can evaluate and decide what additional permissions they want to provide around data re-use from the study, once the study is completed. (And possibly opt-in to additional data collection that they may want to passively provide in parallel).

The reason I think we should shift in this direction is because that, out of extreme respect to patient preferences around privacy and protecting patients (and participants in studies – I’ll use participants/patients interchangeably because it happens in clinical care as well as research), researchers sometimes err on the side of saying “data not available” after studies because they did not design the protocol to store the data and distribute it in the future. A lot of times this is because they believe patients did not consent (because researchers did not ask!) for data re-use. Other times it’s honestly – and I say this as a researcher who has collaborated with a bunch of people at a bunch of institutions globally – inadvertent laziness / copy-and-paste phenomenon where it’s hard to do the very first time so people don’t do it, and then it keeps getting passed on to the next project the same way, because admittedly figuring it out and doing it the first time takes work. (And, researchers may have not included in their budgets to cover data storage, etc.). Thus this propagates forward. Whereas you see researchers who do this on one project tend to continue doing it, because they’ve figured it out – and written it into their research budgets to do so for subsequent projects. And other times, the lack of data re-use is a protective instinct because researchers may have concern that the data may be used in a way that is harmful or negative. Depending on the type of data (genetic data versus glucose data, as two examples), that may be a very legitimate concern of study participants. Other times, it may be at odds with the wishes of the broad community perspective. And sometimes, individuals have different preferences!

We could – and should – be able to satisfy BOTH preferences, by having an explicit consent (either opt-in or opt-out, depending on the project) that is an ADDITIONAL consent specifically indicating preferences around data being re-used for additional studies.

To emphasize why this matters, I’ll circle back to AI/LLMs. A criticism of AI is that they are trained on data that is not representative; has holes; or is biased. This is legitimate and an artifact of the past design of trials. I have been thinking through the opportunities this provides now, in the current era of trial design, to be proactive and strategic about generating and collecting data that will fill these holes for the future! We can’t fix the way past trials were done; but we can adjust how we do trials moving forward, fill the holes, and update the knowledge base. This actually then fixes the HUMAN PROBLEM as well as the AI problem: because these criticisms of AI are the same criticism we should be making about humans (researchers and clinicians etc), who are also trained on the same missing, messy, possibly biased data!

More data; more opt-in/out; more strategery in thinking about plugging the holes in the knowledge base moving forward in part by not making the same mistakes in future research that we’ve made in the past. We should be designing trials not only for narrow endpoints (which we can also do) for safety and efficacy and regulatory approval and commercial availability, but also for answering the questions patients need answered when evaluating these treatments in the future: everything from titration to co-conditions to co-medications to the arbitrary research protocol decisions around the timing of treatment or the timing of the course of treatment. A lot of this could be better answered by data re-use beyond the additional trial as well as additional data collection in conjunction to the primary and secondary endpoints.

All of this is to say…you may not agree with me. I support that! I’d love to know (constructively; as I said, no pitchforks!) what you disagree about, or what you are violently nodding your head in agreement about, or what nuances or big picture things are being overlooked. And, I have an invitation for you: CTTI – the Clinical Trials Transformation Institute – is hosting a 2-hour summit on April 28 (2026) for patients, caregivers, and patient advocates designed to facilitate discussion around the range of perspectives on these topics as they apply to clinical trials. Specifically 1) the use of AI in clinical trials and 2) perspectives on data re-use beyond the initial trial that data is collected for.

If you have strong opinions, this is a great place for you to share them and hear from others who may have varying or similar perspectives. I am expecting to learn a lot! This event is not designed around creating consensus, because we know there are varying perspectives on these topics, and thus especially if you disagree or have a nuanced take your voice is needed! (I may be in the minority, for example, with my thoughts above.) The data we leave behind in clinical trials, what it costs us, and why we should talk about it - a blog by Dana M. Lewis on DIYPS.orgParticipation is focused (because these topics are scoped to focus on clinical trials) on anyone who has ever been part of a clinical trial, is currently navigating one, made the decision to leave a trial early, or even those who looked into participating but ultimately decided it wasn’t the right fit .

You can register for the summit here (April 28, 2026 10am-noon PT / 1-3pm ET), and if you can’t attend, feel free to drop a comment here with your thoughts and I’ll make sure it is shared and included in the notes for the event that will also be shared out afterward aggregating the perspectives we hear from.

Baseline Pilot – a leading indicator for biometric data and tool for reducing infection spread

What if you could stop the spread of infection once it arrives at your house? This is easier to do now than ever before in the era of wearables like smart watches and smart rings that gather biometric data every day and help you learn what your baseline is, making it easier to spot when your data starts to deviate from baseline. This data often is the first indicator that you have an infection, even before you develop symptoms sometimes.

But, you need to know your baseline in order to be able to tell that your data is trending away from that. And despite the fact that these new devices making it easier to have the data, they actually make it surprisingly challenging to *quickly* get the new data on a daily basis, and the software they have programmed to catch trends usually only catches *lagging* trends of changes from baseline. That’s not fast enough (on either of those metrics) for me.

(The other situation that prompted this is companies changing who gets access to which form of data and beginning to paywall long-time customers out of previous data they had access to. Ahem, looking at you, Oura.)

Anyway, based on past experiences (Scott getting RSV at Thanksgiving 2024 followed by another virus at Christmas 2024) we have some rich data on how certain metrics like heart rate (RH), heart rate variability (HRV), and respiratory rate (RR) can together give a much earlier indication that an infection might be brewing, and take action as a result. (Through a lot of hard work detailed here, I did not get either of those two infections that Scott got.) But we realized from those experiences that the lagging indicators and the barriers in the way of easily seeing the data on a daily basis made this harder to do.

Part of the problem is Apple and their design of “Vitals” in Apple Health. They have a “Vitals” feature that shows you ‘vital’ health metrics in terms of what is typical for you, so you can see if you fall in the range of normal or on the higher or lower end. Cool, this is roughly useful for that purpose, even though their alerts feature usually lag the actual meaningful changes by several days (usually by the time you are fully obviously symptomatic). But you can’t reliably get the data to show up inside the Vitals section, even if the raw data is there in Apple Health that day! Refreshing or opening or closing doesn’t reliably force it into that view. Annoying, especially because the data is already there inside of Apple Health.

This friction is what finally prompted me to try to design something: if the data is there inside Apple Health and Apple won’t reliably show it, maybe I could create an app that could show this data, relative to baseline, and do so more reliably and quickly than the “Vitals” feature?

Turns out yes, yes you can, and I did this with BaselinePilot.

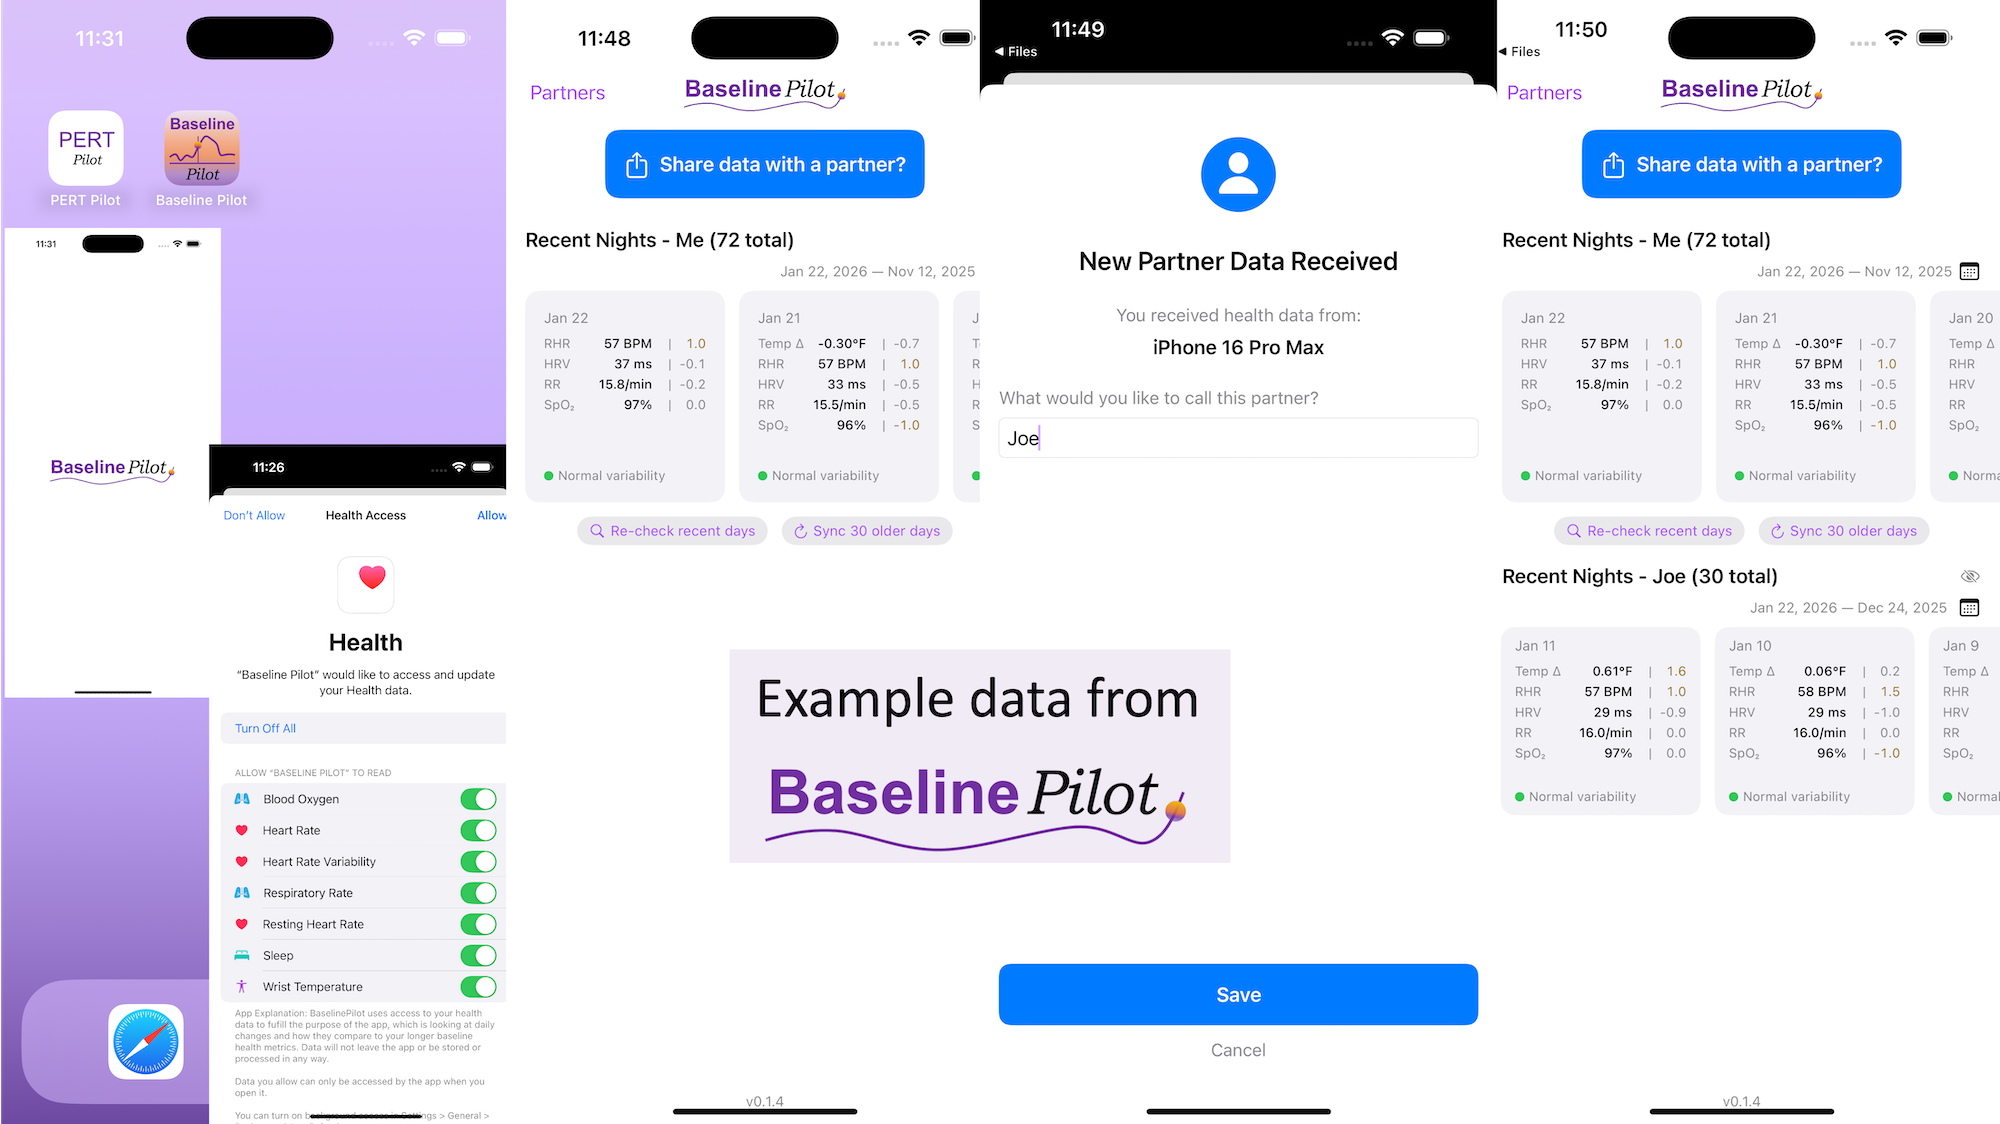
BaselinePilot is an iOS app that pulls in the HealthKit data automatically when you open it, and shows you that day’s data. If you have a wearable that pushes any of these variables (heart rate, heart rate variability, respiratory rate, temperature, blood oxygen) into Apple Health, then that data gets pulled into BaselinePilot. If you don’t have those variables, they don’t show up. For example, I have wearables that push everything but body temp into Apple Health. (I have it on a different device but I don’t allow that device to write to Health). Whereas Scott has all of those variables pushed to Health, so his pulls in and displays all 5 metrics compared to the 4 that I have.

What’s the point of BaselinePilot? Well, instead of having to open Apple Health and click and view every one of those individual metrics to see the raw data and compare it to previous data (and do it across every metric, since Vitals won’t reliably show it), now at a glance I can see all of these variables raw data *and* the standard deviation from my baseline. It has color coding for how big the difference is and settings to flag when there is a single metric that is very far off my baseline or multiple variables that are moderately off the baseline, to help me make sure I pay attention to those. It’s also easy to see the last few days or scroll and continue to see the last while, and I can also pull in historical data in batches and build as much history as I want (e.g. hundreds of days to years: whatever amount of data I have stored in Apple Health).

So for me alone, it’s valuable as a quick glance “fetch my data and make sure nothing is wonky that I need to pay attention to or tell someone about”. But the other valuable part is the partner sharing feature I built in.

With partner sharing, I can tap a button (it shows up as a reminder after your data is synced) and text a file over to Scott (or vice versa). Opening the file in iMessage shows a “open in BaselinePilot” button at the bottom, and it immediately opens the app and syncs the data. You can assign a display name to your person and thus see their data, too, in the same format as yours. You can hide or delete this person or re-show them at any time. This is useful for if you are going on a long vacation and sharing a house with family members, for example, and so you want to share/see your data when you’re going to be in physical proximity but then don’t need to see them after that – you can hide them from view until that use case pops up again.

Screenshots of BaselinePilot, showing 72 days of simulated data for the user (not actually my data) and the display with a simulated partner called "Joe".
Simulated data and simulated partner data displayed in BaselinePilot.

Ideally, I’d love to automate this data syncing with partners (who agree) over Bluetooth, so you don’t have to tap to share the file on a regular basis. But, that won’t work with the current design of phones and the ability to background sync automatically without opening the app, so I’ve stopped working on Bluetooth-based solutions given the technical/policy constraints in the phone ecosystems right now. Eventually, this could also work cross-platform where someone could generate the same style file off of their Android-based BaselinePilot and be able to share back and forth, but Scott and I both use iPhones so right now this is an iOS app. (Like BookPilot, I built this for myself/our use case and didn’t intend to distribute it; but if this sounds like something you’d use let me know and I could push BaselinePilot to the app store for other people to use.)

BaselinePilot: a leading indicator for biometric data and tool for reducing infection spread. A blog post by Dana M. Lewis on DIYPS.orgAll of this data is local to the app and not being shared via a server or anywhere else. It makes it quick and easy to see this data and easier to spot changes from your normal, for whatever normal is for you. It makes it easy to share with a designated person who you might be interacting with regularly in person or living with, to make it easier to facilitate interventions as needed with major deviations. In general, I am a big fan of being able to see my data and the deviations from baseline for all kinds of reasons. It helps me understand my recovery status from big endurance activities and see when I’ve returned to baseline from that, too. Plus the spotting of infections earlier and preventing spread, so fewer people get sick during infection season. There’s all kinds of reasons someone might use this, either to quickly see their own data (the Vitals access problem) or being able to share it with someone else, and I love how it’s becoming easier and easier to whip up custom software to solve these data access or display ‘problems’ rather than just stewing about how the standard design is blocking us from solving these issues!

What else have I built that you might like to check out? I just built “BookPilot”, a tool to help you filter book recommendations by authors you’ve already read, based on the list of books you’ve already read from your library data. If you use iOS, check out Carb Pilot to help get AI-generated estimates (or enter manual data, if you know it) to track carbs or protein etc and only see which macronutrients you want to see. If you have EPI (exocrine pancreatic insufficiency, also called PEI), check out “PERT Pilot” either on iOS or Android to help you track your pancreatic enzyme replacement therapy.

The data we leave behind in clinical trials and why it matters for clinical care and healthcare research in the future with AI

Every time I hear that all health conditions will be cured and fixed in 5 years with AI, I cringe. I know too much to believe in this possibility. But this is not an uninformed opinion or a disbelief in the trajectory of AI takeoff: this is grounded in the very real reality of the nature of clinical trials reporting and publication of data and the limitations we have in current datasets today.

The sad reality is, we leave so much important data behind in clinical trials today. (And every clinical trial done before today). An example of this is how we report “positive” results for a lot of tests or conditions, using binary cutoffs and summary reporting without reporting average titres (levels) within subgroups. This affects both our ability to understand and characterize conditions, compare overlapping conditions with similar results, and also to be able to use this information clinically alongside symptoms and presentations of a condition. It’s not just a problem for research, it’s a problem for delivering healthcare. I have some ideas of things you (yes, you!) can do starting today to help fix this problem. It’s a great opportunity to do something now in order to fix the future (and today’s healthcare delivery gaps), not just complain that it’s someone else’s problem. If you contribute to clinical trials, you can help solve this!

What’s an example of this? Imagine an autoantibody test result, where values >20 are considered positive. That means a value of 21, 58, or 82 are all considered positive. But…that’s a wide range, and a much wider spread than is possible with “negative” values, where negative values could be 19, 8, or 3.

When this test is reported by labs, they give suggested cutoffs to interpret “weak”, “moderate”, or “strong” positives. In this example, a value of 20-40 is a “weak” positive, a value between 40-80 is a “moderate” positive, and a value above 80 is a strong positive. In our example list, all positives actually fall between barely a weak positive (21), a solidly moderate positive in the middle of that range (58), and a strong positive just above that cutoff (82). The weak positive could be interpreted as a negative, given variance in the test of 10% or so. But the problem lies in the moderate positive range. Clinicians are prone to say it’s not a strong positive therefore it should be considered as possibly negative, treating it more like the 21 value than the 82 value. And because there are no studies with actual titres, it’s unclear if the average or median “positive” reported is actually all above the “strong” (>80) cutoff or actually falls in the moderate positive category.

Also imagine the scenario where some other conditions occasionally have positive levels of this antibody level but again the titres aren’t actually published.

Today’s experience and how clinicians in the real world are interpreting this data:

  • 21: positive, but 10% within cutoff doesn’t mean true positivity
  • 53: moderate positive but it’s not strong and we don’t have median data of positives, so clinicians lean toward treating it as negative and/or an artifact of a co-condition given 10% prevalence in the other condition
  • 82: strong positive, above cutoff, easy to treat as positive

Now imagine these values with studies that have reported that the median titre in the “positive” >20 group is actually a value of 58 for the people with the true condition.

  • 21: would still be interpreted as likely negative even though it’s technically above the positive cutoff >20, again because of 10% error and how far it is below the median
  • 53: moderate positive but within 10% of the median positive value. Even though it’s not above the “strong” cutoff, more likely to be perceived as a true positive
  • 92: still strong positive, above cutoff, no change in perception

And what if the titres in the co-condition have a median value of 28? This makes it even more likely that if we know the co-condition value is 28 and the true condition value is 58, then a test result of 53 will be more correctly interpreted as the true condition rather than providing a false negative interpretation because it’s not above the >80 strong cutoff.

Why does this matter in the real world? Imagine a patient with a constellation of confusing symptoms and their positive antibody test (which would indicate a diagnosis for a disease) is interpreted as negative. This may result in a missed diagnosis, even if this is the correct diagnosis, given the absence of other definitive testing for the condition. This may mean lack of effective treatment, ineligibility to enroll in clinical trials, impacted quality of life, and possibly negatively impacting their survival and lifespan.

If you think I’m cherry picking a single example, you’re wrong. This has played out again and again in my last few years of researching conditions and autoantibody data. Another real-world scenario is where I had a slight positive (e.g. above a cutoff of 20) value, for a test that the lab reported is correlated with condition X. My doctor was puzzled because I have no signs of this condition X. I looked up the sensitivity and specificity data for this test and it only has 30% sensitivity and 80% specificity, whereas 20% of people with condition Y (which I do have) also have this antibody. There is no data on the median value of positivity in either condition X or condition Y. In the context of these two pieces of information we do have, it’s easier to interpret and guess that this value is not meaningful as a diagnostic for condition X given the lack of matching symptoms, yet the lab reports the association with condition X only even though it’s only slightly more probably for condition X to have this autoantibody compared to condition Y and several other conditions. I went looking for research data on raw levels of this autoantibody, to see where the median value is for positives with condition X and Y and again, like the above example, there is no raw data so it can’t be used for interpretation. Instead, it’s summary of summary data of summarizing with a simple binary cutoff >20, which then means clinical interpretation is really hard to do and impossible to research and meta-analyze the data to support individual interpretation.

And this is a key problem or limitation I see with the future of AI in healthcare that we need to focus on fixing. For diseases that are really well defined and characterized and we have in vitro or mouse models etc to use for testing diagnostics and therapies – sure, I can foresee huge breakthroughs in the next 5 years. However, for so many autoimmune conditions, they are not well characterized or defined, and the existing data we DO have is based on summaries of cutoff data like the examples above, so we can’t use them as endpoints to compare diagnostics or therapeutic targets. We need to re-do a lot of these studies and record and store the actual data so AI *can* do all of the amazing things we hear about the potential for.

But right now, for a lot of things, we can’t.

So what can we do? Right now, we actually CAN make a difference on this problem. If you’re gnashing your teeth about the change in the research funding landscape? You can take action right now by re-evaluating your current and retrospective datasets and your current studies and figure out:

  • Where you’re summarizing data and where raw data needs to be cleaned and tagged and stored so we can use AI with it in the future to do all these amazing things
  • What data could I tag and archive now that would be impossible or expensive to regenerate later?
  • Am I cleaning and storing values in formats that AI models could work with in the future (e.g. structured tables, CSVs, or JSON files)?
  • Most simply: how am I naming and storing the files with data so I can easily find them in the future? “Results.csv” or “results.xlsx” is maybe not ideal for helping you or your tools in the future find this data. How about “autoantibody_test-X_results_May-2025.csv” or similar.
  • Where are you reporting data? Can you report more data, as an associated supplementary file or a repository you can cite in your paper?

You should also ask yourself whether you’re even measuring the right things at the right time, and whether your inclusion and exclusion criteria are too strict and excluding the bulk of the population for which you should be studying.

An example of this is in exocrine pancreatic insufficiency, where studies often don’t look at all of the symptoms that correlate with EPI; they include or allow only for co-conditions that are only a tiny fraction of the likely EPI population; and they study the treatment (pancreatic enzyme replacement therapy) without context of food intake, which is as useful as studying whether insulin works in type 1 diabetes without context of how many carbohydrates someone is consuming.

You can be part of the solution, starting right now. Don’t just think about how you report data for a published paper (although there are opportunities there, too): think about the long term use of this data by humans (researchers and clinicians like yourself) AND by AI (capabilities and insights we can’t do yet but technology will be able to do in 3-5+ years).

A simple litmus test for you can be: if an interested researcher or patient reached out to me as the author of my study, and asked for the data to understand what the mean or median values were of a reported cohort with “positive” values…could I provide this data to them as an array of values?

For example, if you report that 65% of people with condition Y have positive autoantibody levels, you should also be able to say:

  • The mean value of the positive cohort (>20) is 58.
  • The mean value of the negative cohort (<20) is 13.
  • The full distribution (e.g. [21, 26, 53, 58, 60, 82, 92…]) is available in a supplemental file or data repository.

That makes a magnitude of difference in characterizing many of these conditions, for developing future models, testing treatments or comparative diagnostic approaches, or even getting people correctly diagnosed after previous missed diagnoses due to lack of available data to correctly interpret lab results.

Maybe you’re already doing this. If so, thanks. But I also challenge you to do more:

  • Ask for this type of data via peer review, either to be reported in the manuscript and/or included in supplementary material.
  • Push for more supplemental data publication with papers, in terms of code and datasets where possible.
  • Talk with your team, colleague and institution about long-term storage, accessibility, and formatting of datasets
  • Better yet, publish your anonymized dataset either with the supplementary appendix or in a repository online.
  • Take a step back and consider whether you’re studying the right things in the right population at the right time

The data we leave behind in clinical trials (white matters for clinical care, healthcare research, and the future with AI), a blog post by Dana M. Lewis from DIYPS.orgThese are actionable, doable, practical things we can all be doing, today, and not just gnashing our teeth. The sooner we course correct with improved data availability, the better off we’ll all be in the future, whether that’s tomorrow with better clinical care or in years with AI-facilitated diagnoses, treatments, and cures.
We should be thinking about:

  • What if we design data gathering & data generation in clinical trials not only for the current status quo (humans juggling data and only collecting minimal data), but how should we design trials for a potential future of machines as the primary viewers of the data?
  • What data would be worth accepting, collecting, and seeking as part of trials?
  • What burdens would that add (and how might we reduce those) now while preparing for that future?

The best time to collect the data we need was yesterday. The second best time is today (and tomorrow).

The Cost-Effectiveness of Life for a Child – A Deep Dive into DALY Estimates and the 2025 Funding Gap

Life for a Child is an international non-profit organization that supports children with diabetes by providing insulin, test strips, and essential diabetes care to over 60,000 children in low-income countries who would otherwise have little to no access to treatment.

Without access to supplies and skilled medical care, children with type 1 diabetes (T1D) often die quickly, and with only intermittent access may die within a few years of diagnosis. In some countries,  limited amounts and types of older insulins may be provided by the health systems. In these ‘luckier’ countries, test strips are still not usually provided. Without regular blood glucose testing, children may survive into early adulthood, yet still experience early mortality due to long-term complications such as blindness, kidney failure, or amputations.

Life for a Child (LFAC) offers a lifeline, extending life expectancy and improving the quality of life for children at a remarkably low cost. Life for a Child also does incredibly critical work in improving care delivery infrastructures in each of these countries that they support. They work directly with local healthcare providers to co-develop critical education materials for young people living with diabetes. Further, they provide a support network to local healthcare providers and some governments. This is all to help improve sustainability of access to services, medications, and support for people with diabetes in the long run.

Scott and I have been supporting Life for a Child as our charity of choice for many years. As we wrote in our analysis here in 2017:

“Life for a Child seems like a fairly effective charity, spending about $200-$300/yr for each person they serve (thanks in part to in-kind donations from pharmaceutical firms). If we assume that providing insulin and other diabetes supplies to one individual (and hopefully keeping them alive) for 40 years is approximately the equivalent of preventing a death from malaria, that would mean that Life for a Child might be about half as effective as AMF, which is quite good compared to the far lower effectiveness of most charities, especially those that work in first world countries.”

We used some of GiveWell’s analyses to assess effective giving, especially comparing options like GiveDirectly or more specific charity options like AMF:

“​For example, the Against Malaria Foundation, the recommended charity with the most transparent and straightforward impact on people’s lives, can buy and distribute an insecticide-treated bed net for about $5.  Distributing about 600-1000 such nets results in one child living who otherwise would have died, and prevents dozens of cases of malaria.  As such, donating 10% of a typical American household’s income to AMF will save the lives of 1-2 African kids *every year*.”

(Note: In addition to donations, I also have supported Life for a  Child with my time at both the US level, serving on the US-based Life for a Child US board, as well as the US representative on the international steering committee for Life for a Child.)

However, in 2025, Life for a Child faces an immediate and unexpected $300,000 funding shortfall, due to a previously committed donor no longer being able to provide this donation. This funding was for test strips, which will reduce the number of strips provided per child from three to two test strips per day.

Further, Life for a Child has additional funding needs to continue expanding to support more children who are otherwise unsupported and going without critical supplies. (The room for funding is several orders of magnitude above this year’s funding gap.)

In order to assess the need for how we (in a general sense, speaking of all of us) fill this funding gap and understanding if this is still a cost-effective way to support people with diabetes, we wanted to revisit our analysis for how cost-effective Life For a Child is.

For background, I asked Graham Ogle, head of LFAC, for some numbers. These include:

  • Life for A Child currently supports 60,000 children in 2025
  • The original expansion plan is a goal to support 100,000 children or more by 2030
  • Estimates for how much is spent per child is about $150 USD (slightly less than what Scott and I had estimated in 2017), or $160 USD if you incorporate indirect costs.

We used these numbers below to estimate the cost-effectiveness of Life for a Child’s interventions.

Estimating Life For A Child’s Cost per Disability-Adjusted Life Year (DALY)

The Disability-Adjusted Life Year (DALY) is the most commonly used metric in global health to capture both the years of life lost (YLL) due to premature death and the years lived with disability (YLD) due to a health condition, such as type 1 diabetes.

The goal of Life for a Child’s work is to reduce both of these by providing insulin and glucose monitoring as well as improved care necessary for improved health outcomes.

  1. Life for a Child support reduces Years of Life Lost (YLL) 

To estimate YLL reduction, we calculate the difference between the expected age at death for a child with T1D who receives no care versus a child receiving LFAC support:

  • Without Life for a Child :
    • In the worst-case scenario, children with T1D may die within 1-2 years due to lack of insulin, meaning an early death by age 10 instead of the typical life expectancy of 60 years in some of these countries. . This results in 50 YLLs (60 – 10 = 50).
    • In countries where insulin is available but costly and/or glucose monitoring is not affordable and readily available, children may survive into their late 20s or 30s, but still experience significant complications, reducing life expectancy. In this scenario (minimal access to insulin, glucose monitoring, etc), we make a rough assumption that children with diabetes may survive into their mid to late 30s, therefore 25 YLLs is a reasonable estimate (60 – 35 = 25).
  • With Life for a Child :
    • Life for a Child’s program significantly improves both short-term and long-term survival. We assume that children supported by Life for a Child have the potential to live to an average life expectancy of 50-60 years (instead of dying prematurely due to untreated T1D), even when considering that LFAC only supports children into early adulthood (e.g. 25-30 years of age).

If we assume the average life expectancy for children newly diagnosed with T1D increases from 15-35 years to 50-60 years with standard Life for a Child support, that gives a savings of 25-35 YLLs (DALYs) per child, accounting for most of the uncertainty in our lifespan estimates above.

  1. Years Lived with Disability (YLD) Reduction

T1D also causes significant disability when people with T1D don’t have access to insulin and/or sufficient glucose monitoring and monitoring for early signs of complications, especially due to complications like blindness, kidney failure, and amputations. Each of these conditions brings about substantial life impairment.

  • Without Life for a Child:
    • Children with poorly supported T1D face a high likelihood of severe complications as they age. We estimate the disability weight (DW) for this scenario at 0.20, reflecting significant disability as a result of some of those complications.
  • With Life for a Child:
    • Access to insulin and glucose monitoring and healthcare monitoring drastically reduces the risk of complications. We estimate a DW of 0.05, which represents a much lower level of disability, especially in terms of future complications.

With such DWs, the reduction in YLD before premature death (20%-5%=15% over 5-30 years = 1-4 DALYs), and the 5% reduction in the YLL benefit (5% * 25-35 = 1-2 DALYs) partially cancel out, and don’t change the end result much. The net gain of 1-2 DALYs due to YLD reduction is smaller than the uncertainty range on the YLL benefit.

So for purposes of cost-effectiveness calculations, we’ll ignore YLD in the rest of this post and continue using the 25-35 DALYs per child figure.

  1. Total DALYs and Cost per DALY

For this section, we’ll assume the total impact of Life for a Child’s intervention per child from the calculations above is 25-35 DALYs.

Life for a Child’s cost per child in 2025 is approximately $150 per year (or $160 including indirect costs), and if we estimate that most children receive treatment for about 15 years, meaning the total cost per child is roughly $1,500–$2,250 over that period (or $1,600-$2,400 total with indirect costs).

Thus, the cost per DALY for Life for a Child can be estimated as:

(Cost per child) / (DALYs saved per child)

Here are a variety of estimates for varying cost levels using the lower bound of 25 DALYs saved per child supported:

  • With $1,500 per lifetime per child ($150/year for 10 years) and 25 DALYs saved, that estimates $60 per DALY ($64 with indirect costs)
  • With $2,250 per lifetime per child ($150/year for 15 years) and 25 DALYs saved, that estimates $90 per DALY ($96 with indirect costs)
  • With slightly higher costs to assume the cost will rise over time of $175/year for 15 years, this is a higher estimated $2,625 per lifetime per child and 25 DALYs saved, estimating $105 per DALY.
  • With slightly higher costs to assume the cost will rise over time of $175/year for 20 years, this is a higher estimated $3,500 per lifetime per child and 25 DALYs saved, estimating $140 per DALY.

This places Life for a Child’s cost per DALY in the range of $60–$90, for conservative estimates a remarkably cost-effective intervention, and even the higher estimates of $105-$140 assuming an increase in costs and increase in years of support compares favorably to the most effective global health programs, including those recommended by GiveWell.

How did we come to this conclusion?

  • GiveWell estimates cash transfers through GiveDirectly result in $1000/DALY, based on welfare gains rather than direct health outcomes (so apples and oranges), but even apples to oranges we can estimate Life for a Child is more cost-effective by at least single digit (eg 1-9x) factors than cash giving elsewhere.
  • We know GiveWell’s top charities are around $50-$100/DALY. Given we were estimating $60-$140 with a wide swathe of estimates, we can see that Life for a Child aligns with some of GiveWell’s top charities in terms of cost per DALY and thus “compares favorably” in our analysis. 

Why You Should Donate to Life for a Child

The point of this post was for Scott and I to reassess our statement that we have been making since ~2017 or so, which is the fact that Life for a Child is a remarkably cost-effective charity overall, and likely one of the most cost-effective charities to support people living with diabetes around the world who otherwise won’t have access (or regular access) to insulin and blood glucose testing.

Life for a Child has a DALY cost in the range of $60-$140 (reflecting current versus future cost increases), depending on which input variables you use, which makes it one of the best uses of global health funding available today.

Because of this reassessment, we also hope if you’ve read this far that you, too, will consider making a life-saving and life-changing donation for people with diabetes by donating to Life for a Child.

If you’re feeling overwhelmed with world events and want to make a tangible difference in people’s lives in a measurable way, consider donating to Life for a Child.

If you want to support people with diabetes in the most cost-effective way, so that your donation dollars make the biggest impact? Donate to Life for a Child.

Your donation saves – and changes – lives.

Life for a Child is a cost-effective charity supporting people with diabetes that needs your help. A blog post from Dana M. Lewis at DIYPS.org(Thank you).

PS – feel free to reach out to me (Dana@OpenAPS.org) and/or Scott (Scott@OpenAPS.org) if you want to chat through any of the estimates or numbers in more detail and how we consider donations.

Beware “too much” and “too little” advice in Exocrine Pancreatic Insufficiency (EPI / PEI)

If I had a nickel every time I saw conflicting advice for people with EPI, I could buy (more) pancreatic enzyme replacement therapy. (PERT is expensive, so it’s significant that there’s so much conflicting advice).

One rule of thumb I find handy is to pause any time I see the words “too much” or “too little”.

This comes up in a lot of categories. For example, someone saying not to eat “too much” fat or fiber, and that a low-fat diet is better. The first part of the sentence should warrant a pause (red flag words – “too much”), and that should put a lot of skepticism on any advice that follows.

Specifically on the “low fat diet” – this is not true. A lot of outdated advice about EPI comes from historical research that no longer reflects modern treatment. In the past, low-fat diets were recommended because early enzyme formulations were not encapsulated or as effective, so people in the 1990s struggled to digest fat because the enzymes weren’t correctly working at the right time in their body. The “bandaid” fix was to eat less fat. Now that enzyme formulations are significantly improved (starting in the early 2000s, enzymes are now encapsulated so they get to the right place in our digestive system at the right time to work on the food we eat or drink), medical experts no longer recommend low-fat diets. Instead, people should eat a regular diet and adjust their enzyme intake accordingly to match that food intake, rather than the other way around (source: see section 4.6).

Think replacement of enzymes, rather than restriction of dietary intake: the “R” in PERT literally stands for replacement!

If you’re reading advice as a person with EPI (PEI), you need to have math in the back of your mind. (Sorry if you don’t like math, I’ll talk about some tools to help).

Any time people use words to indicate amounts of things, whether that’s amounts of enzymes or amounts of food (fat, protein, carbs, fiber), you need to think of specific numbers to go with these words.

And, you need to remember that everyone’s body is different, which means your body is different.

Turning words into math for pill count and enzymes for EPI

Enzyme intake should not be compared without considering multiple factors.

The first reason is because enzyme pills are not all the same size. Some prescription pancreatic enzyme replacement therapy (PERT) pills can be as small as 3,000 units of lipase or as large as 60,000 units of lipase. (They also contain thousands or hundreds of thousands of units of protease and amylase, to support protein and carbohydrate digestion. For this example I’ll stick to lipase, for fat digestion.)

If a person takes two enzyme pills per meal, that number alone tells us nothing. Or rather, it tells us only half of the equation!

The size of the pills matters. Someone taking two 10,000-lipase pills consumes 20,000 units per meal, while another person taking two 40,000-lipase pills is consuming 80,000 units per meal.

That is a big difference! Comparing the two total amounts of enzymes (80,000 units of lipase or 20,000 units of lipase) is a 4x difference.

And I hate to tell you this, but that’s still not the entire equation to consider. Hold on to your hat for a little more math, because…

The amount of fat consumed also matters.

Remember, enzymes are used to digest food. It’s not a magic pill where one (or two) pills will perfectly cover all food. It’s similar to insulin, where different people can need different amounts of insulin for the same amount of carbohydrates. Enzymes work the same way, where different people need different amounts of enzymes for the same amount of fat, protein, or carbohydrates.

And, people consume different amounts and types of food! Breakfast is a good example. Some people will eat cereal with milk – often that’s more carbs, a little bit of protein, and some fat. Some people will eat eggs and bacon – that’s very little carbs, a good amount of protein, and a larger amount of fat.

Let’s say you eat cereal with milk one day, and eggs and bacon the next day. Taking “two pills” might work for your cereal and milk, but not your eggs and bacon, if you’re the person with 10,000 units of lipase in your pill. However, taking “two pills” of 40,000 units of lipase might work for both meals. Or not: you may need more for the meal with higher amounts of fat and protein.

If someone eats the same quantity of fat and protein and carbs across all 3 meals, every day, they may be able to always consume the same number of pills. But for most of us, our food choices vary, and the protein and fat varies meal to meal, so it’s common to need different amounts at different meals. (If you want more details on how to figure out how much you need, given what you eat, check out this blog post with example meals and a lot more detail.)

You need to understand your baseline before making any comparisons

Everyone’s body is different, and enzyme needs vary widely depending on the amount of fat and protein consumed. What is “too much” for one person might be exactly the right amount for another, even when comparing the same exact food quantity. This variability makes it essential to understand your own baseline rather than following generic guidance. The key is finding what works for your specific needs rather than focusing on an arbitrary notion of “too much”, because “too much” needs to be compared to specific numbers that can be compared as apples to apples.

A useful analogy is heart rate. Some people have naturally higher or lower resting heart rates. If someone tells you (that’s not a doctor giving you direct medical advice) that your heart rate is too high, it’s like – what can you do about it? It’s not like you can grow your heart two sizes (like the Grinch). While fitness and activity can influence heart rate slightly, individual baseline differences remain significant. If you find yourself saying “duh, of course I’m not going to try to compare my heart rate to my spouse’s, our bodies are different”, that’s a GREAT frame of mind that you should apply to EPI, too.

(Another example is respiratory rate, where it varies person to person. If someone is having trouble breathing, the solution is not as simple as “breathe more” or “breathe less”—it depends on their normal range and underlying causes, and it takes understanding their normal range to figure out if they are breathing more or less than their normal, because their normal is what matters.)

If you have EPI, fiber (and anything else) also needs numbers

Fiber also follows this pattern. Some people caution against consuming “too much” fiber, but a baseline level is essential. “Too little” fiber can mimic EPI symptoms, leading to soft, messy stools. Finding the right amount of fiber is just as crucial as balancing fat and protein intake.

If you find yourself observing or hearing comments that you likely consume “too much” fiber – red flag check for “too much!” Similar to if you hear/see about ‘low fiber’. Low meaning what number?

You should get an estimate for how much you are consuming and contextualize it against the typical recommendations overall, evaluate whether fiber is contributing to your issues, and only then consider experimenting with it.

(For what it’s worth, you may need to adjust enzyme intake for fat/protein first before you play around with fiber, if you have EPI. Many people are given PERT prescriptions below standard guidelines, so it is common to need to increase dosing.)

For example, if you’re consuming 5 grams of fiber in a day, and the typical guidance is often for 25-30 grams (source, varies by age, gender and country so this is a ballpark)…. you are consuming less than the average person and the average recommendation.

In contrast, if you’re consuming 50+ grams of fiber? You’re consuming more than the average person/recommendation.

Understanding where you are (around the recommendation, quite a bit below, or above?) will then help you determine whether advice for ‘more’ or ‘less’ is actually appropriate in your case. Most people have no idea what you’re eating – and honestly, you may not either – so any advice for “too much”, “too little”, or “more” or “less” is completely unhelpful without these numbers in mind.

You don’t have to tell people these numbers, but you can and should know them if you want to consider evaluating whether YOU think you need more/less compared to your previous baseline.

How do you get numbers for fiber, fat, protein, and carbohydrates?

Instead of following vague “more” or “less” advice, first track your intake and outcomes.

If you don’t have a good way to estimate the amount of fat, protein, carbohydrates, and/or fiber, here’s a tool you can use – this is a Custom GPT that is designed to give you back estimates of fat, protein, carbohydrates, and fiber.

You can give it a meal, or a day’s worth of meals, or several days, and have it generate estimates for you. (It’s not perfect but it’s probably better than guessing, if you’re not familiar with estimating these macronutrients).

If you don’t like or can’t access ChatGPT (it works with free accounts, if you log in), you can also take this prompt, adjust it how you like, and give it to any free LLM tool you like (Gemini, Claude, etc.):

You are a dietitian with expertise in estimating the grams of fat, protein, carbohydrate, and fiber based on a plain language meal description. For every meal description given by the user, reply with structured text for grams of fat, protein, carbohydrates, and fiber. Your response should be four numbers and their labels. Reply only with this structure: “Fat: X; Protein: Y; Carbohydrates: Z; Fiber; A”. (Replace the X, Y, Z, and A with your estimates for these macronutrients.). If there is a decimal, round to the nearest whole number. If there are no grams of any of the macronutrients, mark them as 0 rather than nil. If the result is 0 for all four variables, please reply to the user: “I am unable to parse this meal description. Please try again.”

If you are asked by the user to then summarize a day’s worth of meals that you have estimated, you are able to do so. (Or a week’s worth). Perform the basic sum calculation needed to do this addition of each macronutrient for the time period requested, based on the estimates you provided for individual meals.

Another option is using an app like PERT Pilot. PERT Pilot is a free app for iOS (and for Android) for people with EPI that requires no login or user account information, and you can put in plain language descriptions of meals (“macaroni and cheese” or “spaghetti with meatballs”) and get back the estimates of fat, protein, and carbohydrates, and record how much enzymes you took so you can track your outcomes over time. (Android users – email me at Dana+PERTPilot@OpenAPS.org if you’d like to test the forthcoming Android version!) Note that PERT Pilot doesn’t estimate fiber, but if you want to start with fat/protein estimates, PERT Pilot is another way to get started with seeing what you typically consume. (For people without EPI, you can use Carb Pilot, another free iOS app that similarly gives estimates of macronutrients.)

—

Beware advice of "more" or "less" that is vague and non-numeric (not a number) unless you know your baseline numbers in exocrine pancreatic insufficiency. A blog by Dana M. Lewis from DIYPS.orgTL;DR: Instead of arbitrarily lowering or increasing fat or fiber in the diet, measure and estimate what you are consuming first. If you have EPI, assess fat digestion first by adjusting enzyme intake to minimize symptoms. (And then protein, especially for low fat / high protein meals, such as chicken or fish.) Only then consider fiber intake—some people may actually need more fiber rather than less than what they were consuming before if they experience mushy stools. Remember the importance of putting “more” or “less” into context with your own baseline numbers. Estimating current consumption is crucial because an already low-fiber diet may be contributing to the problem, and reducing fiber further could make things worse. Understanding your own baseline is the key.