“Micro” highs and lows (they’re not really all the same)

More thinking on what a snapshot of diabetes data means to me – this time on ‘micro’ highs or lows. @danamlewis #DIYPS http://bit.ly/1lt2ijE

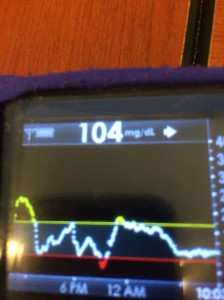
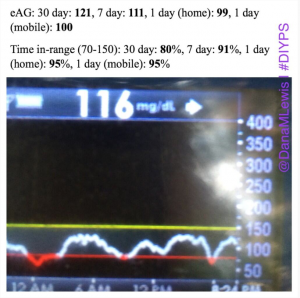
I went to take a snapshot of my 24 hour CGM graph, because I was pleased with the outcome of the past 24 hours: no major lows or highs. According to the picture, it’s a “no hitter” (not hitting the high or low lines). However, I have the high alarm set to 170 right now, so to me knowing that I peaked around 150 overnight, including the slow crawl up to it, means it wasn’t a true no-hitter.

But, isn’t it still worth celebrating? No major overnight alarms to wake me up. No juicy juice or temp basals or reduced sleep or waking up feeling like I was dehydrated and apt to develop ketones. Diabetes, for a day, wasn’t a big deal. Isn’t this the ultimate goal of living with diabetes – living well, and not letting it stop us from living our lives and doing what we’re striving to do?

I tweeted the CGM picture with this caption:

Because it’s true. A 400 and 121 are both technically, medically speaking both “high” and “highs”. But are they the same? No.

(And same goes for any single data point – 121 could be flat, going up, or sliding down – the trend is what matters, regardless of what FDA has agreed to at this point in time. )

So, I’ve decided to categorize things as “micro” highs and lows when I’m sliding slightly below my comfortable range (like floating in low 80s or 70s and feeling low symptoms) or rising above what’s “normal” (80-120 is burned into my brain as normal), but may not warrant taking a picture as a “high”.

Semantics? Maybe. But as we talk about what these numbers represent, our ability and willingness to have a conversation about them online, including defeating data-shaming, I think it’s worth continually reframing and gaining more perspective on what diabetes data means to each of us.

“Letting go of things we can’t control” + remembering that sleep matters (#DIYPS)

Sleep + so many factors out of our control impacts BGs. (#DIYPS lessons learned from @danamlewis after #RagnarNWP): http://bit.ly/1AgTN4M

It’s been over a month since our last #DIYPS update. We haven’t made any significant changes in the system, and have been continuing to use it to successfully manage my BGs to (mostly) my satisfaction.

That is, until this past weekend.

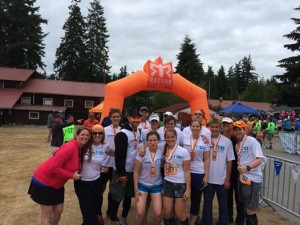
There was a team of 12 people with diabetes that got together (thanks @ConnecT1D and @IN_events for sponsoring!) to run “Ragnar Northwest Passage”, which is a 196 mile long relay race from near the Canadian border (Blaine, Washington) to Langley, Washington.

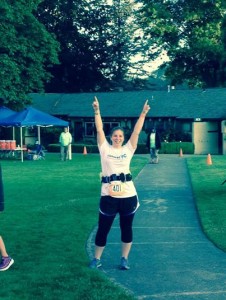
Guess who was lucky runner #1 and woke up at 3am on Friday to run 6.3 miles at 6:15 am?

Here’s how the relay works: you have two vans, each with 6 runners, that take turns on the course. Each runner runs three different times, for a total of 13-19 miles. Van 1 starts and the 6 runners hand off to each other; then Van 2 meets up as the 6th runner finishes, and runners 7-12 commence running. Meet up again and handoff back to Van 1. (I’d say “rinse and repeat”, except for there weren’t always showers involved after every single run). The race started for our team on Friday at 6:15 am (see note about 3am wakeup and running first), and continued until Saturday at 4pm-ish.

Why this became a #DIYPS post

I slept ~4 hours on Thursday night before the 3am wake up and early race start. During the actual race, I got about 3.5 hours of sleep overnight in Van 1 while Van 2 was out on the course. Normally I would have 16-20 hours of sleep under my belt for a half-marathon or longer race.

I also didn’t have #DIYPS running at full capacity during the race – my Moto G phone has taken some hard knocks and the cord that connects to my CGM was wonky. So, I pretty much went “old school” and just used my CGMs as-is.

During the race, even without #DIYPS running normally, my BGs were pretty good. I was great during my first run and only had a few lows in the afternoon after that (more from lack of protein/real food than anything else, which I fixed with a big lunch). During my 2nd run, I started my temp basal too soon, miscalculating when the runner before me was coming in, and was between 180-200 during my run. Not *that* big of a deal, but since my average BG is usually <120, I can feel it and it feels different to run. I managed to get it down after my run and in the overnight, and was fine during my 3rd run, and after that. All in all, I was very happy with my BGs during the race. (Oh – and my first run (6.3 miles) and my last run (3.1 miles) were both PRs, personal records, for me! So, yay for good running and good BGs at the same time.)

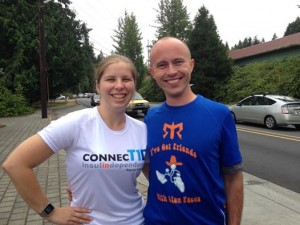
(Scott & I after the race! We look great on so little sleep and so many miles, right?)

However, once I finished the race and Scott and I headed out for dinner (real food!), despite the usual #DIYPS prebolus strategies, my BGs rocketed up pretty fast. I chalked it up to something related to my liver absorbing or dumping glucose or whatever, didn’t worry about it too much, and focused more on getting 12 hours of sleep that night. (Luckily I was running higher and not lower, so sleeping through a few alarms was ok for the night).

On Sunday, the same thing happened when I ate lunch. A few carbs and my BGs took off high. Same thing Sunday for dinner, and Monday after a breakfast that included carbs.

By Monday evening, I was puzzled and annoyed, because I had #DIYPS running but my body was not cooperating! I was also still feeling tired, above and beyond what Scott (who ran Ragnar on another team that had 12 members with functioning pancreases :) ) seemed to be feeling.

Remembering that sleep matters A LOT to your body, and the same goes for managing BGs

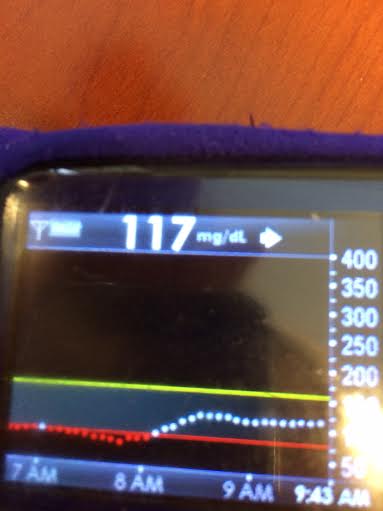
Overnight, my BGs settled down and were flat after 6am and all morning, including after a breakfast with lots of carbs (I ate a gluten-free cookie, it was delicious). My BGs had a slight uptick..and flattened out. Like they used to do last week and all the weeks prior with #DIYPS. I took a picture to send to Scott, and had the sudden realization that my body had probably caught up on sleep to it’s minimum levels, and that’s probably why it was handling things like “normal” again*.

This (knowing that sleep impacts your body’s function) is a lesson I’ve learned many times before, and has less to do with #DIYPS….except it helped remind me that there are SO many factors out of our control in dealing with diabetes. (Stressed? Excited? Sick? Sleep deprived? Are you a girl? Are you growing? Are you in puberty? Is the moon out? Is there a universal Diet Coke shortage?)

#DIYPS is great at helping you deal with BGs if you don’t know the exact carb count in a meal, or dealing with the chaos of running more than a half marathon over three legs in a 36 hour time period on less than 8 hours of sleep. Like I mentioned before, it also helps me keep perspective – this time to help me let the few days of higher than normal post-race BGs go and not beat myself up about it.

Final note

It’s probably a good idea to not try this kind of sleep deprivation at home (seriously – sleep is awesome, you should do as much of it as possible), and be aware that running Ragnar or another relay race** may throw off your BGs more so from lack of sleep than the actual exercise part.


*Yes, it’s normal to eat a gluten-free cookie for breakfast! The non-normal part is having to do math and bolus and watch BGs. Having diabetes is not normal!
**Scott and I are running on a Hood to Coast team in August. Gulp. Maybe I’ll manage more sleep this time around in the vans?

What is #DIYPS (Do-It-Yourself Pancreas System)?

#DIYPS (the Do-It-Yourself Pancreas System) was created by Dana Lewis and Scott Leibrand in the fall of 2013.

Curious about building a closed loop for yourself? Head to OpenAPS.org!

#DIYPS was originally developed with the goal of solving a well-known problem with an existing FDA-approved medical device. We originally set out to figure out a way to augment continuous glucose monitor (CGM) alerts, which aren’t loud enough to wake heavy sleepers, and to alert a loved one if the patient is not responding.

We were able to solve those problems and include additional features such as:

  •  Real-time processing of blood glucose (BG), insulin on board, and carbohydrate decay
  •  Customizable alerts based on CGM data and trends
  •  Real-time predictive alerts for future high or low BG states (hours in advance)
  •  Continually updated recommendations for required insulin or carbs
  • ..and as of December 2014, we ‘closed the loop’ and have #DIYPS running as a closed loop artificial pancreas.
  • (And, as of February 2015, we also launched #OpenAPS, an open and transparent effort to make safe and effective basic Artificial Pancreas System (APS) technology widely available. For more details, check out OpenAPS.org)

You can read this post for more details about how the #DIYPS system works.

While #DIYPS was invented for purposes of better using a continuous glucose monitor (CGM) and initially tailored for use with an insulin pump, what we discovered is that the concepts behind #DIYPS can actually be used with many types of diabetes technology. It can be utilized by those with:

  • CGM and insulin pump
  • CGM and multiple daily injections (MDI) of insulin
  • no CGM (fingerstick testing with BG meter) and insulin pump
  • no CGM (fingerstick testing with BG meter) and multiple daily injections (MDI) of insulin

Here are some frequently asked questions about #DIYPS:

  1. Q:I love it. How can I get it?A: #DIYPS is n=1, and because it is making recommendations based on CGM data, we previously have said that we can not publicly post the code to enable someone else to utilize #DIYPS as-is. There’s two things to know. 1) To get some of the same benefits from #DIYPS as an “open loop” system, with alerts and BG visualizations, you can get Nightscout, which includes all of the publicly-available components of #DIYPS, including the ability to upload Dexcom CGM data, view it on any web browser and on a Pebble watch, and get basic alarms for high and low BG – and depending on which features you enable, you can also get predictive alarms. Some of the other core #DIYPS features (“eating-soon mode“, and sensitivity/resistance/activity modes) are now available in Nightscout. 2) If you are interested in your own closed loop system, check out OpenAPS.org and review the available OpenAPS documentation on Github to help you determine if you have the necessary equipment and help you determine whether you want to do the work to build your own implementation.
  2. Q: “Does #DIYPS really work?”A: Yes! For N=1, using the “open loop” style system with predictive alerts and notifications, we’ve seen some great results. Click here to read a post about the results from #DIYPS after the first 100 days – it’s comparable to the bionic pancreas trial results. Or, click here to read our results after using #DIYPS for a full year. We should probably update this to talk about the second year of using #DIYPS, but the results from the first year have been sustained (yay!) and also augmented by the fact that we closed the loop and have the system auto-adjusting basal rates while I sleep.
  3. Q: “Why do you think #DIYPS works?”A: There could be some correlation with increased timed/energy spent thinking about diabetes compared to normal. (We’d love to do some small scale trials comparing people who use CGMs with easy access to time-in-range metrics and/or eAG data, to compare this effect). And, #DIYPS has also taught us some key lessons related to pre-bolusing for meals and the importance of having insulin activity in the body before a meal begins. You should read 1) this post that talks about our lessons learned from #DIYPS; 2) this post that gives a great example of how someone can eat 120 grams of carbohydrates of gluten-free pizza with minimal impact to blood glucose levels with the help of #DIYPS; 3) this post that will enable you to find out your own carbohydrate absorption rate that you can start using to help you decide when and how you bolus/inject insulin to handle large meals or 4) this post talking about how you can manually enact “eating-soon mode”. And of course, the key reason #DIYPS works (in open loop mode) is because it reduces the cognitive load for a person with diabetes by constantly providing push notifications and real time alerts and predictions about what actions a person with diabetes might need to consider taking. (Read more detail from this post about the background of the system.)
  4. Q:Awesome!  What’s next?A: If you haven’t read about #OpenAPS, we encourage you to check it out at OpenAPS.org. This is where we have taken the inspiration and lessons learned from using #DIYPS in manual mode (i.e. before we closed the loop), and from our first version of a closed loop and are paying it forward with a community of collaborators to make it possible for other people to close the loop! Some new features we wanted for #DIYPS that will likely still happen, but integrated with Nightscout and/or #OpenAPS include:
    • calculation of insulin activity and carb absorption curves (and from there, ISF & IC ratios, etc.) from historical data
    • better-calibrated BG predictions using those calculated absorption curves (with appropriate error bars representing predictive uncertainty)
    • recommendations for when to change basal rates, based on observed vs. predicted BG outcomes
    • integration with activity tracking and calendar data
    • closing the loop – done as of December 2014! :) and made possible for more than (n=1) with #OpenAPS as of February 2015

    We also are collaborating with medical technology and device companies, the FDA, and other projects and organizations like Tidepool, to make sure that the ideas, insights, and features inspired by our original work on #DIYPS get integrated as widely as possible. Stay tuned (follow the #DIYPS hashtagDana Lewis & Scott Leibrand on Twitter, and keep an eye on this blog) for more details about what we’re up to.

  5. Q: “I love it. What can I do to help the #DIYPS project? (or #openAPS)”A: #DIYPS is still a Dana-specific thing, but #OpenAPS is open source and a great place to contribute. First and foremost, if you have any ability to code (or a desire to learn), we need contributors to both the Nightscout project as well as #OpenAPS. There are many things to work on, so we need as many volunteers, with as many different types of skills, as we can get.  For those who are less technical, the CGM in the Cloud Facebook group is a great place to start. For those who are technical and/or want to close the loop for themselves, check out OpenAPS.org, join the openaps-dev google group, and hop on the #intend-to-bolus channel on Gitter. If you want to contact us directly, you can reach out to us on Twitter (@DanaMLewis @ScottLeibrand) or email us (dana@openAPS.org and scott@openAPS.org). We’d also love to know if you’re working on a similar project or if you’ve heard of something else that you think we should look into for a potential #OpenAPS feature or collaboration.

Dana Lewis & Scott Leibrand

Ending data-shaming: diabetes data should provide perspective, not judgment, on diabetes

Let’s end data-shaming. A1c is not only number that matters for ppl w/T1 diabetes. #DIYPS http://bit.ly/1n86Z3A @danamlewis @scottleibrand
My last A1c dropped significantly. Some of these results can be attributed to changes I’ve made with #DIYPS, like predictive alerts, alarms that actually wake me up at night, etc. (If you are new to #DIYPS, click here to read a post explaining what the system is.)

Right now, #DIYPS is still n=1 (me), so until we can have more people using the system and verifying the algorithms (click here to learn more about carbohydrate decay rates and how you can test this yourself) and showing the applicability for a wider group of people, we’ll have to wait and see how these results translate to other people. With this in mind (and with the thought that it’s frustrating that A1c is the ‘holy grail’ of diabetes), I wanted to start looking at additional ways to utilize #DIYPS data, so I had some relevant data between the CGM data and the A1c.

We added a number of additional “stats” to my #DIYPS dashboard:  I started looking at my eAG (estimated average glucose) for a single day, a week, and 30 days. We also added a % ‘time in range’ (between 70 and 150) for the same time periods.

Having this data at my fingertips thanks to #DIYPS provides a great balance between the flood of data I get every day (288 individual data points per CGM) and the three month “benchmark” of A1c.

Why these stats are helpful:

  • I can track overall average (eAG) over time, without having to wait 3 months for the next A1c value.
  • I don’t have to guess where I’m at or go borrow a Windows computer to look at my CGM data.
  • I’m not chasing a lower A1c/eAG at the expense of all else (i.e. having lots of lows). A <120 average for a week is good; but if my time in range is <80%, that’s not ideal. Finding a balance between time in range (95%+ is great, 90%+ is good, 80%+ is target) and a good eAG (<120 or <125) is the ultimate goal.
  • If I have a day with higher than usual BGs (usually resulting in a high 24 hour average and low % time in range), I can see the impact it has on a week and the month.

I am happily sharing my “time in range” and eAG numbers, because I am happy with them, and I’m able to show “what is working”. But I have often hesitated to share my A1c data publicly.

Here’s why:

I’ve observed judgments, negative comments, and changed behaviors based on people’s perceptions of what is a “good A1c” and whether someone is “in control” or not of diabetes, based on this SINGLE average of a value that can be off by as much as 0.5% depending on the lab. This comes back to what Scott and I talked about regarding carbohydrate consumption and judging what people eat.

Why do we do we allow any shaming – regarding food or based on snapshots of data – in our communities? Sometimes there is a conversation about the shaming that happens regarding food choices, but I don’t think we apply the same conversation to data-shaming. My hope is that one day, everyone feels safe sharing their A1c, or pictures of their CGM graphs, at any time – even if it’s not the outcome they were hoping for in that moment.

Diabetes is a constant learning process with constant decision-making. Why don’t we frame sharing data and perspectives like this:

  • Here’s what didn’t work today: (Image of a CGM roller coaster)”
  • “Wow, this (pre-bolusing and then xyz) worked! (Image of someone’s ideal CGM graph)”
  • “Hmm, I tried xyz, but didn’t quite work, I’m going to try xyz+1 next time (image of a spike on a CGM graph)”
  • “Just got my A1c back: X%. Helps me see that small changes are making a difference in the long run.”
  • “Just got my A1c back: X%. Brainstorming ideas with family/care team about what I can do differently.”

Will you join me in pledging to end data-shaming for PWDs (people with diabetes)?

  1. I pledge to stop making snap-judgments about other people’s diabetes data.One data point (A1c or a single BG reading) or a snapshot (3 hour or 24 hour CGM graph) does not tell the story of someone’s decision making and choices. It tells the outcomes of hundreds of decisions that we don’t know about, and hundreds of variables that someone doesn’t have control over. As it’s not our data and not our lives, we have no business making judgments regarding it.
  2. I pledge to start a conversation about data-shaming and bring awareness to this problem when I see it happening.
Please comment below if so, and share your thoughts on what else could be added to the pledge.

Determining your carbohydrate absorption rate (#DIYPS lessons learned)

Calculating your absorbed carbs after a large meal matters; here’s how to do it (lessons learned from #DIYPS): http://bit.ly/1wtHRec @danamlewis @scottleibrand

We recently reported a number of lessons from #DIYPS that have allowed us to greatly improve management of mealtime blood glucose in type 1 diabetes (n=1). One key component was measuring the rate at which carbs were absorbed into the bloodstream (in the absence of any prebolus or IOB), and tracking the carbohydrate decay over time. In order to effectively adapt these lessons from #DIYPS, it would be useful for others to do the same test. This post attempts to describe how to do so.

Prerequisites

This test is applicable to people with type 1 diabetes (with little or no natural insulin production) and requires the use of a continuous glucose monitor, such as the Dexcom G4. In order to eliminate as many variables as possible, it is important that no insulin is onboard (IOB) other than normal basal insulin. It is also important that nothing has been eaten recently, and that blood glucose levels are stable and in range. Since this test involves consuming carbohydrates without immediately bolusing for them, it is also useful if blood glucose levels are at the low end of normal range, ideally around 80 mg/dl. You can expect the test to take up to two hours, depending on the quantity of carbs consumed and the absorption rate.

Preparation and background

Once all these conditions are met, the actual test consists of consuming a premeasured quantity of carbohydrates (sugars or starches, without significant protein or fat), like a small juice box. In addition to measuring the rate at which carbs are absorbed, this test will also allow you to measure your carbohydrate to blood glucose ratio. In order to avoid raising blood sugars to unsafe levels, it is best to use 15 to 30 g of carbs, depending on your initial BG level and your carb to BG ratio.

If you do not know your carb to BG ratio, it can be calculated using your carb to insulin ratio (meal bolus ratio) divided by your correction ratio. For example, if your meal bolus ratio is 10 g carbs per 1U insulin, and your correction ratio is 40 mg/dl per 1U insulin, then your carb to BG ratio is 10g carbs to 40 mg/dl of BG; or more simply 1 g carbs to 4 mg/dl of BG. In that case, if your initial BG level is 80 mg/dl, and you consume 20 g of carbs, you should expect your BG to rise 80 mg/dl, to 160 mg/dl, by the end of the test. By observing how high your BG actually rises, you can determine whether or not your ratios are accurate, and if necessary re-estimate your carb to BG ratio.

Running the test

When you are ready to do the carbohydrate absorption rate self-test, simply note the time at which you consume the carbohydrates, and the CGM blood glucose level at that time. (Being aware of the accuracy of CGMs, you may decide to also test your BG with fingerstick/meter to correlate. Obviously, you’d want to do this self-test with a CGM sensor that you feel is “good” and in range with your BGs rather than one that doesn’t seem to be tracking very well.) Then, as each additional BG reading comes in every five minutes, note the time and BG level. You should expect to see BG stayed relatively constant for an initial delay period of roughly fifteen minutes, then rise steadily until all the carbohydrates are absorbed, and your BG has risen to approximately the level predicted by your carb to BG ratio. At that point, BG should flatten out, and you should administer a correction bolus. (If your ratios are correct, and no confounding factors are in play, the correction bolus should be approximately the same amount as the original meal bolus would have been for the carbs consumed at the beginning of the test. Again, if you have 20g of carbs and your correction ratio is 1u:40mg/dl, you would correct 2 units to bring yourself from 180 to 100; this would match the 2 units you would have taken for 20g of carbs given the 1u:10g carb ratio.)

example-of-consistent-rise-from-carbs-diyps

Example of the steady, consistent rise of BGs following carb consumption

Calculating results

Once the test is complete (or earlier, if you’re bored or impatient), you can note your initial carb absorption delay (the time required for glucose to get from your mouth to your CGM receiver), which is simply the time between when you ate the carbohydrates and the first significant uptick (generally more than 5 mg/dl in a 5 minute measurement interval). Then, once you start to see a sustained rise, you can calculate the rise rate. For example, if after 30 minutes from the start of the rise (~45 minutes from when you ate the carbs) you’ve risen 60 mg/dl, that would be a rise rate of 2 mg/dl/minute. If your carb to BG ratio is 1 g carbs to 4 mg/dl of BG, that would equate to 0.5 g carbs / minute, or 30 g carbs / hour.

diyps-how-to-calculate-carbohydrate-absorption-rate-for-people-with-type-1-diabetes-by-danamlewis

You may see that your carb absorption rate has an initial ramp-up period, and that it takes a few data points before BG begins rising steadily at ~10 mg/dl per data point (each data point is 5 minutes). Similarly, you may see that the BG rise flattens off gradually at the end. However, if your experience is like ours, you’ll see that for most of the time the carbs are being absorbed, the rise rate is fairly steady. For this reason, we find it useful to approximate the carb absorption curve by assuming an initial delay, where BG remains flat, followed by a linear rise at a constant rate (2mg/dl/min in Dana’s case), until all the carbs are absorbed and BG flattens out.

Calculating unabsorbed carbs after a meal

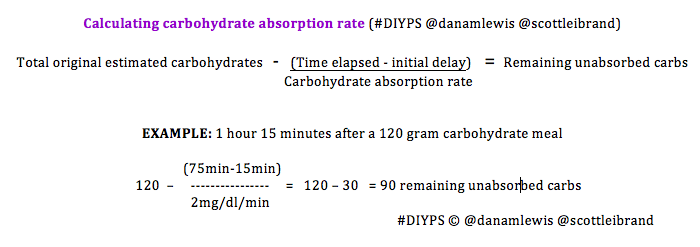
Modeling carbohydrate absorption in that way allows you to fairly easily calculate how many carbs remain unabsorbed after a meal: simply subtract the initial carb absorption delay (~15m for Dana) and divide by the carb absorption rate (~2mg/dl/min) to see how many carbs are absorbed, and subtract that from the estimated meal carbs to get an idea of how much still remains to be absorbed. This, in turn, enables you to do a meal bolus calculation (as if you were just now eating the unabsorbed carbs) to determine whether your IOB is too high (while you still have time to do a zero temp basal) or too low (allowing you to safely administer an additional correction bolus even before your BG is done rising from the meal). #DIYPS uses this algorithm to repeatedly re-evaluate the remaining/active carbohydrates in the body and compare it to the IOB. Given that things can change quickly (especially with exercise/activity after a meal), the possibility of miscalculated carbohydrates ingested, or simply the body’s variable response to insulin, recalculating this repeatedly helps provide an additional safety net after meals.

Going from n=1 to n>1

The simple self-test and calculations above should provide people with type 1 diabetes a method to approximate their own carb absorption rate and calculate carbs on board at any time after a meal.

If you do perform this or a similar test and determine your carb absorption rate, it would be interesting and useful (especially in developing #DIYPS to be suitable for more widespread use) to compare results and see how carb absorption varies from person to person. If you are willing to share your results, please reach out to us to share (privately) whatever information you are comfortable sharing, such as carb absorption rate, carb to BG ratio, carb to insulin meal bolus ratio, and/or insulin to BG correction ratio. We will not share your individual data, but if we get enough responses, we will share aggregated statistics (average, median, standard deviation, etc.) so that people who have not done their own carb absorption test can still get a better idea of how fast their mealtime carbohydrates should be absorbed.

#DIYPS findings can help people with type 1 diabetes, regardless of tech, better manage post-meal blood glucose

Over the past few months, while developing #DIYPS, we have discovered a few things about mealtime blood glucose (BG) levels that we thought would be worth sharing more broadly. Using the insights, tips, and techniques below, it should be possible for many people with type 1 diabetes to more effectively keep their post-meal (post-prandial) BG levels in range. Here’s what we’ve learned…

After an initial carb absorption delay…

When carbohydrates are consumed, as part of a meal or snack, or to correct a low-blood-glucose (BG) situation, it causes BG to rise, but that rise is both delayed and gradual. In developing #DIYPS’s model, we discovered that for n=1, there is a delay of approximately 15 minutes between carb consumption and when BG starts to rise (as measured by a Dexcom G4 CGM, which actually measures subcutaneous interstitial-fluid glucose levels).

Subsequent carb absorption rate is constant…

In addition, we discovered that the rate at which BG rises after carb consumption is fairly constant, both across food types and over time. For n=1, we observed that carbohydrates are digested and absorbed at a rate of approximately 30g/hour (0.5g/minute), and that this rate is relatively constant beginning after the initial 15-minute lag, and lasting until the last of the carbs are absorbed (up to 4 hours later, in the case of a large 120-carb meal).

Regardless of glycemic index…

We also observed that, for real-world meals, glycemic index (GI) doesn’t matter much for carb absorption rate. Our initial testing was performed on high-GI foods used to correct low BG (juice and Mountain Dew) and a milkshake consumed without corrective insulin while participating in an unrelated clinical trial (to try to detect any endogenous insulin production, which was not present). However, in subsequent real-world use of #DIYPS, we’ve observed the same for almost all meal types. It seems that for meals containing at least some sugar, starch, or other highly accessible form of carbohydrates, the body seems to begin digesting and absorbing the most accessible carbs immediately, and is able to break down low-glycemic-index carbohydrates by the time the higher-GI foods are absorbed.

Additionally, insulin activity at mealtime matters a lot…

While developing and testing #DIYPS (and working to bring A1c down a full percentage point), we also observed that the level of insulin activity at the start of a meal matters a great deal in determining whether BG rises significantly as the meal carbs are absorbed by the body.

Pre-boluses can help…

One fairly common technique for dealing with this, among people with type 1 diabetes, is the pre-bolus. This generally means estimating insulin requirements for an upcoming meal, and bolusing or injecting fast-acting insulin approximately 15 minutes before the meal. Such pre-boluses do help somewhat in preventing large spikes in BG immediately after meals, but in our experience an 80-point BG rise (from 80mg/dl to 160mg/dl, for example) is still common for meals consumed “on an empty stomach” with little or no extra insulin on board (IOB) prior to the pre-bolus.

But pre-bolusing can sometimes be dangerous…

Also, pre-bolusing can contribute to dangerously low BG (hypoglycemia) if a meal is delayed or if you end up eating fewer carbs than expected.

And what really matters is not IOB, but insulin activity…

Based on observing the differences in post-meal (post-prandial) BG between empty-stomach meals and those where insulin was already on board and at full activity from small snacks or correction boluses 1-2h prior to the meal[1], it appears that what actually makes the most difference for post-meal BG is not how much insulin is on board (IOB) at the start of meal time, but rather how much insulin has already been absorbed into the bloodstream and is at full activity.

Because the liver needs insulin when the carbs first hit…

When carbohydrates are initially absorbed by the small intestine, they are directed into the portal vein and pass through the liver before reaching the rest of the body’s circulatory system. The liver is designed to absorb any excess glucose out of the blood at that point, storing it for later release. The mechanism by which the liver does so is dependent on two factors: the presence of higher glucose levels in the portal vein than in general circulation (indicative of ongoing carb absorption), and the presence of sufficient active insulin. If enough insulin is fully active, the liver can absorb ingested carbs just as fast as they can be absorbed from the intestine. If not, then the glucose passes through the liver into general circulation, and cannot be subsequently absorbed by this mechanism, but must be absorbed later by peripheral tissues once insulin levels get high enough.

And a 15m pre-bolus doesn’t get insulin active fast enough…

Even fast-acting insulin does not reach peak activity for 60-90 minutes after injection, since it must be absorbed through subcutaneous tissue into the bloodstream. This means that, if no insulin is on board from previous boluses, the pre-bolus insulin doesn’t really kick in for 30 minutes or more after the start of the meal. In the time it takes pre-bolus insulin to kick in, the body might absorb 15-20g of carbohydrates, resulting in a 60-80 mg/dl rise in BG.

So, some insulin is needed sooner…

So we need to get enough insulin active at mealtime to allow the liver to do its job, but not so much as to cause low BG before or after the meal. The best way we’ve found to do this is to do a small early pre-bolus about an hour prior to a meal. We calculate the size of the early pre-bolus based on the current BG, by determining how much insulin we can safely add and still stay above 80 mg/dl for 1-2 hours. In our case, that means assuming that up to 75% of the insulin activity will occur before the meal carbs kick in. So for a BG of 110 mg/dl an hour prior to the meal, and a correction ratio of 40 mg/dl per unit of insulin, it would be safe to bolus 1 unit of insulin. That 1 U then ramps up to peak activity right at mealtime, and largely prevents any substantial rise in BG immediately after the meal.

Finally, we can time mealtime insulin based on carb absorption…

Once we’re almost ready to eat and it’s time for a normal pre-bolus, it’s important not to over-bolus for all our carbs all at once. Doing so (particularly after a successful early pre-bolus for a large meal) risks causing post-meal low BG, as insulin activity can peak before all the meal carbs can be absorbed. For example, a large meal with 90g of carbohydrates would take 3 hours to absorb, but insulin activity often peaks after 60-90 minutes. So what we have developed and incorporated into #DIYPS is a relatively simple meal-bolus algorithm that dramatically reduces high- and low-BG situations after meals. The most important feature of this algorithm can be implemented manually without #DIYPS, either via multiple boluses or via a combo/dual/“square wave” bolus. The key idea is to bolus only for those carbs that will be absorbed by the time the insulin hits peak activity. So if you have a large meal, you might decide to bolus at mealtime for only the first 30g of carbs initially (minus any prebolus), since those will be absorbed over the first 60 minutes. If the meal totals 60g of carbs, you will then want to bolus for the next 30g of carbs over the next hour, possibly via a continual delayed (“square wave”) bolus, or by doing one or more manual bolus(es) after the meal is over. (The latter strategy is similar to what #DIYPS does, in 0.5U increments, as it allows you to react if you eat more or fewer carbs than expected, or if BG rises or falls unexpectedly in the interim.)

Resulting in almost flat BG, even after large meals…

By combining all these strategies, and providing real-time feedback and alerts when boluses, temp basals, or carbs are necessary, #DIYPS has allowed us to largely eliminate post-meal hyperglycemia, while minimizing risk of hypoglycemia. As detailed previously, this has helped reduce A1c by a full percentage point, reduce BG standard deviation, and increase time in range. While such impressive results are hard to achieve without assistance, it definitely should be possible for many people with diabetes to improve their own ability to manage post-meal BG levels by adopting some of the same techniques into their own self-care.

Note: there have been some updated posts since this original post about how to easily do the “eating soon” mode approach. Take a look at these illustrations for more details on it!

Footnote

[1] A few weeks ago, we were enjoying a weekend down in Portland. Normally, Dana eats a fairly low-carb breakfast, small snacks throughout the day as needed, and ends up with a fair bit of insulin activity at lunch and dinner time. That weekend, however, we had two very large spikes in postprandial blood glucose, after a late brunch, and then again after dinner, following a hike at Multnomah Falls. The next day, we saw a much smaller post-meal rise after brunch, as she had corrected a morning low with juice, and then bolused to prevent a rebound, so that insulin was near full activity at brunch time. Subsequently, we have incorporated these insights into #DIYPS’s “eating soon” mode, and have been able to much more consistently prevent large BG spikes immediately after meals.

#DIYPS, pathways to Artificial Pancreas Systems, and diabetes technology for all

#DIYPS=on path to artificial pancreas but not limited to those using newest diabetes tech. http://bit.ly/1mMS7LA @danamlewis @scottleibrand

Like many others, we’ve been reading the latest in the New York Times about the impact of diabetes technology innovation on the cost of managing the disease – not to mention the reactions to the piece, the response to the reactions, the reactions to that, etc.

We believe there is a better way forward, and #WeAreNotWaiting to make it happen.  Innovation can happen in a low-cost way, and can be scaled to support a broad patient audience, without contributing to or requiring significantly increased healthcare costs. #DIYPS for example (check out these results) was developed by two individuals, not an organization, with the goal of solving a well-known problem with an existing FDA-approved medical device. As recounted here (from Scott) and here (from Dana), we set out to figure out a way to augment continuous glucose monitor (CGM) alerts, which aren’t loud enough to wake heavy sleepers, and to alert a loved one if the patient is not responding.

We were able to solve those problems, and include additional features such as:

  •  Real-time processing of BG, insulin on board, and carbohydrate decay
  •  Customizable alerts based on CGM data and trends
  •  Real-time predictive alerts for future high or low BG states (hours in advance)
  •  Continually updated recommendations for required insulin or carbs

While #DIYPS was invented for purposes of better using a continuous glucose monitor (CGM) and initially tailored for use with an insulin pump, what we discovered is that #DIYPS can actually be used with many types of diabetes technology. It can be utilized by those with:

  • CGM and insulin pump
  • CGM and multiple daily injections (MDI) of insulin
  • no CGM (fingerstick testing with BG meter) and insulin pump
  • no CGM (fingerstick testing with BG meter) and multiple daily injections (MDI) of insulin

We think this type of device-agnostic software/technology is critical as we work on pathways to the artificial pancreas systems (APS). While we hope APS is out on the market soon (10 years ago would’ve been nice :)), we know it will take several years to a decade. And, even when it comes out, APS will be expensive. It may not be covered by insurance. Even with insurance, people may not be able to afford it. And even if everyone could afford it, some people may prefer not to use it.

We believe technology like #DIYPS can, and must, scale to take advantage of real-time data from CGMs, insulin pumps, and any other new diabetes technology, and help patients achieve the best possible health and quality-of-life outcomes while waiting for APS systems to become available.  But at the same time, we want to build these types of tools so that anyone with any combination of diabetes tools can use them to better self-manage their own particular condition. For example, availability of bolus calculator tools is often limited to those with pumps.  #DIYPS can be used as a simple bolus calculator, with the added benefit that it can keep track of carb absorption and allow the user to calculate correction accurate boluses while still digesting a meal.  Packaged into a simple web or app interface, this would allow people to do the same type of quick data input and calculations to be able to verify/support their mental math.

While #DIYPS is a very effective prototype, we don’t expect it to be the only interface that everyone with Type 1 diabetes uses.  Rather, we hope to integrate it with projects like Tidepool that will allow anyone, with any kind of meter, pump, or CGM, to easily upload their data, and then use any number of tools like #DIYPS to interact with their own data and get both real-time and historical insights from it that will let them improve their own diabetes self-care.  However, to make this possible, we need all medical device makers to open up their devices to allow patients real-time programmatic access to their own data. (A good example – there’s no access to temp basal history on Medtronic pumps!)

We need people and companies with innovative ideas to focus on making those ideas available as device-agnostic software, not solely as a proprietary feature on a single non-interoperable medical device.  And most of all, we need everyone to focus on making the fruits of innovation available as widely as possible, even to patients without the financial resources to buy cutting-edge hardware.

After all, #DIYPS is proof that low-cost innovation can have big results.

Initial findings from #DIYPS after 100 days and comparing it to a bionic pancreas

#DIYPS + @danamlewis = as good as a bionic pancreas! Reduced avg. BG & time spent <60mg/dl. Details: http://bit.ly/1qF6qRp @scottleibrand

 —

Recently, diaTribe published a summary of results presented by Dr. Ed Damiano at #ATTD2014 showing how their bionic pancreas closed loop artificial pancreas system (APS) improved average glucose levels and halved time spent <60 mg/dl in patients with Type 1 Diabetes (T1D), compared to when those same patients were not wearing the system.  The numbers are impressive: mean glucose was reduced from 159 mg/dl to 133 mg/dl in the Beacon Hill study (n=20 adults, 5 days data per patient, for a total of 100 bionic pancreas days).  If that were sustained over the long term and converted to an A1c value, that would represent a 0.9% improvement, from 7.1% to 6.2%. As diaTribe points out, “Those results are unheard of for any diabetes drug or device.”

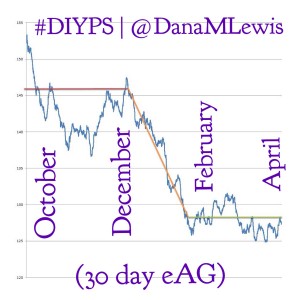
Given those results, we wanted to see how the bionic pancreas results compared to the results for #DIYPS, and the results were equally impressive: 90-day eAG was better than in any of the study control groups prior to using the system (before #DIYPS =146 mg/dl) and eAG was further reduced to better than any of the bionic pancreas treatment groups (after #DIYPS = 128 mg/dl) after utilizing #DIYPS.  Time spent <60 mg/dl was already lower than for any of the bionic pancreas treatment groups (before #DIYPS = 1.2%), but was reduced still further to 0.9% with #DIYPS.

@danamlewis 30 day estimated average glucose values. Note – #DIYPS began in December.

(Note that for #DIYPS, n=1 at the moment.  These results are specific to a single highly motivated individual, who was already doing everything possible to manage T1D.)

The pre-DIYPS control condition included wearing and using both a continuous glucose monitor (CGM) and an insulin pump.  It is not clear from the diaTribe article whether the subjects in the bionic pancreas study under their “Usual Care” or “Supervised Camp Care” control conditions included the use of such technology, or whether they were using the more common methods of fingerstick meters and multiple daily injections (MDI) of insulin.  If “Usual Care” included patients on MDI, much of the benefit attributed to the bionic pancreas could be attainable using CGM+pump therapy as well.  The #DIYPS data, however, shows significant improvements even compared to CGM+pump in the control condition.

While n=1 (vs. n=20 and n=32 in the two bionic pancreas studies), the #DIYPS data shows the effects of much longer term usage of the #DIYPS system.  The total time using the system (90-100 days) was equivalent between our data and the Beacon Hill study. Also, because #DIYPS has been in use for 100 days now, we have now seen the results in actual A1c values, not just eAG-calculated Projected A1c.  The improvement from pre-DIYPS A1c to the first post-DIYPS A1c data point is consistent with the improvement shown by the calculated eAG results. (Note that we plan to validate with additional data from A1c testing to show the actual improvement in A1c attributable to #DIYPS, and hopefully validating the sustainability of using the system).

Differences between the bionic pancreas & #DIYPS

Part of what makes the bionic pancreas so promising is that it is able to dose glucagon (through a second pump) to correct low or falling BGs. Because #DIYPS uses only an existing FDA-approved CGM, relies on the patient to dose their own insulin through an FDA-approved insulin pump, and is not using glucagon, #DIYPS might not be expected to be able to prevent hypoglycemia as well as the bionic pancreas. However, our data show that #DIYPS’ predictive alarms and proactive correction suggestions allow a patient to prevent hypoglycemia (BGs <60 mg/dl) even better than the bionic pancreas can do. (#DIYPS also suggests, when possible, using temporary basal rates, which often reduces the extra carbohydrates that have to be consumed to prevent or correct a low BG).  Less-motivated patients using #DIYPS may not be able to prevent low BGs quite as effectively, but this is still an important demonstration that such improvements in control are possible before new glucagon pump technology is available on the market in the future.

Differences between bionic pancreas, artificial pancreas systems (APS), and #DIYPS

And finally, and most importantly as a distinction of the difference from the bionic pancreas, #DIYPS does not automatically dose insulin.  It is solely an alerting system (with predictive alerting and real-time calculation abilities), which relies on the user to both validate any suggested actions, and to actually dose any insulin, reduce insulin, or consume any carbohydrates required to manage their BGs.  This means #DIYPS is not an artificial pancreas system (APS), and does not provide the ability  for you to “forget about diabetes” that is such a powerful promise of true APS systems like the bionic pancreas. Yet it does reduce the overall cognitive load of diabetes (and provides additional security mechanisms such as alerting loved ones if you don’t respond to alarms over time). And, #DIYPS shows that better software and alerting can result in dramatic improvements in blood glucose levels, even without automatic dosing of insulin.

What’s next for #DIYPS

As you can tell, we are excited about the promise of #DIYPS for helping people with diabetes (PWD) manage their disease.  But, as mentioned above, all of this is currently being done in our spare time, with no funding or institutional support.  We, and a small group of like-minded individuals and non-profits scattered across the Internet, have decided that #WeAreNotWaiting for research labs and medical device companies to develop a full APS system and get it approved by the FDA (which is still probably 5 years away). Instead, we are doing what we can to make progress now.

But the next step is critical: we need to make this technology available to the people whose quality of life – and possibly even whose lives – depend on it. (This is why we originally set out to build #DIYPS – to help people wake up to overnight CGM alerts who sleep through the one-size-fit-all alarms coming from the device).  Recently we received an email from someone in Europe whose MD tells her that her severe nocturnal hypoglycemia is life threatening, and sent her on a mission to find a system that can wake her up from a severe low and contact a loved one if she doesn’t respond.  In order to help people like her, we need to begin working with researchers and doctors, and hopefully even get funding to develop #DIYPS into a scalable system that can help any PWD manage their diabetes better.

If you are someone (or know anyone) who can help with any aspect of that effort, please reach out to us on Twitter or directly by email. Otherwise, please stay tuned for more updates.

Dana Lewis and Scott Leibrand


#DIYPS and Pizza, and wondering why we judge people with diabetes for how and what they eat

What’s your reaction if you read that someone with Type 1 diabetes just ate 110 carbs worth of pizza for dinner?

Go ahead, answer the question out loud (or write it down) before continuing.

No, really. Did you say it out loud? Or at least think about it?

Now, what if you find out that their BG never spiked (only rose 10 points) and then glided along in range (80<in range<150) for the rest of the night?

Were they lucky? Was it a fluke? Or was it the way that it (eating food) actually should work?

If you’re like many of us, your initial reaction (the one we asked you to say out loud so you wouldn’t mis-remember it later) was probably something along the lines of “that isn’t very responsible”. It just *makes sense* to judge someone for eating food that is “so obviously bad” for them. But, is the food bad for them? Or is what we’re trying to say (think) that the food is likely to lead to “bad” or out of range BGs, therefore it’s not a good idea to consume (or consume so much)?

Maybe we shouldn’t be blaming people with type 1 diabetes for not eating “right” or “trying hard enough” to get the health outcomes they want (and we all want for them). Maybe we all need to start working on putting together all the technology that already exists, in a way that actually allows people with T1D to live a normal life and worry less about constantly managing their BGs. The way #DIYPS does for me.

We also need to start working on changing the intuitive attitude that the problem is a lack of “compliance” (related – read this great post from Kerri on “compliance”) with diabetes management/treatment. Instead, why don’t we all work with patients to understand what is difficult for them about managing their diabetes, and what changes we might be able to make in the processes, systems, and technology they use to make it easier and more effective to do so.

(You may be wondering where this blog post came from. It’s related to #DIYPS – I tested the system one night by eating several slices of a frozen gluten-free pizza, which while convenient is often higher carb than the already-high-carb food. And, my instinct was not to talk exactly about how much and what I ate, because I’ve experienced so many times over the years a judgement from observers (with or without diabetes) about what I personally choose to consume – whether it’s a bite (or a correctly portioned serving) of dessert, pizza, or whatever someone thinks is not acceptable for someone with diabetes. Scott was surprised by the guarded way I was choosing to document and characterize this test, and this post is the result of our discussion.)

Thanks to #DIYPS, I’ve found (several times, the above scenario has proved not to be a fluke!) that I can eat large meals full of carbohydrates, and have no or minimal spike in my blood glucose. It doesn’t matter if it’s high protein, high fat, a mix, or lots of sugar (like a milkshake). And that’s changed the way I feel about talking about large-carb/”non-diabetes friendly” meals.

There’s a well-known stigma related to food for people with diabetes, but no one seems to know a way to remove the stigma. We’re wondering if tools like #DIYPS (and being able to see the data and more outcomes when someone DOES eat pizza and *is* ok BG-wise) will help change the conversation?

Dana Lewis

#DIYPS goes mobile

We’ve made progress to enable #DIYPS for on-the-go use.

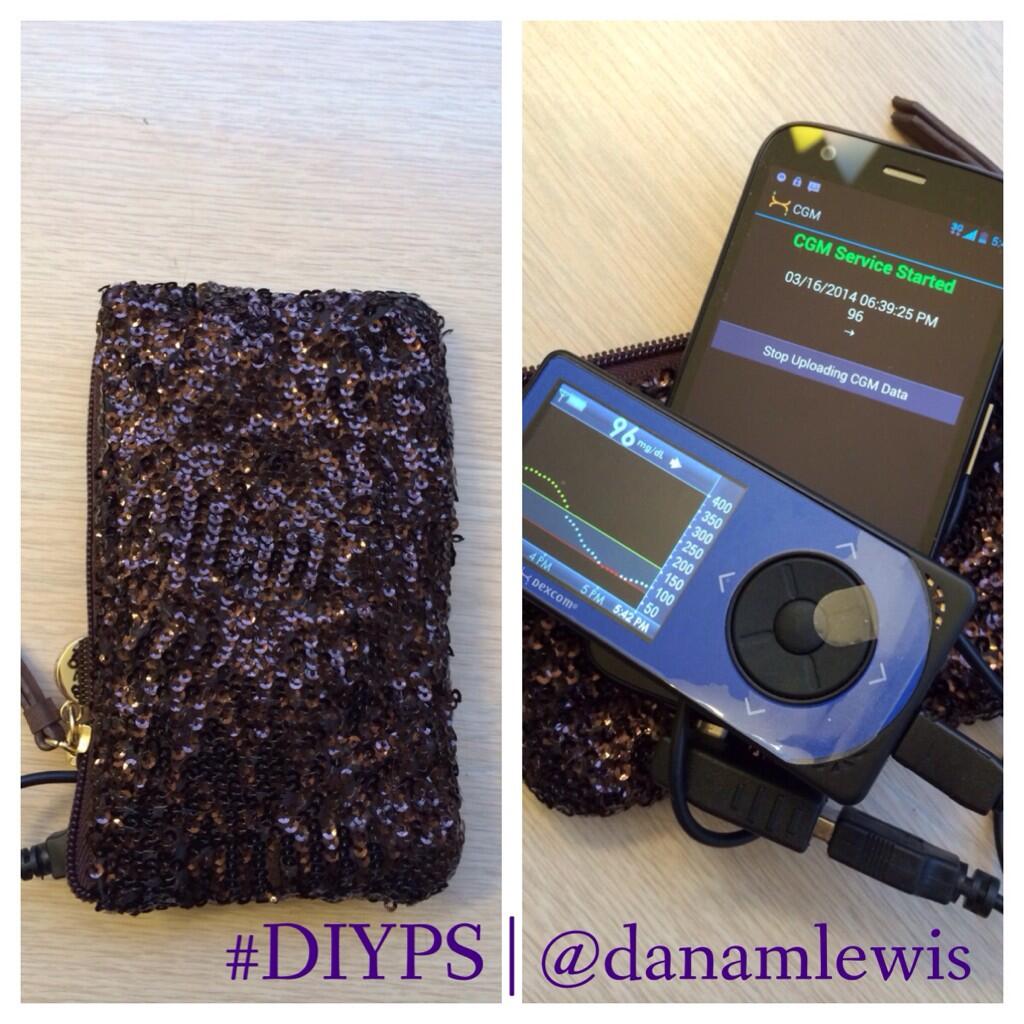
Previously, we’ve only been able to use it when at home and able to plug the CGM in to an old laptop running Windows. Now, we can get real time predictive alerts anywhere, thanks to an unlocked Moto G that we plug the CGM into. Thanks again to John’s help and his code, the data from the CGM can now be uploaded to the cloud from the phone. We originally planned to use the Moto G on WiFi only, but because of other phone upgrades we ended up finding a cheap way to get data on the Moto G, and will be testing it with data for the next ~6 months.

One challenge for #DIYPS going mobile is that this is another device and more “stuff” a PWD has to carry around. For now, I’m using this case so I can easily drop it in or pull it out of my larger bag that I carry around on most days, while keeping the cords secure. (I’ve found the Moto G’s charger and cords don’t plug in as securely as other devices that we’re used to.)

diyps_goes_mobile

Next steps for #DIYPS mobile testing include using the Moto G and #DIYPS while out running, since I don’t have to rely on WiFi for #DIYPS. It’ll take a few more weeks before I can run regularly due to the cold, rainy Seattle weather, but this will be the most effective road test (pun intended) of the mobile capabilities, and will enable me to test #DIYPS for the first time during intense exercise.

We are also working with Brian, who’s helping us test the system and clean up the #DIYPS code.  We want to get it modular enough for more people to install and use the code more easily, and figure out a better UI (with graphs!). We also want to plug into the frameworks John and Tidepool are using, so we can take advantage of all the great work they’re doing as well.

Stay tuned for more updates.  And if you have some interest and expertise and want to help out, please reach out to us on Twitter or directly.

Dana Lewis and Scott Leibrand