One of the frequent complaints in the literature about exocrine pancreatic insufficiency (known as EPI in some parts of the world, or PEI for pancreatic exocrine insufficiency elsewhere) is that the symptoms are not specific and they can overlap with other conditions. Diarrhea, for example, can happen from a lot of conditions and a lot of medications. Not everyone with EPI has diarrhea, though. Another problem is that there are other symptoms that occur in EPI other than diarrhea and weight loss, but there’s not been any data on which groups of people experience which types of symptoms with EPI, or how common the other symptoms are, so they often aren’t listed. This leads to a cycle of lack of awareness, lack of screening, lack of diagnosis, and lack of treatment.
There’s been little effort to date to solve this problem, and I found myself wondering if we as patients, who experience the symptoms directly, could find a way to address this. Between my systematic review papers (where I’ve read hundreds of papers about the symptoms & diagnostic approaches to EPI) and personal experience with EPI, I made a list of 15 symptoms. But it’s not just about which symptoms people have: that’s where the overlap problem comes in. With EPI, many people have a lot of symptoms, a lot of the time, and they are VERY annoying. So the frequency and severity of the symptoms are a hallmark as well. I put together a way to quantify the frequency and severity (using plain language)of symptoms, and the EPI/PEI-SS (Exocrine Pancreatic Insufficiency Symptom Score) was born.
With help from more than a dozen people, some with EPI and some who didn’t have EPI, I ran a pilot test with the symptom score to see if the people with EPI would generate scores, the way I did, and whether people without EPI (and with either everyday gastrointestinal symptoms, or other conditions that sometimes cause GI symptoms) would have scores to match. They did not: it was a stark difference, and there wasn’t any overlap. The EPI symptom burden was quantifiably much higher than everyday GI symptoms for someone without a condition, and also higher compared to people with other conditions with GI symptoms (think food intolerances, IBS, other non-EPI GI conditions).
So I launched a bigger study that many of you participated in (thank you!), with the goal of exploring whether this score would be useful in the general population to help distinguish EPI from other conditions and whether it might possibly aid in screening for EPI.
And now, the results are published! (You can read the full open access paper here: https://doi.org/10.3390/epidemiologia6030048).
Here’s what we learned:
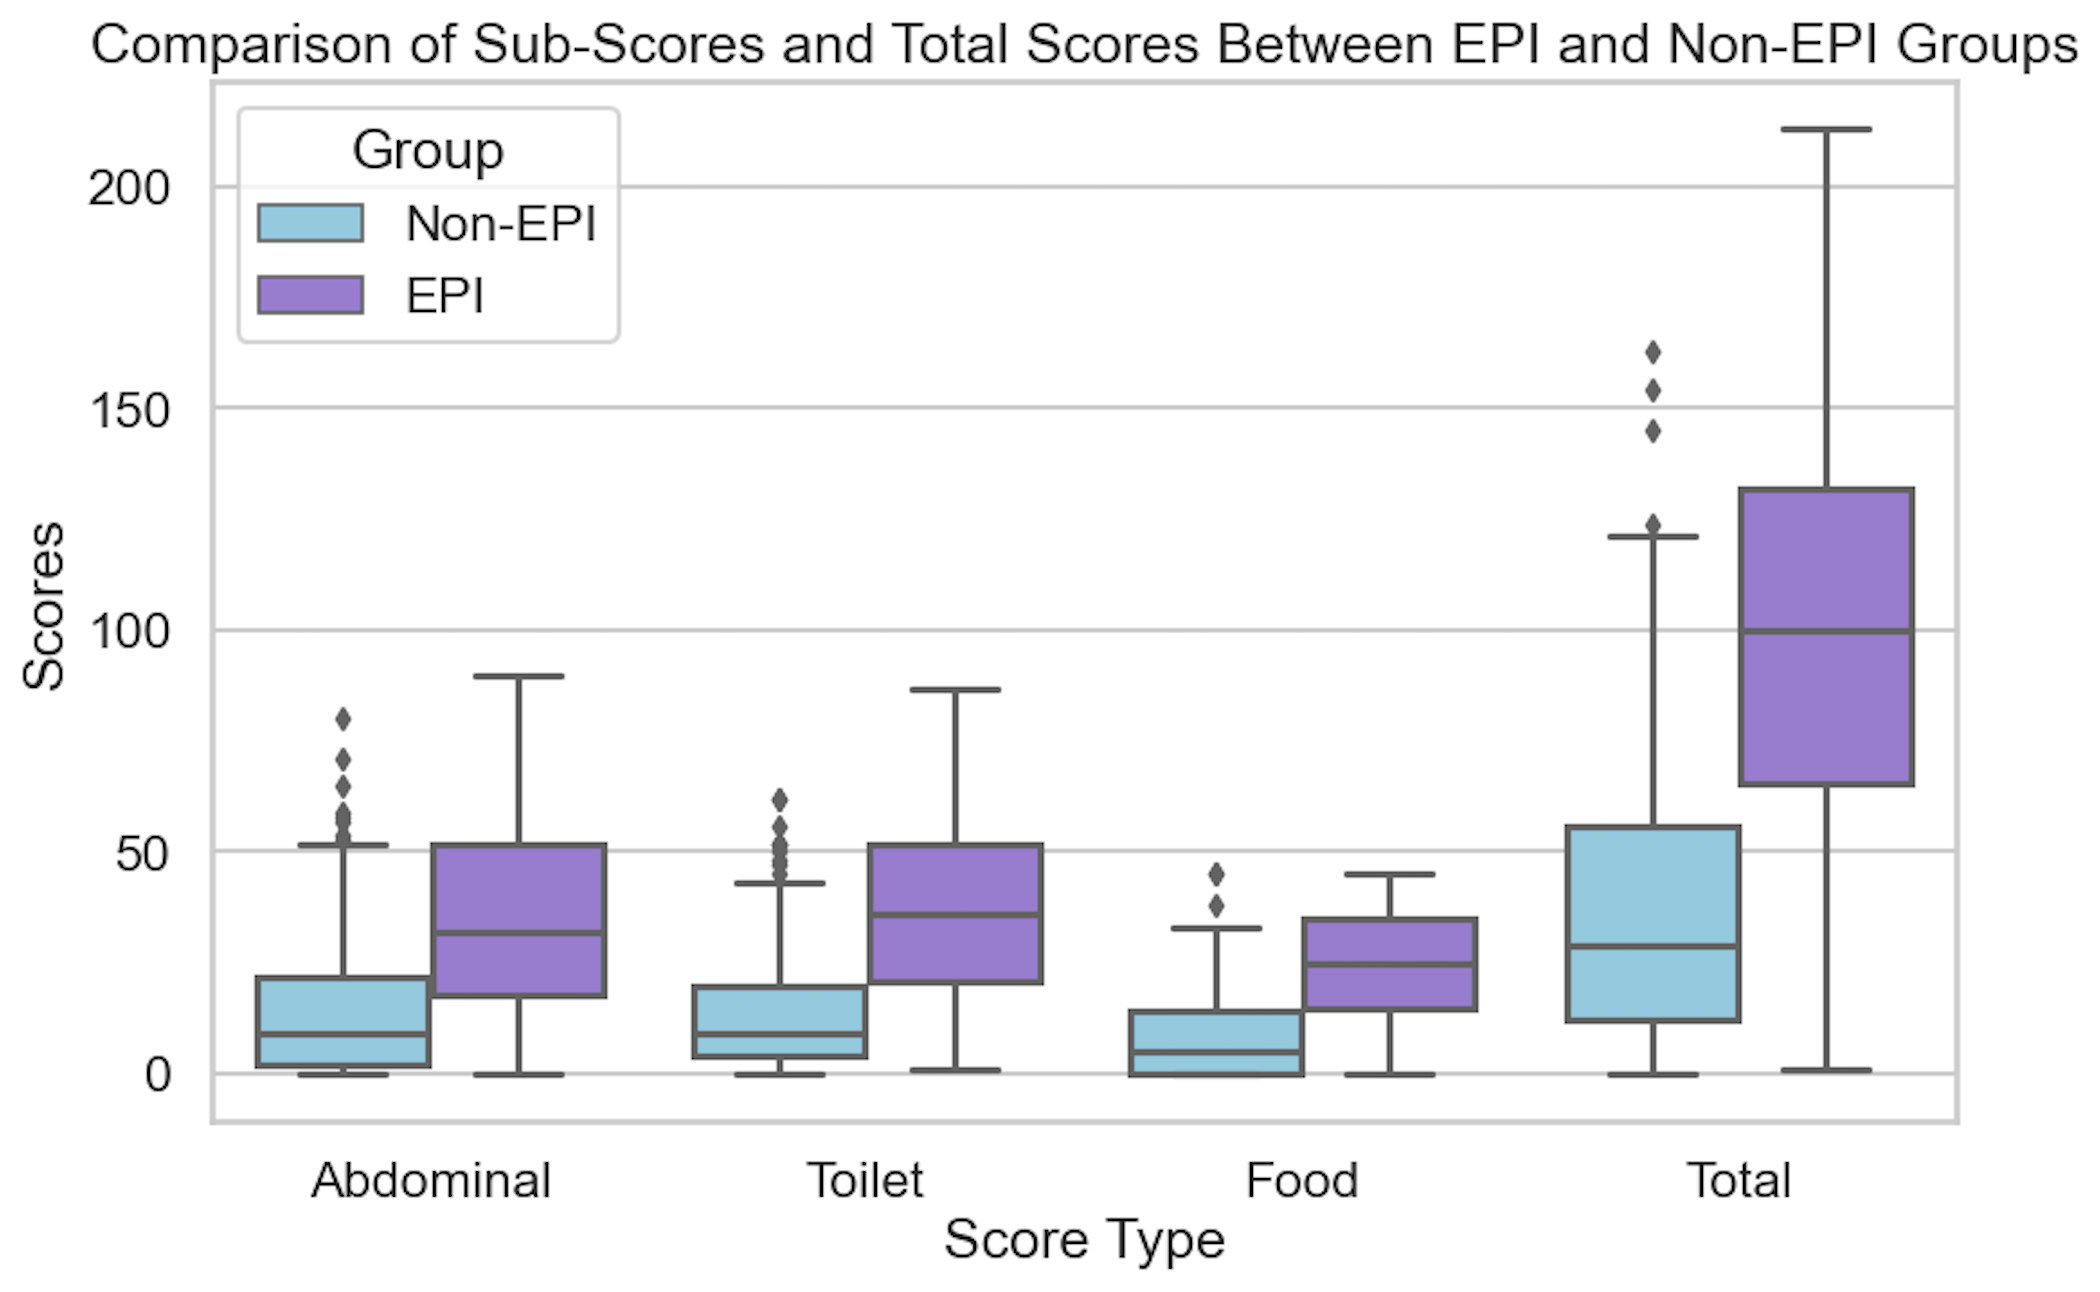
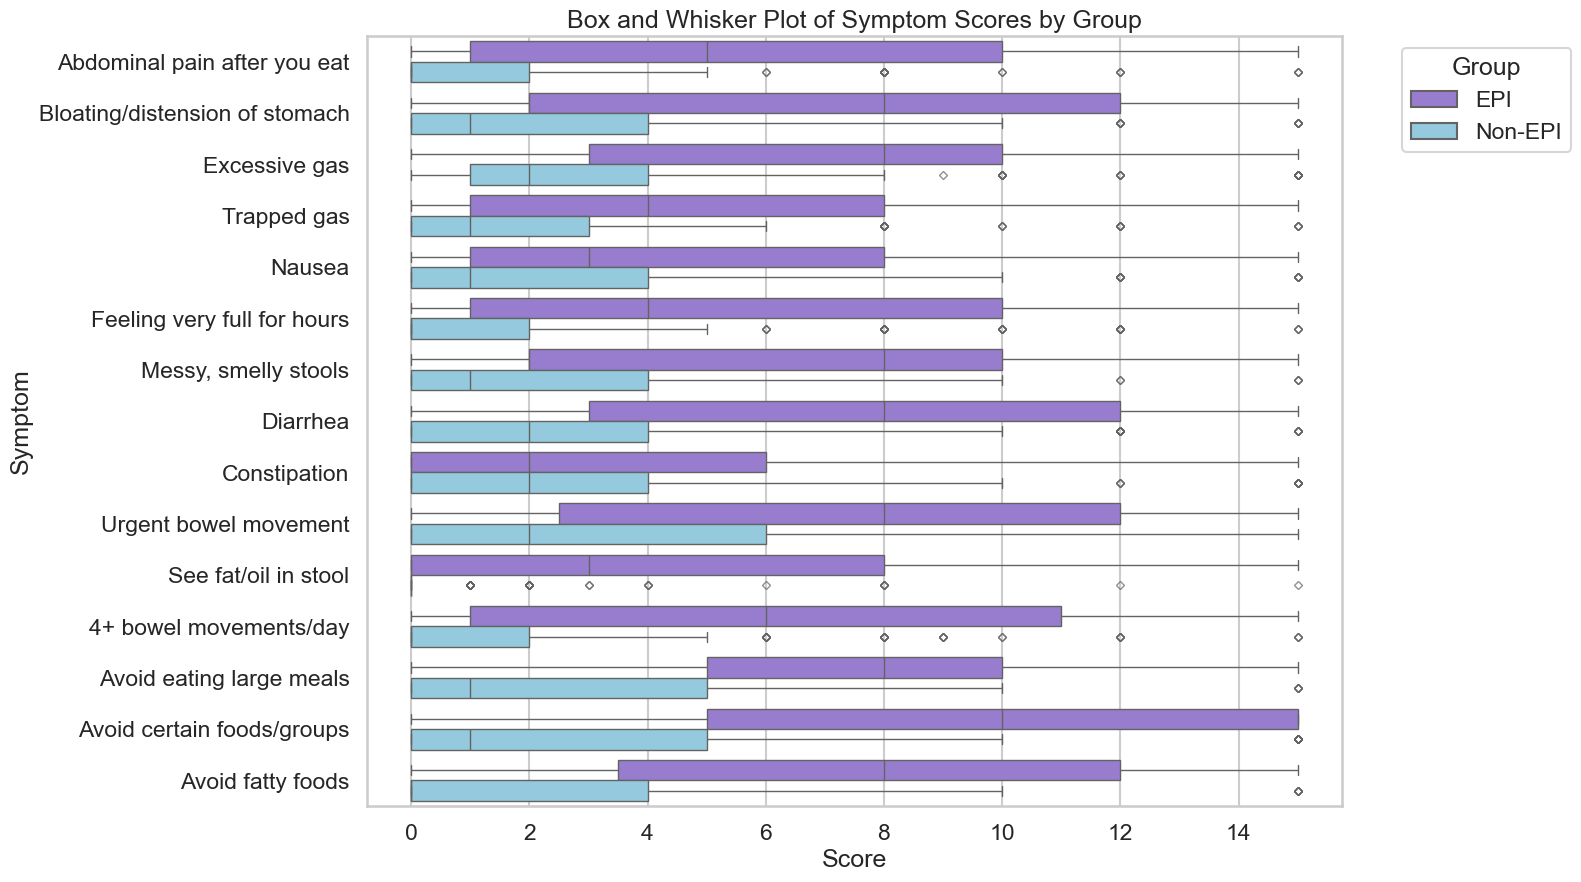
There were 324 participants at the time I cut off data collection for the analysis (after three weeks). This included 155 people who identified as having EPI, and 169 people without EPI. Everyone answered whether or not they had any of the 15 symptoms (falling into three groups: abdominal, toilet-related, and food-related symptoms) and indicated frequency and severity. Multiplying frequency (0–5) x severity (0–3) by each of the 15 symptoms, the EPI/PEI-SS score range is 0–225. (See Table 1 for a list of the symptoms and rating description).
The key finding: people with EPI had higher scores than people without EPI.
In this real-world study, the mean total score of those with EPI was 98.11 (min 1, max 213), in contrast to a mean total score of 38.86 for those without EPI (min 0, max 163). The difference is practically as well as statistically (p<.001) significant.
Even when I separated the people without EPI into two groups, those with other gastrointestinal conditions and those without, the scores were still distinct and statistically significant from the people with EPI. I also did a sub-analysis of each individual condition and none had a significant impact on the overall score. (Because there are so many people with diabetes in my network who participated in the study, I also ran a separate sub-analysis to deeply analyse the contributions of type 1 diabetes and type 2 diabetes – and made a separate paper on this analysis, which is also open access and available to read here.) Also in the bucket of “things that did not affect the score” was age. However, females in the study reported higher scores compared to males (this matches other studies showing a higher gastrointestinal burden, so this isn’t necessarily unique to EPI).
In addition to the overall score, you can see the difference by looking at the number of symptoms people reported and the difference in frequency and severity:
- EPI group: 12.39 symptoms, average frequency 3.02, average severity 1.73
- Non-EPI group: 8.15 symptoms, with nearly half the frequency (1.55) and severity (0.91)
Nerdy notes (you can read more in the full paper): Cohen’s d (1.475) indicated a large effect size; all comparisons overall and across sub-groups and across symptom categories were statistically significant (p<0.001). Cronbach’s alpha for sub-score categories was “good” (0.88 abdominal, 0.83 toilet, 0.88 food), indicating high internal consistency and good construct validity. Using an EPI/PEI-SS cutoff of 59 (out of possible 225), area under the curve was 0.85, sensitivity was 0.81, and specificity was 0.75.
Were there limitations for this study? You bet. It was online and based on people who happened to fill it out, so follow up studies will help confirm these results in different populations to confirm if it is representative of the average EPI experience. (Note though that this study population did have a lot more diversity of people with EPI, though, compared to most other EPI-related symptom assessment studies, which are often limited to chronic pancreatitis and cystic fibrosis, and/or pancreatic surgery/cancer.) There was a large number of people with diabetes who participated, in part because of my network and where I recruited participants from – however, as seen in this sub-study, presence of diabetes (any type, or split in type 1 and type 2) did not influence scores (analysis here). This study was also exploratory, meaning it was not powered for a specified outcome. We’ve now been able to use this data to power follow up studies, now that we know what to expect score-wise in people with and without EPI!
What should you take away from this study?
If you are a person with some kind of gastrointestinal symptoms, you can use the EPI/PEI-SS to explore your symptoms and quantify them based on frequency and severity. If your score is near or above the cutoff, you may want to consider discussing your symptoms with your doctor and exploring whether testing for EPI (often fecal elastase testing) is warranted. This tool hasn’t been validated as a diagnostic method, but this data can help the shared decision making process and hopefully also aid you in a better conversation with your doctor as you explore pathways to solutions.
The EPI/PEI-SS is available online, for free, and you can use it right now: https://danamlewis.github.io/EPI-PEI-SS/
If you are a person with EPI and you are still struggling with symptoms of EPI (PEI), you may find it handy to take the EPI/PEI-SS to document your symptom burden. Then, as you adjust your enzyme dosing, you can periodically take the EPI/PEI-SS again (every few weeks or months) and use it to help you track whether things are improving. You can use the web version, or if you want to also track your enzyme (PERT) dosing, you can use the EPI/PEI-SS in both the iOS (https://bit.ly/PERT-Pilot-iOS) and Android (https://bit.ly/PERT-Pilot-Android) versions of “PERT Pilot”. Then you can see your scores and view them over time in the same place.
Note that the scores of people with EPI in the study don’t mean that ‘this is as good as it gets’ when you go on enzymes. Many people with EPI indicate that they feel they are not dosing enough enzymes (see this study); the scores on the EPI/PEI-SS reflect this. It is possible for people with EPI to get scores in the non-EPI range, once enzymes are regularly dosed to match what you’re eating. (For example, my score went from well above the cutoff to well below the average non-EPI score once I started enzymes.)
If you are a doctor, take a look at the EPI/PEI-SS (see links, or Table 1 in the paper) so you know what some of the symptoms of EPI are. Notably, be aware that diarrhea and weight loss are not the only symptoms of EPI. In the diabetes sub-study, for example, we found food-related behaviors to be a key variable, as many people intuitively adjust what or how they are eating to try to eliminate symptoms on their own. Pain is not prominent in all corners of the EPI community (it’s more common among people with pancreatitis). Feel free to have patients use the EPI/PEI-SS any time and use it as part of your shared decision making process.
 If you have any feedback (for example, if it’s been helpful or not), you can email me any time (Dana+EPI-PEI-SS@OpenAPS.org). I’d also love to collaborate, if you’re interested in partnering on any research studies. We have some ongoing studies in different countries (US, Ireland, New Zealand, Australia) in different populations (general population; people with diabetes; people with pancreatic cancer; etc) and I’m looking forward to partnering with other researchers on additional validation studies and exploring if and how the EPI/PEI-SS can help us address some of the gaps of real-world clinical practice and life with EPI.
If you’re a researcher with shared interest in EPI…ditto the above!
—
Read the research referenced in this blog post: https://doi.org/10.3390/epidemiologia6030048
—
Cite it: Lewis DM, Landers A. Development of Novel Symptom Score to Assist in Screening for Exocrine Pancreatic Insufficiency. Epidemiologia. 2025; 6(3):48. https://doi.org/10.3390/epidemiologia6030048
—
Questions? Please comment below!
If you have EPI-specific questions, you might also like this blog post with 25 questions and answers about EPI (PEI) ranging from symptoms and diagnosis to treatment and dosing titration.