Right now, #DIYPS is still n=1 (me), so until we can have more people using the system and verifying the algorithms (click here to learn more about carbohydrate decay rates and how you can test this yourself) and showing the applicability for a wider group of people, we’ll have to wait and see how these results translate to other people. With this in mind (and with the thought that it’s frustrating that A1c is the ‘holy grail’ of diabetes), I wanted to start looking at additional ways to utilize #DIYPS data, so I had some relevant data between the CGM data and the A1c.
Having this data at my fingertips thanks to #DIYPS provides a great balance between the flood of data I get every day (288 individual data points per CGM) and the three month “benchmark” of A1c.
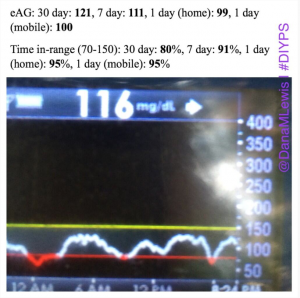
Why these stats are helpful:
- I can track overall average (eAG) over time, without having to wait 3 months for the next A1c value.
- I don’t have to guess where I’m at or go borrow a Windows computer to look at my CGM data.
- I’m not chasing a lower A1c/eAG at the expense of all else (i.e. having lots of lows). A <120 average for a week is good; but if my time in range is <80%, that’s not ideal. Finding a balance between time in range (95%+ is great, 90%+ is good, 80%+ is target) and a good eAG (<120 or <125) is the ultimate goal.
- If I have a day with higher than usual BGs (usually resulting in a high 24 hour average and low % time in range), I can see the impact it has on a week and the month.
I am happily sharing my “time in range” and eAG numbers, because I am happy with them, and I’m able to show “what is working”. But I have often hesitated to share my A1c data publicly.
Here’s why:
Why do we do we allow any shaming – regarding food or based on snapshots of data – in our communities? Sometimes there is a conversation about the shaming that happens regarding food choices, but I don’t think we apply the same conversation to data-shaming. My hope is that one day, everyone feels safe sharing their A1c, or pictures of their CGM graphs, at any time – even if it’s not the outcome they were hoping for in that moment.
Diabetes is a constant learning process with constant decision-making. Why don’t we frame sharing data and perspectives like this:
- Here’s what didn’t work today: (Image of a CGM roller coaster)”
- “Wow, this (pre-bolusing and then xyz) worked! (Image of someone’s ideal CGM graph)”
- “Hmm, I tried xyz, but didn’t quite work, I’m going to try xyz+1 next time (image of a spike on a CGM graph)”
- “Just got my A1c back: X%. Helps me see that small changes are making a difference in the long run.”
- “Just got my A1c back: X%. Brainstorming ideas with family/care team about what I can do differently.”
Will you join me in pledging to end data-shaming for PWDs (people with diabetes)?
- I pledge to stop making snap-judgments about other people’s diabetes data.One data point (A1c or a single BG reading) or a snapshot (3 hour or 24 hour CGM graph) does not tell the story of someone’s decision making and choices. It tells the outcomes of hundreds of decisions that we don’t know about, and hundreds of variables that someone doesn’t have control over. As it’s not our data and not our lives, we have no business making judgments regarding it.
- I pledge to start a conversation about data-shaming and bring awareness to this problem when I see it happening.
Great post, Dana. You better be careful or you’re going to turn into a blogger!
Down with the data shaming. I agree. And I’ve got my torch and pitchfork ready to go.
Wonderful conquer! I need to apprentice because you change your web site, exactly how can i join to get a website internet site? The particular consideration forced me to be some sort of appropriate cope. My spouse and i had been little bit familiar of this the over the air presented amazing clear notion